 E-mail alert
 Rss
Rss

Spatial variation assessment of groundwater quality using multivariate statistical analysis(Case Study: Fasa Plain, Iran)
-
Abstract: Groundwater is considered as one of the most important sources for water supply in Iran. The Fasa Plain in Fars Province, Southern Iran is one of the major areas of wheat production using groundwater for irrigation. A large population also uses local groundwater for drinking purposes. Therefore, in this study, this plain was selected to assess the spatial variability of groundwater quality and also to identify main parameters affecting the water quality using multivariate statistical techniques such as Cluster Analysis (CA), Discriminant Analysis (DA), and Principal Component Analysis (PCA). Water quality data was monitored at 22 different wells, for five years (2009-2014) with 10 water quality parameters. By using cluster analysis, the sampling wells were grouped into two clusters with distinct water qualities at different locations. The Lasso Discriminant Analysis (LDA) technique was used to assess the spatial variability of water quality. Based on the results, all of the variables except sodium absorption ratio (SAR) are effective in the LDA model with all variables affording 92.80% correct assignation to discriminate between the clusters from the primary 10 variables. Principal component (PC) analysis and factor analysis reduced the complex data matrix into two main components, accounting for more than 95.93% of the total variance. The first PC contained the parameters of TH, Ca2+, and Mg2+. Therefore, the first dominant factor was hardness. In the second PC, Cl-, SAR, and Na+ were the dominant parameters, which may indicate salinity. The originally acquired factors illustrate natural (existence of geological formations) and anthropogenic (improper disposal of domestic and agricultural wastes) factors which affect the groundwater quality.
-
Key words:
- Groundwater /
- Iran /
- Multivariate statistical methods /
- Pollution
-

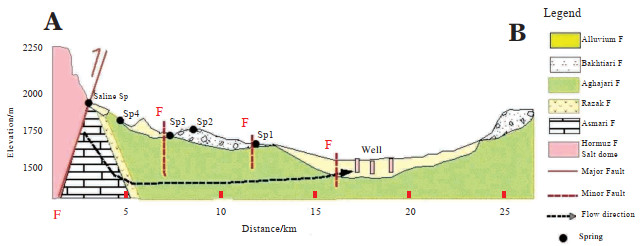
Figure 5. Schematic hydrogeological cross section of the study area (Bagheri R et al. 2017)

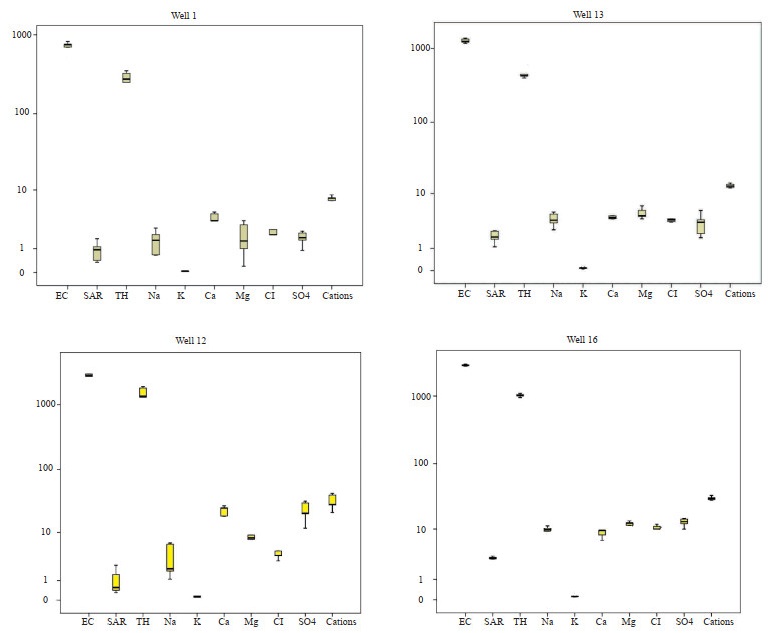
Figure 6. Box plots of groundwater quality parameters for typical wells of two clusters
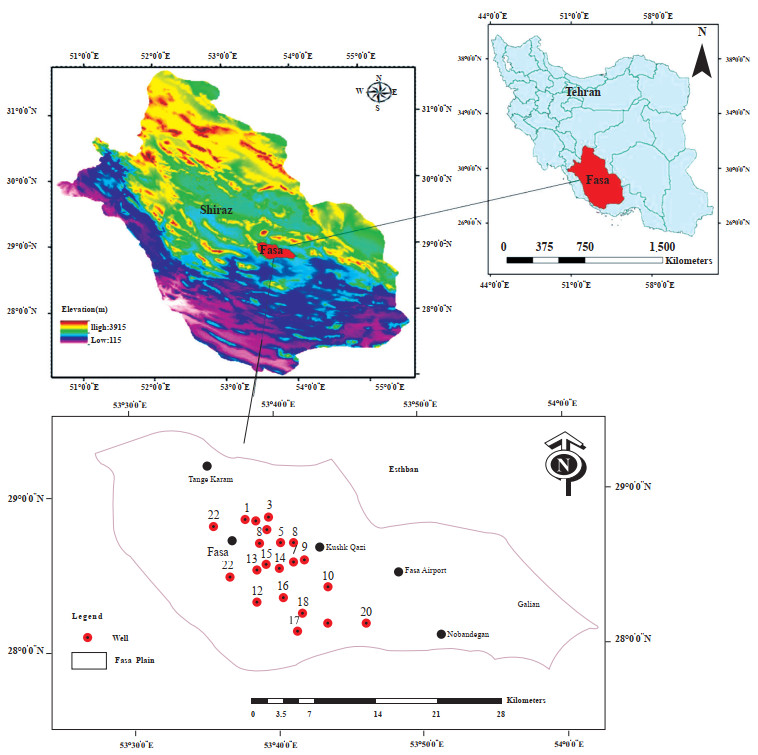
Table 1. The ID of sampling wells
ID Sampling site ID Sampling site 1 Jangalkari 12 Qanatno 2 Tonbakan 13 Kamal Abad 3 Toureh 14 Kheir Abad 4 Baniyan 15 Firuzemard 5 Kahnekoyeh 16 Dastjeh 6 Shomal Fasa 17 Baghe Jafari 7 Kushk Qazi 1 18 Sahraroud 8 Kushk Qazi 2 19 Saad Abad 9 Rahmat Abad 20 Ghiyas Abad 10 Harom 21 Soghad 11 Chaghad 22 Cheshme Abnarak  下载: 导出CSV
Table 2. Descriptive statistics of groundwater quality parameters ranges and their comparison with the Iranian standard for drinking water
Variable Iranian permissible limit N Minimum Maximum Mean Std. Deviation EC (µmhos/cm) 1 400 110 333 52 00 1 441.43 843.99 Cl- (ppm) 400 110 0.15 22.50 4.89 3.73 TH (ppm as CaCO3) 500 110 166 2 000 570.79 367.80 SAR (-) - 110 0.11 4.17 1.56 0.92 K+ (ppm) 12 110 0.01 0.32 0.07 0.05 Na+ (ppm) 200 110 0.15 17.39 3.77 2.80 Mg2+ (ppm) 30 110 0.20 22.50 5.30 3.85 Ca2+ (ppm) 300 110 2.00 27.00 6.11 4.44 Cations (ppm) - 110 3.72 57.66 15.26 9.40 SO42- (ppm) 400 110 0.19 33.92 5.47 6.14 Valid N (listwise) 110
下载: 导出CSV
Table 3. Spatial clustering of sampling wells
Groups EC Cl- TH SAR K+ Na+ Mg2+ Ca2+ Cations SO42- No. of wells 1 1 154.7 4.0 445.4 1.4 0.06 3.1 4.1 4.8 12.1 3.4 18 2 2 731.8 9.1 1 135 2.1 0.14 6.8 10.7 12.0 29.7 14.6 4
下载: 导出CSV
Table 4. Independent sample test
Levene's test for equality of variances t-test for equality of means Variable F sig. t df Sig.
(2-tailed)Mean difference
(LP-HP)Std. error difference EC Equal variances assumed 4.215 0.053 -8.462 20 0.000 -1 577.222 186.374 Cl- Equal variances assumed 1.047 0.318 -4.777 20 0.000 -5.122 1.072 TH Equal variances assumed 0.547 0.468 -8.305 20 0.000 -689.589 83.031 SAR Equal variances not assumed 7.445 0.013 -1.219 3.380 0.150 -0.626 0.514 K+ Equal variances assumed 0.079 0.782 -7.410 20 0.000 -0.077 -0.010 Na+ Equal variances not assumed 9.556 0.006 -2.570 3.293 0.037 -3.750 1.460 Mg2+ Equal variances assumed 0.862 0.364 -6.679 20 0.000 -6.595 0.987 Ca2+ Equal variances not assumed 19.526 0.000 -2.545 3.073 0.041 -7.193 2.826 Cations Equal variances assumed 2.731 0.114 -9.022 20 0.000 -17.613 1.952 SO42- Equal variances not assumed 10.417 0.004 -3.891 3.138 0.014 -11.186 2.875
下载: 导出CSV
Table 5. Resulted coefficients of LDA method
Variable EC Cl- TH SAR K+ Na+ Mg2+ Ca2+ Cations SO42- LDA coefficient -0.423 -0.215 -0.388 0.000 -0.297 -0.144 -0.351 -0.298 -0.430 -0.345
下载: 导出CSV
Table 6. Classification matrix obtained from LDA of spatial variation of the groundwater in the Fasa Plain
Predicted cluster determined by LDA Actual cluster Cluster 1 Cluster 2 Cluster 1 95.60 4.40 Cluster 2 10.00 90.00 Total accuracy 92.80
下载: 导出CSV
Table 7. Results of KMO and Bartlett's tests
Kaiser-Meyer-Olkin measure of sampling adequacy 0.623 Bartlett's Test of Sphericity Approx. Chi-Square 919.709 df 45 Sig. 0.000
下载: 导出CSV
Table 8. Total variance explained with two principal components
Component Initial eigenvalues Extraction sums of squared loadings Rotation sums of squared loadings Total Variance
(%)Cumulative
(%)Total Variance
(%)Cumulative
(%)Total Variance
(%)Cumulative
(%)1 7.960 79.600 79.600 7.960 79.600 79.600 5.839 58.393 58.393 2 1.633 16.327 95.928 1.633 16.327 95.928 3.753 37.534 95.928 3 0.284 2.837 98.765 4 0.084 0.842 99.607 5 0.010 0.253 99.860 6 0.004 0.098 99.958 7 0.017 0.035 99.993 8 0.001 0.007 100.000 9 2.774E-6 2.774E-5 100.000 10 3.456E-9 3.456E-8 100.000 Extraction method: Principal component analysis
下载: 导出CSV
Table 9. Rotated component matrixa
Component Variable 1 2 EC (µmhos/cm) 0.828 0.559 Cl- (ppm) 0.516 0.799 TH (ppm as CaCO3) 0.943 0.329 SAR 0.013 0.954 K+ (ppm) 0.883 0.445 Na+ (ppm) 0.339 0.932 Mg2+ (ppm) 0.697 0.638 Ca2+ (ppm) 0.976 0.008 Cations (ppm) 0.851 0.525 SO42- (ppm) 0.970 0.187 Extraction method: Principal component analysis
Rotation method: Varimax with Kaiser Normalizationa
a. Rotation converged in 3 iterations.
下载: 导出CSV
Table 10. Correlation matrixa of studied variables
Variable EC Cl- TH SAR K+ Na+ Mg2+ Ca2+ Cations SO42- EC 1.000 Cl- 0.878 1.000 TH 0.966 0.757 1.000 SAR 0.535 0.694 0.317 1.000 K+ 0.978 0.787 0.977 0.462 1.000 Na+ 0.798 0.903 0.622 0.908 0.713 1.000 Mg2+ 0.946 0.908 0.879 0.542 0.883 0.804 1.000 Ca2+ 0.804 0.490 0.917 0.068 0.875 0.354 0.616 1.000 Cations 0.998 0.860 0.975 0.509 0.982 0.779 0.930 0.833 1.000 SO42- 0.904 0.609 0.972 0.226 0.944 0.514 0.771 0.961 0.923 1.000 a. Determinant = 1.87E-024
下载: 导出CSV
-
Alavi M. 2004. Regional stratigraphy of the Zagros fold-thrust belt of Iran and its pro-foreland evolution. American Journal of Science, 304: 1-20. doi: 10.2475/ajs.304.1.1 Amiri MJ, Bahrami M, Beigzadeh B, et al. 2018. A response surface methodology for optimization of 2, 4-dichlorophenoxyacetic acid removal from synthetic and drainage water: A comparative study. Environmental Science and Pollution Research, 25(34): 34277-34293. doi: 10.1007/s11356-018-3327-x Azhar SC, Aris AZ, Yusoff MK, et al. 2015. Classification of river water quality using multivariate analysis. Procedia Environmental Sciences, 30: 79-84. doi: 10.1016/j.proenv.2015.10.014 Bagheri R, Bagheri F, Eggenkamp HGM. 2017. Origin of groundwater salinity in the Fasa Plain, southern Iran, hydrogeochemical and isotopic approaches. Environmental Earth Sciences, 76: 662. doi: 10.1007/s12665-017-6998-6 Bahrami M, Amiri MJ, Beigzadeh B. 2018. Adsorption of 2, 4-dichlorophenoxyacetic acid using rice husk biochar, granular activated carbon, and multi-walled carbon nanotubes in a fixed bed column system. Water Science and Technology, 78(8): 1812-1821. doi: 10.2166/wst.2018.467 Bahrami M, Brumand-Nasab S, Kashkooli HA, et al. 2013. Cadmium removal from aqueous solutions using modified magnetite nanoparticles. Iranian Journal of Health and Environment, 6(2): 221-232. http://www.researchgate.net/publication/313403189_Cadmium_removal_from_aqueous_solutions_using_modified_magnetite_nanoparticles Bahrami M, Zarei AR, Chakav S. 2017. Analysis of drought transitions using log-linear models in Iran. International Journal of Water, 11(3): 266-278. http://www.wanfangdata.com.cn/details/detail.do?_type=perio&id=53a548b314951d9d6fa4ebe78702fb2a Bencer S, Boudoukha A, Mouni L. 2016. Multivariate statistical analysis of the ground-water of Ain Djacer area (Eastern of Algeria). Arabian Journal of Geosciences, 9(4): 1-10. doi: 10.1007/s12517-015-2277-6 Dehghani R, Mahvi AH, Rabani D, et al. 2015. Evaluation of chemical quality and salinity origin of groundwater in a semi aried area; Seyed Gholi region Saveh, Iran. Archives of Hygiene Sciences, 4(2): 100-108. http://jhygiene.muq.ac.ir/article-1-142-en.html Ebrahimzadeh S, Boustani F, Shakeri A. 2011. Groundwater quality assessment of the Zarghan Plain, Shiraz, Iran. 2nd International Conference on Environmental Science and Technology IPCBEE, 6. Singapore: IACSIT Press. El Alfy M, Faraj T. 2016. Spatial distribution and health risk assessment for groundwater contamination from intensive pesticide use in arid areas. Environmental Geochemistry and Health, 39: 231-253. http://www.wanfangdata.com.cn/details/detail.do?_type=perio&id=a1c0d801ff212841c8abbf755852ea01 El Alfy M, Lashin A, Abdalla F, et al. 2017. Assessing the hydrogeochemical processes affecting groundwater pollution in arid areas using an integration of geochemical equilibrium and multivariate statistical techniques. Environmental Pollution, 229: 760-770. doi: 10.1016/j.envpol.2017.05.052 Freeze RA, Cherry JA. 1979. Groundwater. Newjersey: Prentice-Hall, inc: 604. Ghassemi Dehnavi A. 2018. Hydrochemical assessment of groundwater using statistical methods and ionic ratios in Aliguodarz, Lorestan, west of Iran. Journal of Advances in Environmental Health Research, 6: 193-201. http://cn.bing.com/academic/profile?id=66059a58629cb5afd206a8f45101e331&encoded=0&v=paper_preview&mkt=zh-cn Hardle W, Simar L. 2007. Applied multivariate statistical analysis, 2nd edn. Berlin: Springer. Helena B, Pardo R, Vega M, et al. 2000. Temporal evolution of groundwater composition in an alluvial aquifer (Pisuerga River, Spain) by principal component analysis. Water Research, 34(3): 807-816. http://www.cabdirect.org/abstracts/20001907737.html Hummel M, Edelmann D, Kopp-Schneider A. 2017. Clustering of samples and variables with mixed-type data. PLOS ONE, 12(11):e0188274. https://doi.org/10.1371/journal.pone.0188274 doi: 10.1371/journal.pone.0188274 Institute of Standards and Industrial Research of Iran. 2009. Drinking water-physical and chemical specifications. ISIRI No. 1053, the 5th Revision. http://www.isiri.org/Portal/Home/Default.aspx?CategoryID=5f6bbf1b-ac23-4362-a309-9ee95a439628 Lokhande PB, Patil VV, Mujawar HA. 2008. Multivariate statistical analysis of ground-water in the vicinity of Mahad industrial area of Konkan Region, India. International Journal of Applied Environmental Sciences, 3(2): 149-163. http://www.highbeam.com/doc/1G1-216041380.html Mahmood A, Muqbool W, Mumtaz MW, et al. 2011. Application of multivariate statistical techniques for the characterization of groundwater quality of Lahore, Gujranwala and Sialkot (Pakistan). Pakistan Journal of Analytical & Environmental Chemistry, 12(1): 102-112. http://www.oalib.com/paper/2093766 Matiatos I, Alexopoulos A, Godelitsas A. 2014. Multivariate statistical analysis of the hydrogeochemical and isotopic composition of the groundwater resources in northeastern Peloponnesus (Greece). Science of the Total Environment: 476-477, 577-590. http://www.wanfangdata.com.cn/details/detail.do?_type=perio&id=dccb7a7f1a26b0a4426d481f6e8ccabb Matiatos I. 2016. Nitrate source identification in groundwater of multiple land-use areas by combining isotopes and multivariate statistical analysis: A case study of Asopos basin (Central Greece). Science of the Total Environment, 541: 802-814. doi: 10.1016/j.scitotenv.2015.09.134 Matiatos I, Evelpidou N. 2013. Assessment of groundwater quality contamination by nitrate leaching using multivariate statistics and Geographic Information Systems. Understanding freshwater quality problems in a changing world, 361: 183-190. http://www.wanfangdata.com.cn/details/detail.do?_type=perio&id=CC0214089213 Matiatos I, Paraskevopoulou V, Botsou F, et al. 2016. Hydrogeochemical assessment of groundwater quality in a river delta using multivariate statistical techniques. EGU General Assembly Conference Abstracts, 18: 14568. http://adsabs.harvard.edu/doi/2016EGUGA..1814568M McKenna Jr JE. 2003. An enhanced cluster analysis program with bootstrap significance testing for ecological community analysis. Environmental Modelling and Software, 18(3): 205-220. doi: 10.1016/S1364-8152(02)00094-4 Mozafarizadeh J, Sajadi Z. 2013. Investigation of saline water intrusion in the Borazjan freshwater aquifer from the Dalaki and Helleh rivers. Journal of Electromagnetic and Application, 6(16): 69-78. http://openurl.ebscohost.com/linksvc/linking.aspx?stitle=Journal%20of%20Electromagnetic%20Waves%20and%20Applications&volume=27&issue=18&spage=2298 Noshadi M, Ghafourian A. 2016. Groundwater quality analysis using multivariate statistical techniques (Case study: Fars Province, Iran). Environmental Monitoring and Assessment, 188: 1-13. doi: 10.1007/s10661-015-4999-z Nosrati K, Van Den Eeckhaut M. 2012. Assessment of groundwater quality using multivariate statistical techniques in the Hashtgerd Plain, Iran. Environmental Earth Sciences, 65(1): 331-344. http://www.wanfangdata.com.cn/details/detail.do?_type=perio&id=4e5c8d7399179d583e4877b20172da8f Pandit S, Gupta S. 2011. A comparative study on distance measuring approaches for clustering. International Journal of Computer Science, 2(1): 29-31. http://www.oalib.com/paper/2758894 Rogerson PA. 2001. Statistical methods for geography. London: Sage Publications Ltd. Sarbu C, Pop HF. 2005. Principal component analysis versus fuzzy principal component analysis. A case study: The quality of Danube water (1985-1996). Talanta, 65: 1215-1220. http://cn.bing.com/academic/profile?id=b77299b2e3cdaae5fa7f659261ff8787&encoded=0&v=paper_preview&mkt=zh-cn Singh KP, Malik A, Sinha S. 2005. Water quality assessment and apportionment of pollution sources of Gomti River (India) using multivariate statistical techniques: A case study. Analytica Chimica Acta, 538(1-2): 355-374. doi: 10.1016/j.aca.2005.02.006 Singh A, Yadav A, Rana A. 2013. K-means with three different distance metrics. International Journal of Computer Applications, 67(10): 13-17. doi: 10.5120/11430-6785 Srivastava SK, Ramanathan AL. 2008. Geo-chemical assessment of groundwater quality in vicinity of Bhalswa landfill, Delhi, India, using graphical and multivariate statistical methods. Environmental Geology (Berlin), 53: 1509-1528. doi: 10.1007/s00254-007-0762-2 US Salinity Laboratory Staff. 1954. Diagnosis and improvement of saline and alkali soils. Washington DC: US Department of Agriculture Handbook, 60: 160. Usman UN, Toriman ME, Juahir H, et al. 2014. Assessment of groundwater quality using multivariate statistical techniques in Terengganu. Science and Technology, 4(3):42-49. DOI: 10.5923/j.scit.20140403.02 Witten DM, Tibshirani R. 2011. Penalized classification using Fisher's linear discriminant. Journal of the Royal Statistical Society, 73(5): 753-772. doi: 10.1111/j.1467-9868.2011.00783.x Yidana SM. 2010. Groundwater classification using multivariate statistical methods: Birimian Basin, Ghana. Journal of Environmental Engineering, 136(12): 1379-1388. doi: 10.1061/(ASCE)EE.1943-7870.0000291 Zarei AR, Bahrami M. 2016. Evaluation of quality and quantity changes of undergroundwater in the Fasa Plain, Fars (2006-2013). Iranian Journal of Irrigation & Water Engineering, 6(24): 103-113. http://www.researchgate.net/publication/309291575_Evaluation_of_quality_and_quantity_changes_of_underground_water_in_Fasa_plain_Fars_2006_-_2013 -


 点击查看大图
计量
- 文章访问数: 2895
- HTML全文浏览量: 1179
- PDF下载量: 138
- 被引次数: 0


