 E-mail alert
 Rss
Rss

Effects of urbanization on groundwater level in aquifers of Binh Duong Province, Vietnam
-
Abstract: The purpose of this paper was to assess the impact of urbanization on the groundwater level (GWL) in aquifers of Binh Duong (BD) Province. The research method is to analyze the trend of GWL, the recharge capacity of surface over time and the relationship between them. The data of the GWL used in the study are the average values in the dry and rainy seasons of 35 observation wells from 2011 to 2018, which are in Pleistocene and Pliocene aquifers. The ability to recharge groundwater from the surface in this study was represented by the curve number (CN), a parameter used in hydrology for calculating direct runoff or infiltration from rainfall. The land use data to identify the CN was analyzed from the Landsat images. The results show that besides over-exploitation, the change of surface characteristic due to the urbanization development process is also the cause of the GWL decline. The analysis of seasonal GWL data shows that the increase in impervious surface area is the cause of GWL decline in the Pleistocene aquifer, which is more evident in the rainy season than in the dry season. The statistical results also show that in the rainy season and in shallow aquifers, a higher CN change can be found with the wells that had a remarkable GWL decline compared to the remaining wells.
-
Key words:
- Urbanization /
- Land use change /
- Impervious surface /
- Curve number /
- Groundwater level
-

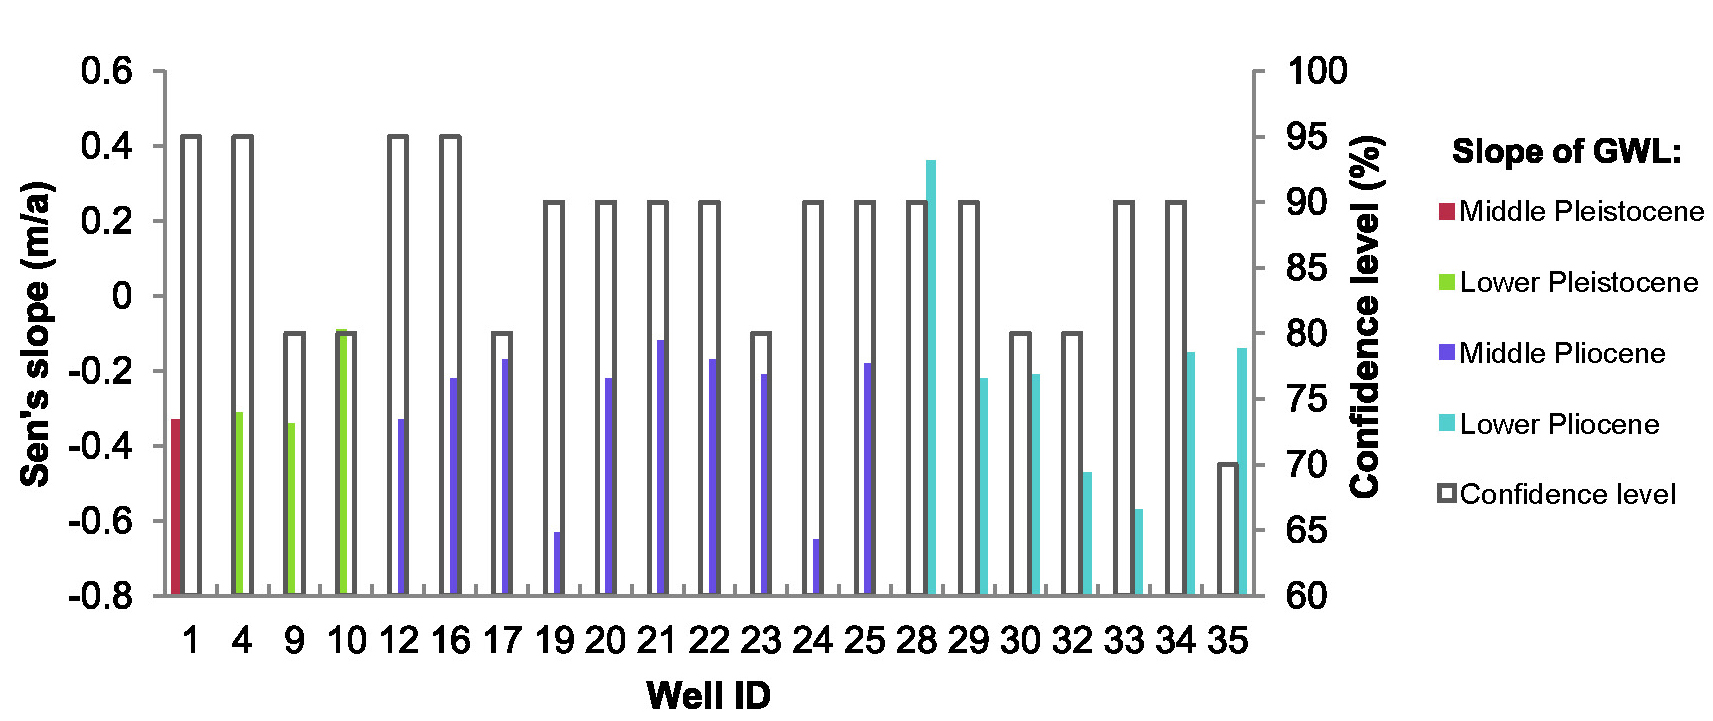
Figure 5. Results of MK test and Sen's slope analysis of GWL at observation wells in dry seasons of 2011-2018

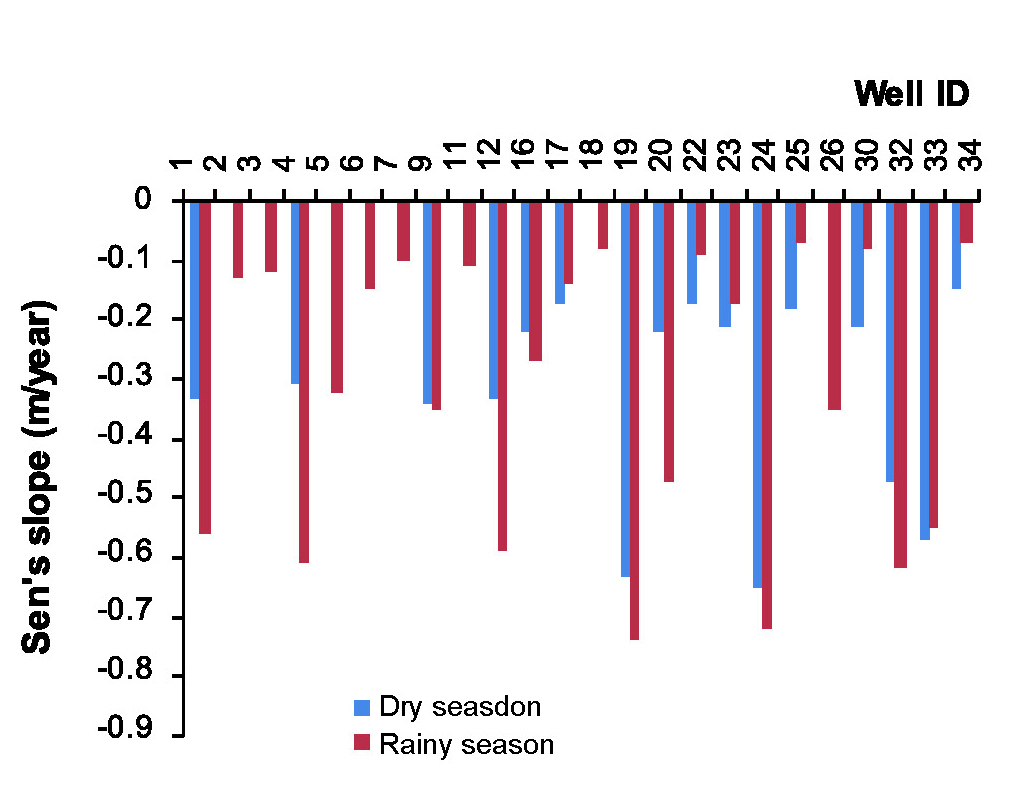
Figure 6. Results of MK test and Sen's Slope analysis of GWL in observation wells in rainy seasons of 2011-2018

Figure 7. The increase of groundwater extraction in the period of 2011-2018 in the aquifers: a) n22 and b) n21
Table 1. Characteristics of the main aquifers in BD
Series Subseries Aquifer Mean thickness (m) Depth from surface (m) Lithology Storage capacity Pleistocene Upper qp3 Sand, pebble, gravel and clay powder Very low Middle qp2-3 13.2 15~30 Pebble, gravel, sand and clay Low Lower qp1 20.1 30~50 Sand, pebble and gravel Medium Pliocene Middle n22 16.1 50~80 Fine sand and pebble, sand and clay powder Medium to high Lower n21 43.6 > 80 Sand, pebble, gravel, sand mixed with clay powder High  下载: 导出CSV
Table 2. Change of built-up areas over the 2011-2018 period
ID Administrative units Area (ha) Built-up areas (ha) Built-up areas (%) Increase (%) 2011 2018 2011 2018 1 Tan uyen Town 18 363 2 265 8 292 12.3 45.2 32.8 2 Di An Town 6 010 2 794 4 745 46.5 79.0 32.5 3 Thuan An Town 8 373 3 116 5 748 37.2 68.7 31.4 4 Thu Dau Mot City 11 840 2 838 5 960 24.0 50.3 26.4 5 Ben Cat Town 23 486 2 210 7 159 9.4 30.5 21.1 6 Bac Tan Uyen District 40 824 950 5 617 2.3 13.8 11.4 7 Phu Giao District 54 370 781 6 021 1.4 11.1 9.6 8 Bau Bang District 34 047 786 3 731 2.3 11.0 8.7 9 Dau Tieng District 72 044 872 5 201 1.2 7.2 6.0
下载: 导出CSV
Table 3. The average of CN in administrative units
ID Administrative units CN mean △CN Year 2011 Year 2018 1 Tan uyen Town 74.1 79.0 4.9 2 Di An Town 80.4 85.0 4.6 3 Thuan An Town 79.2 83.6 4.4 4 Thu Dau Mot City 76.8 80.5 3.7 5 Ben Cat Town 71.2 74.6 3.4 6 Bac Tan Uyen District 68.9 70.9 2 7 Phu Giao District 67.4 69.2 1.8 8 Bau Bang District 67.9 69.7 1.8 9 Dau Tieng District 69.2 70.5 1.3 10 Binh Duong Province 70.0 72.3 2.3
下载: 导出CSV
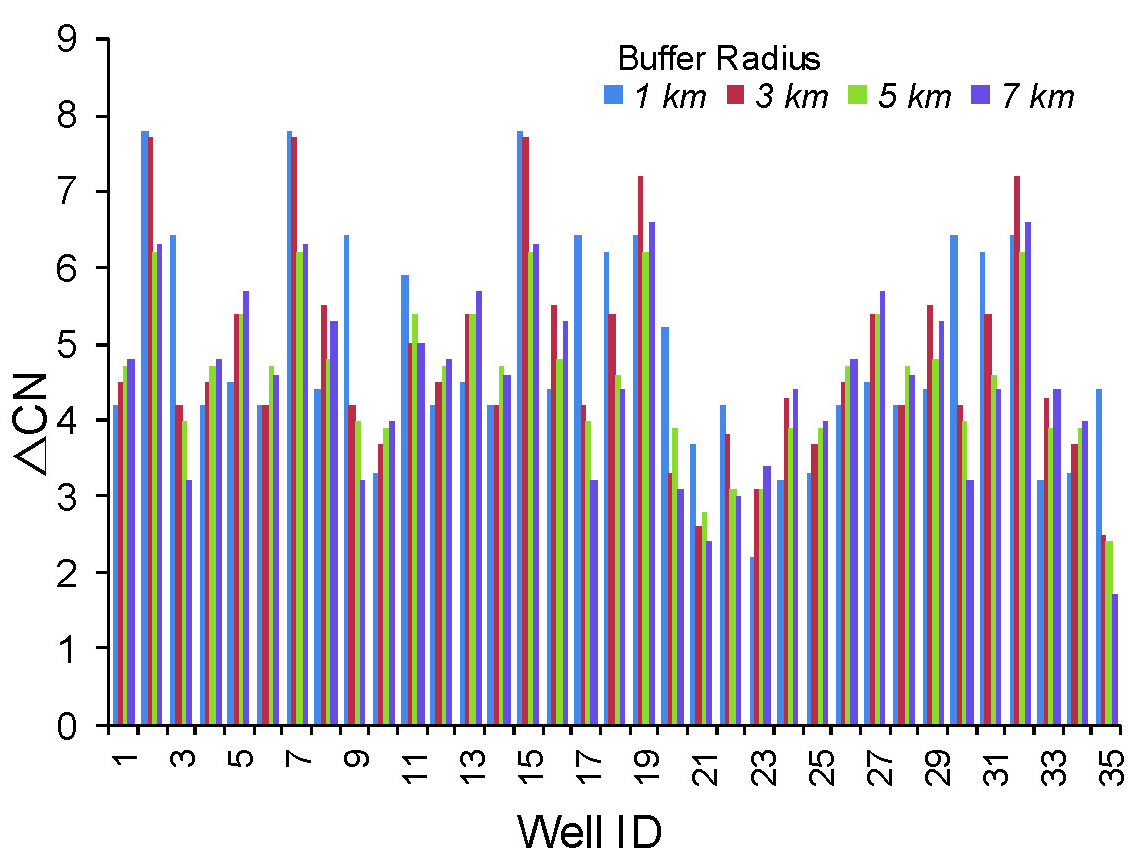
Table 4. The average of CN in the buffer zone of wells
Buffer radius 1 km 3 km 5 km 7 km CN 2011 Min 65.8 65.9 66.1 66.0 Max 83.7 83.1 81.2 81.2 Mean 76.0 74.2 73.6 73.1 CN 2018 Min 68.4 68.5 68.5 67.7 Max 87.9 87.3 85.9 85.9 Mean 80.9 79.0 78.2 77.6 △CN Min 2.2 2.5 2.4 1.7 Max 7.8 7.7 6.2 6.6 Mean 4.9 4.8 4.6 4.5
下载: 导出CSV
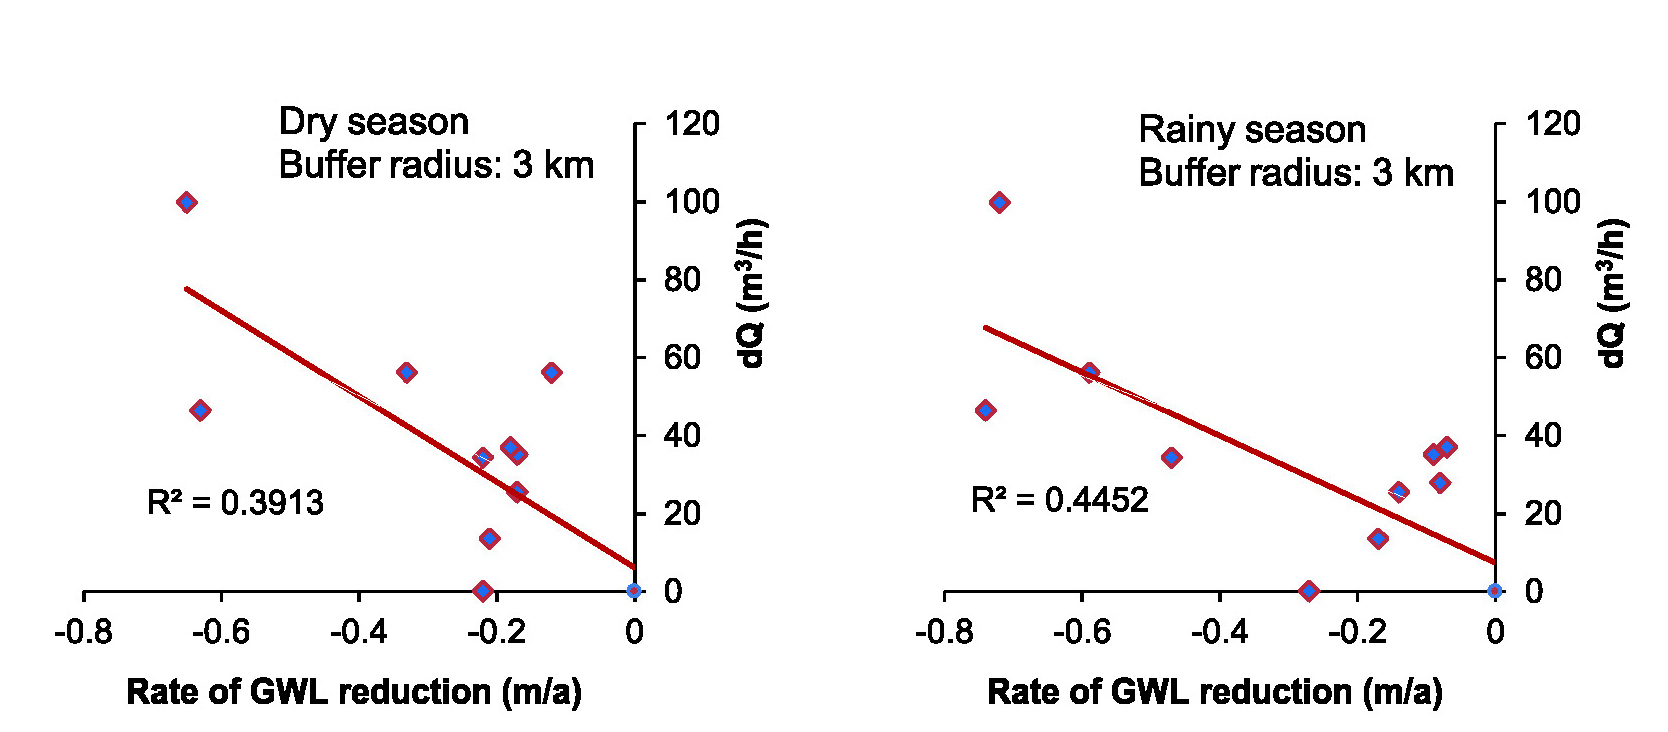
Table 5. The correlation coefficient (R) between the rate of GWL reduction and dQ
Dry season Rainy season Mean Buffer radius 1 km 3 km 5 km 1 km 3 km 5 km 1 km 3 km 5 km qp1 -0.71 -0.94 -0.87 -0.99 -0.67 -0.29 -0.85 -0.80 -0.58 n22 -0.61 -0.63 -0.58 -0.57 -0.67 -0.49 -0.59 -0.65 -0.53 n21 -0.54 -0.55 -0.59 -0.50 -0.62 -0.73 -0.52 -0.59 -0.66
下载: 导出CSV
Table 6. Comparison of GWL trends in rainy season and dry season
Series Aquifer The number of wells tends to decrease Sen's slope (m/a) Mean Max Dry season Rainy season Dry season Rainy season Dry season Rainy season Pleistocene qp2-3 1 3 -0.33 -0.29 -0.33 -0.56 qp1 2 6 -0.33 -0.27 -0.34 -0.61 Pliocene n22 9 10 -0.31 -0.33 -0.65 -0.74 n21 4 5 -0.35 -0.33 -0.57 -0.62
下载: 导出CSV
Table 7. Results of MK test and Sen's Slope analysis of rainfall at weather stations in the 2011-2018 period
Season Weather station Sen's slope (mm/season) Trend Confidence level (%) Dry season Tay Ninh 5.7 Unknown Dong Phu 3.1 Unknown Tri An 2.5 Unknown Tan Son Hoa 2.2 Unknown So Sao 9.1 Unknown Rainy season Tay Ninh 29.8 Increasing 60 Dong Phu 42.0 Unknown Tri An 24.3 Unknown Tan Son Hoa 70.8 Increasing 70 So Sao 50.0 Increasing 80
下载: 导出CSV
Table 8. Results of MK test and Sen's Slope analysis of rainfall at weather stations in the 1988-2018 period
Season Weather station Sen's slope (mm/season) Trend Confidence level (%) Dry season Tay Ninh 2.1 Unknown Dong Phu 4.6 Increasing 80 Tri An 2.3 Increasing 90 Tan Son Hoa 6.0 Increasing 98 So Sao 3.9 Increasing 90 Rainy season Tay Ninh 2.4 Unknown Dong Phu 1.9 Unknown Tri An 8.1 Increasing 90 Tan Son Hoa 7.2 Unknown So Sao 3.3 Unknown
下载: 导出CSV
Table 9. Infiltration change in the rainy season over the period of 2011-2018
ID Administrative units Infiltration rate (mm/season) Change (%) CN of 2011 CN of 2018 1 Tan Uyen Town 570 460 19 2 Di An Town 428 326 24 3 Thuan An Town 455 357 22 4 Thu Dau Mot City 509 426 16
下载: 导出CSV
Table 10. The mean of △CN by group, buffer radius and aquifers
Group Series Number △CN by buffer radius 1 km 3 km 5 km 7 km 1 Pleistocene 6 5.8 5.7 5.4 5.1 Pliocene 10 4.6 4.9 4.8 4.8 2 Pleistocene 5 4.8 4.5 4.6 4.5 Pliocene 14 4.7 4.5 4.4 4.2 Difference Pleistocene 1 1.2 0.8 0.6 Pliocene -0.1 0.4 0.4 0.6
下载: 导出CSV
-
Abushandi E, Merkel B. 2013. Modelling rain-fall runoff relations using HEC-HMS and IHA-CRES for a single rain event in an arid region of Jordan. Water Resources Management, 27: 2391-2409. doi: 10.1007/s11269-013-0293-4 Aish A, Batelaan O, De Smedt F. 2010. Distributed recharge estimation for groundwater mode-lling using WETSPASS, case study: Gaza Strip, Palestine. Arabian Journal for science and Engineering, 35(1B): 155-164. http://search.ebscohost.com/login.aspx?direct=true&db=aph&AN=54292478&site=ehost-live Arnold CL, Gibbons CJ. 1996. Impervious surface coverage: The emergence of a key environmental indicator. Journal of the American Planning Association, 62(2): 243-258. doi: 10.1080/01944369608975688 Aronica GT, Lanza LG. 2005a. Hydrology in the urban environment. Hydrological Processes, 19(5): 1005-1006. doi: 10.1002/hyp.5641 Aronica GT, Lanza LG. 2005b. Drainage efficiency in urban areas: A case study. Hydrological Processes, 19(5): 1105-1119. doi: 10.1002/hyp.5648 Bhatta B. 2009. Analysis of urban growth pattern using remote sensing and GIS: A case study of Kolkata, India. International Journal of Remote Sensing, 30: 4733-4746. doi: 10.1080/01431160802651967 Bui DD, Kawamura A, Tong TN, et al. 2012. Spatio-temporal analysis of recent ground-water-level trends in the Red River Delta, Vietnam. Hydrogeology Journal, 20: 1635-1650. doi: 10.1007/s10040-012-0889-4 Dams J, Woldeamlak ST, Batelaan O. 2008. Predicting land-use change and its impact on the groundwater system of the Kleine Nete catchment, Belgium. Hydrology and Earth System Sciences, 12(6): 1369-1385. doi: 10.5194/hess-12-1369-2008 Dewan AM, Yamaguchi Y. 2009. Land use and land cover change in Greater Dhaka, Bangladesh: Using remote sensing to promote sustainable urbanization. Applied Geography, 29(3): 390-401. doi: 10.1016/j.apgeog.2008.12.005 Dwarakish GS, Ganasri BP. 2015. Impact of land use change on hydrological systems: A review of current modeling approaches. Cogent Geoscience, 1(1): 1115691. Doi: 10.1080/23312041.2015.1115691 Eshtawi T, Evers M, Tischbein B. 2016. Quan-tifying the impact of urban area expansion on groundwater recharge and surface runoff. Hydrological Sciences Journal, 61(5): 826-843. Fadil A. 2011. Hydrologic modelling of the Bou-regreg watershed (Morocco) using GIS and SWAT Model. Journal of Geographic In-formation System, 3(4): 279-289. doi: 10.4236/jgis.2011.34024 Fohrer N, Haverkamp S, Eckhardt K, et al. 2001. Hydrologic response to land use changes on the catchment scale. Physics and Chemistry of the Earth, Part B: Hydrology, Oceans and Atmosphere, 26(7‐8): 577-582. http://www.sciencedirect.com/science/article/pii/S1464190901000521 Foster S, MacDonald A. 2014. The 'water security' dialogue: Why it needs to be better informed about groundwater. Hydrogeology Journal, 22: 1489-1492. doi: 10.1007/s10040-014-1157-6 Hamad JT, Eshtawi TA, Abushaban AM, et al. 2012. Modeling the impact of land-use change on water budget of Gaza Strip. Journal of Water Resource and Protection, 4: 325-333. doi: 10.4236/jwarp.2012.46036 Hardison EC, O'driscoll M, DeLoatch JP, et al. 2009. Urban land use, channel incision, and water table decline along coastal plain streams, North Carolina. Journal of American Water Resources, 45: 1032-1046. doi: 10.1111/j.1752-1688.2009.00345.x Hollis GE. 2010. The effect of urbanization on floods of different recurrence interval. Water Resources Research, 11 (3): 431-435. Hong Y, Adler R. 2008. Estimation of global SCS curve numbers using satellite remote sensing and geospatial data. International Journal of Remote Sensing, 29: 471-477. doi: 10.1080/01431160701264292 HUANG Tian-ming, PANG Zhong-he. 2010. Estimating groundwater recharge following land‐use change using chloride mass balance of soil profiles: A case study at Guyuan and Xifeng in the Loess Plateau of China. Hydrogeology Journal, 19: 177-186. Jat MK, Garg PK, Khare D. 2008. Monitoring and modelling of urban sprawl using remote sensing and GIS techniques. Int J Appl Earth Obs Geoinf. 10: 26-43. doi: 10.1016/j.jag.2007.04.002 Jonathan MH. 1994. A practical method for estimating the impact of land-Use change on surface runoff, groundwater recharge and wetland hydrology. Journal of the American Planning Association, 60(1): 95-108. doi: 10.1080/01944369408975555 Kendall MG. 1975. Rank correlation methods. London: Charles Griffin: 272. Khatri N, Tyagi S. 2015. Influences of natural and anthropogenic factors on surface and groundwater quality in rural and urban areas. Frontiers in Life Science, 8(1): 23-39. doi: 10.1080/21553769.2014.933716 Laouacheria F, Mansouri R. 2015. Comparison of WBNM and HEC-HMS for runoff hydro-graph prediction in a small urban catch-ment. Water Resources Management, 29: 2485-2501. doi: 10.1007/s11269-015-0953-7 Mann HB. 1945. Nonparametric tests against trend. Econometrica, 13: 245-259. doi: 10.2307/1907187 Marsh TD, Davies PA, Pontin JMA. 1983. The decline and partial recovery of ground water levels below London. Proceedings of the Institution of Civil Engineers, 74: 263-276. doi: 10.1680/iicep.1983.1468 McGrane SJ. 2016. Impacts of urbanization on hydrological and water quality dynamics, and urban water management: A review. Hydrological Sciences J, 61: 13, 2295-2311. Doi: 10.1080/02626667.2015.1128084. Mishra N, Khare D, Gupta KK, et al. 2014. Impact of land use change on groundwater-a review. Advances in Water Resource and Protection, 2: 28-41. O'Driscoll M, Clinton S, Jefferson A, et al. 2010. Urbanization effects on watershed hydrology and in-stream processes in the southern United States. Water, 2 (3): 605-648. doi: 10.3390/w2030605 Okotto L, Okotto-Okotto J, Price H, et al. 2015. Socio-economic aspects of domestic ground-water consumption, vending and use in Kisumu, Kenya. Applied Geography, 58: 189-197. doi: 10.1016/j.apgeog.2015.02.009 Pradeep KN, Jivesh AT, Biranchi ND, et al. 2018. Impact of urbanization on the groundwater regime in a fast growing city in central India. Environ Monit Assess, 146: 339-373. http://www.ncbi.nlm.nih.gov/pubmed/18205022 Rahman A, Aggarwal SP, Netzband M, et al. 2011. Monitoring urban sprawl using remote sensing and GIS techniques of a fast growing urban centre, India. IEEE Journal of Selected Topcis in Applied Earth Observation and Remote Sensing, 4(1): 56-64. doi: 10.1109/JSTARS.2010.2084072 Sahu RK, Mishra SK, Eldho TI. 2012. Performance evaluation of modified versions of SCS curve number method for two watersheds of Maharashtra, India. ISH Journal of Hydraulic Engineering, 18(1): 27-36. doi: 10.1080/09715010.2012.662425 Tang Z, Engel BA, Pijanowski BC, et al. 2005. Forecasting land use change and its environ-mental impact at a watershed scale. Journal of Environmental Management, 76(1): 35-45. United Nations, Department of Economic and Social Affairs, Population Division. 2018. World urbanization prospects: The 2018 revision. The World's Cities in 2018-Data Booklet (ST/ESA/ SER._A/417). USACE. 2000. Hydrologic modeling system HEC-HMS technical reference manual. Hydrologic Engineering Center, Davis, CA. Wada Y, Beek Ludovicus PH, van Kempen CM, et al. 2010. Global depletion of groundwater resources. Geophysical Research Letters, 37: L20402. doi: 10.1029/2010GL044571 Wakode HB, Baier K, Jha R, et al. 2014. Assess-ment of impact of urbanization on ground-water resources using GIS techniques-case study of Hyderabad, India. International Jour-nal of Environmental Research, 8(4): 1145-1158. http://www.researchgate.net/publication/268979978_Assessment_of_Impact_of_Urbanization_on_Groundwater_Resources_using_GIS_Techniques-_Case_Study_of_Hyderabad_India Walsh CJ, Roy AH, Feminella JW, et al. 2005. The urban stream syndrome: Current knowledge and the search for a cure. Journal of the North American Benthological Society, 24(3): 706-723. doi: 10.1899/04-028.1 WWAP (UNESCO World Water Assessment Programme), 2019. The United NationsWorld Water Development Report 2019: Leaving No One Behind. Paris: UNESCO. -


 点击查看大图

计量
- 文章访问数: 807
- HTML全文浏览量: 366
- PDF下载量: 66
- 被引次数: 0


