 E-mail alert
 Rss
Rss

Comparative analysis of bacterial contamination in tap and groundwater: A case study on water quality of Quetta City, an arid zone in Pakistan
-
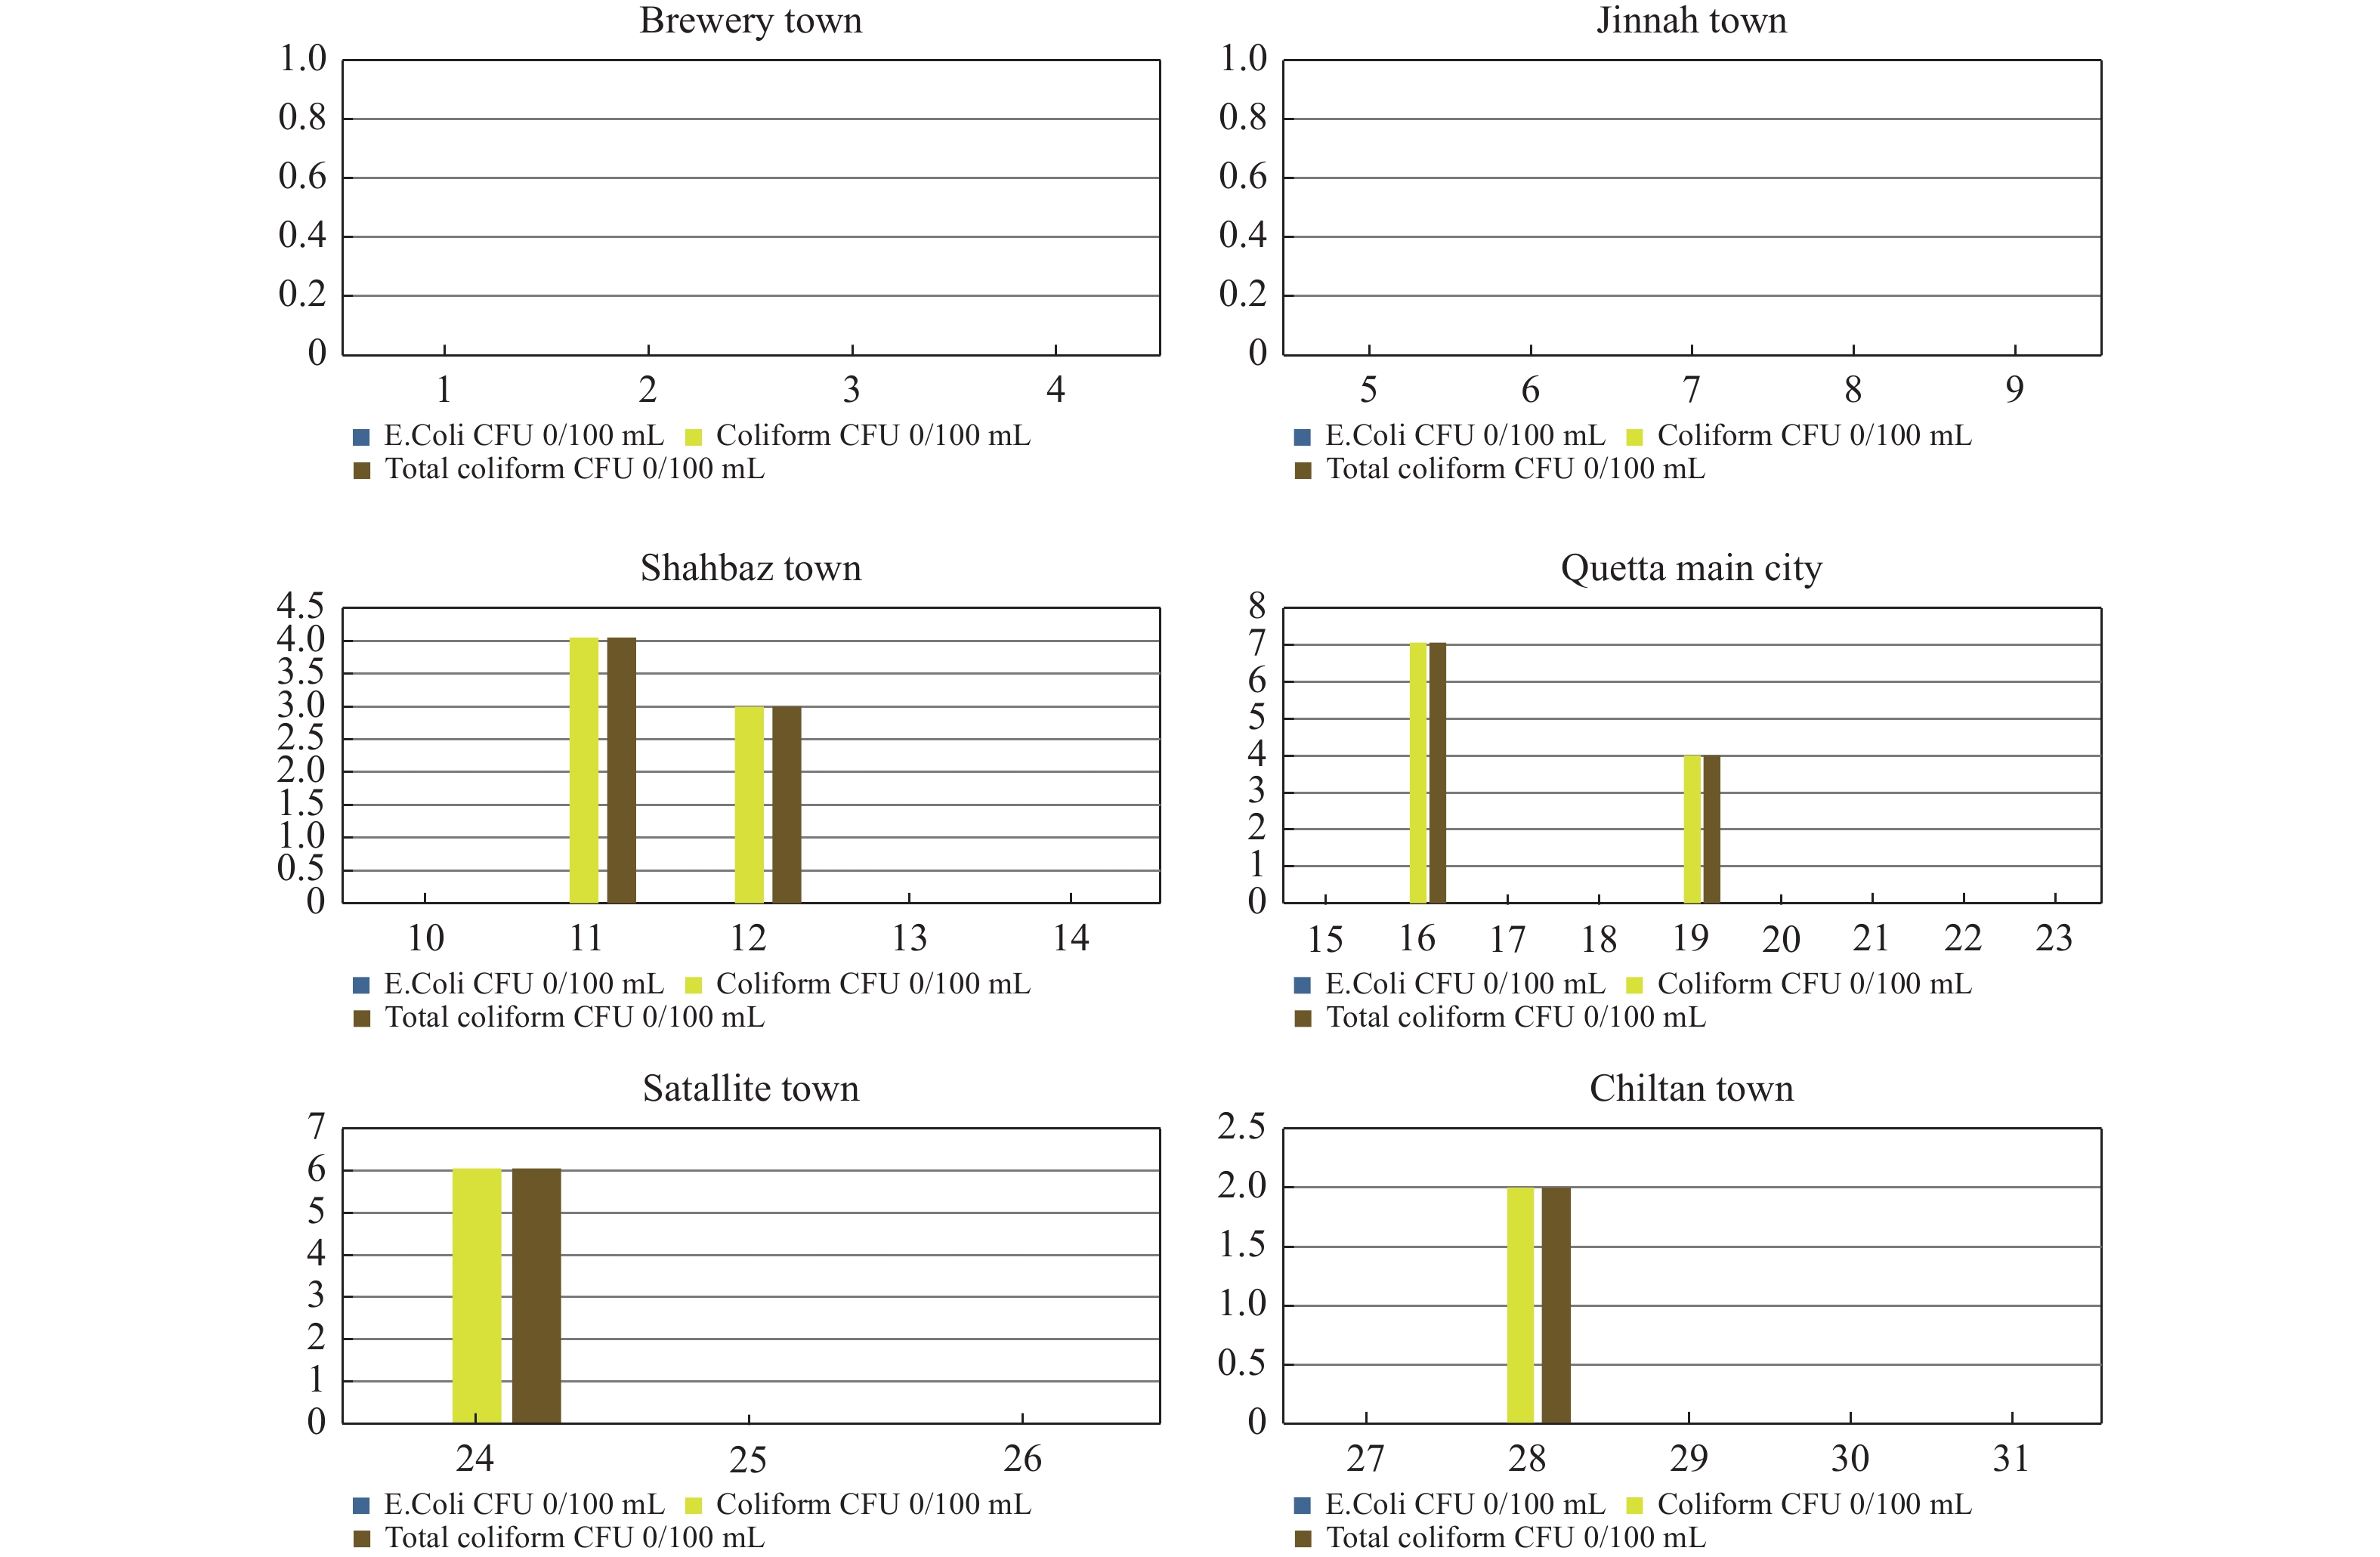
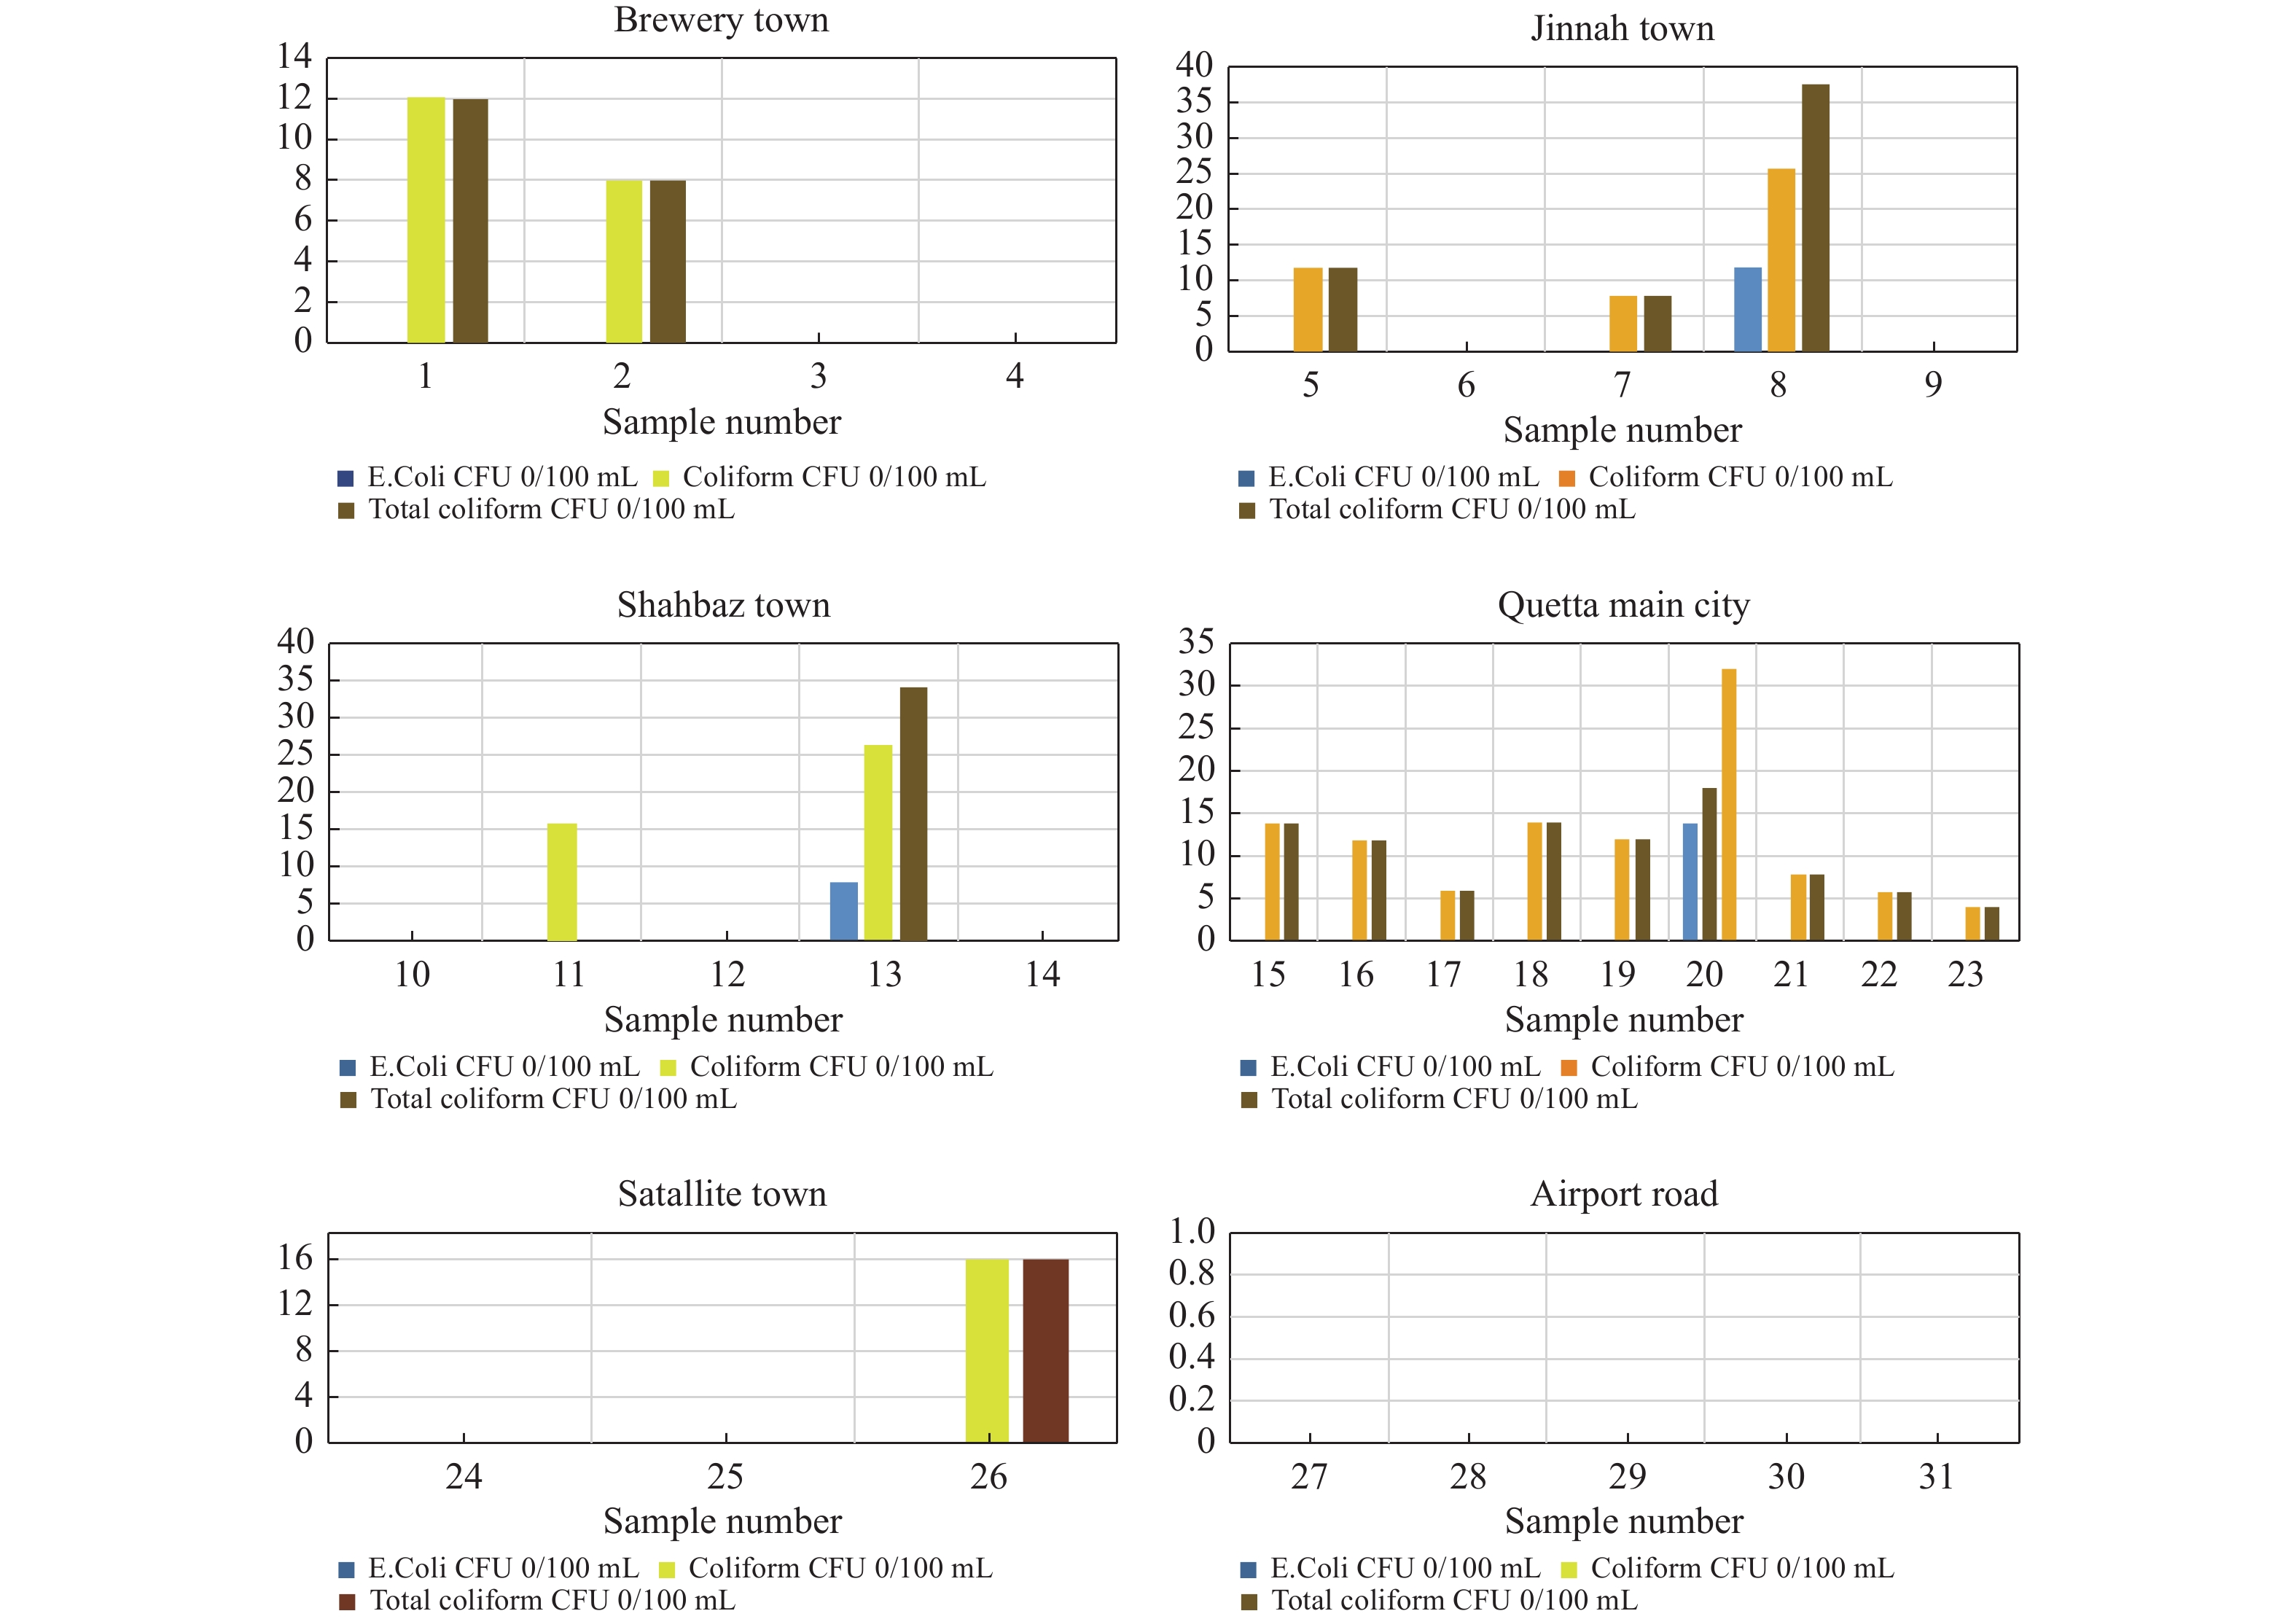
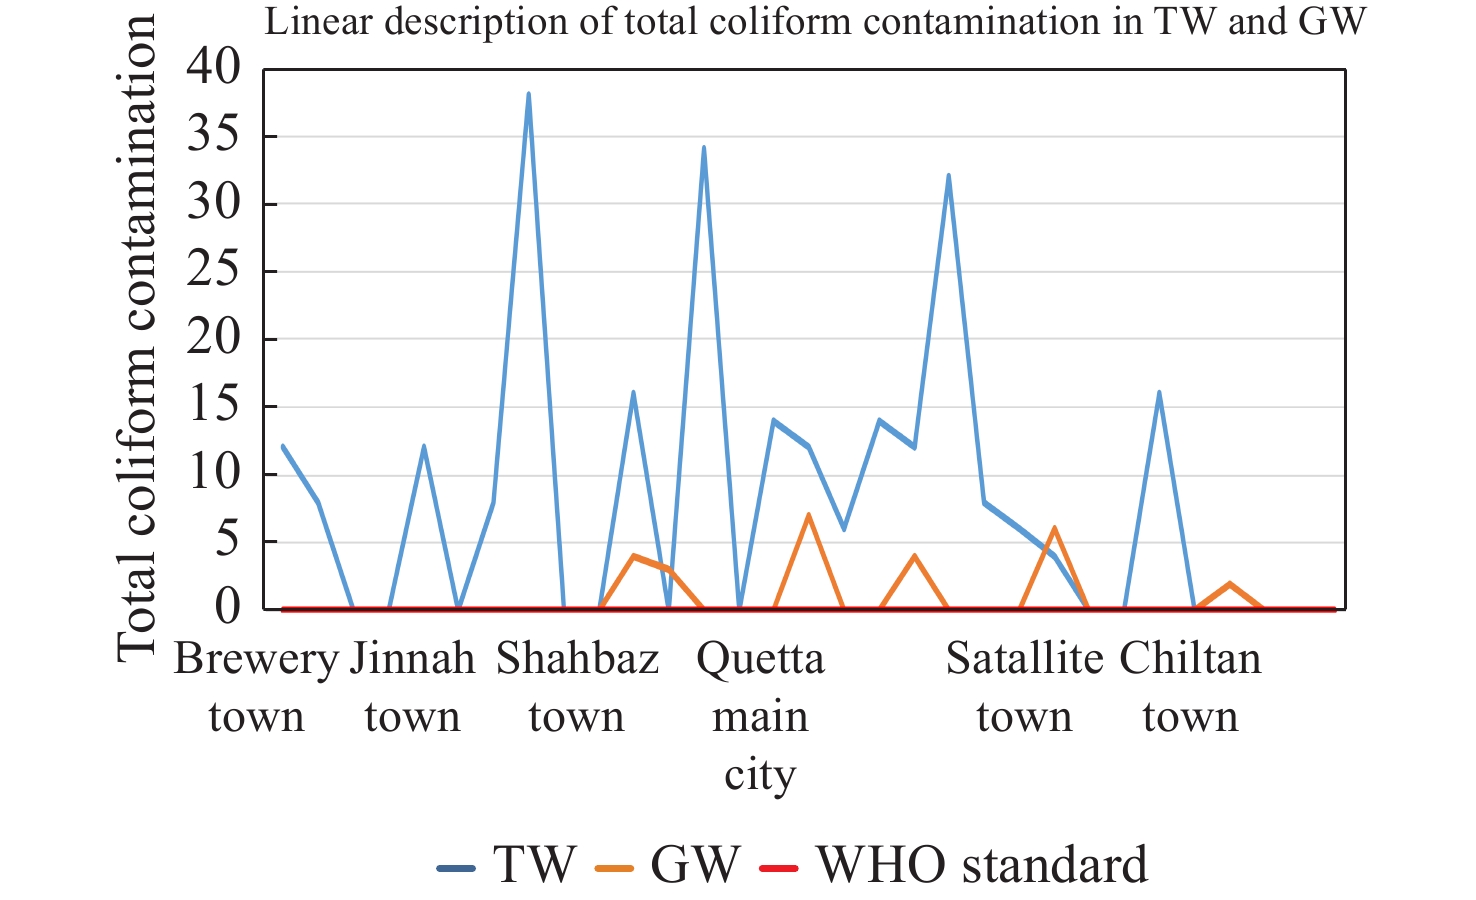
Abstract: Water is an essential element on earth, which provides human a variety of services in domestic use, agriculture, or industries. However, some serious health risks of drinking water are associated with microbial contamination, particularly with fecal matter. Therefore, microbial quality assessment is considered to be a necessary component of water quality assessment. This study investigates microbial contamination of water distributary system around the city by comparing groundwater (GW) and tap water (TW) quality in Quetta city. 31 GW samples and 31 TW samples were collected in the study area during the months of September, October, and November. Fecal coliform test was carried out in laboratory and their average total coliform contamination was computed. Results showed that the TW sample were all contaminated by coliform except for Chiltan town, hence are not considered suitable for drinking without any treatment according to WHO drinking water quality standards. The average coliform concentrations were 12 in Quetta main city, 11.6 in Jinnah town, 5.3 in Satallite town, 10 in Shahbaz town and 5 in Brewery town (0/100 mL CFU) and the TW samples from the three towns were even more contaminated with E.coli. Whereas among the GW, average microbial concentrations were 1.8 in Quetta main city, 2 in Satallite town, 1.4 in Shahbaz town, and 0.4 in Chiltan town (0/100 mL CFU), respectively, which shows that the contamination is occurring within the water distributary pipeline system when the water flows through the pipelines. Moreover, this research will be valuable for researchers and administrative authorities to conduct elaborative studies, and develop new policies to prevent further deterioration of drinking water in the water distribution system by pathogenic microorganisms and ensure safe drinking water to the public of Quetta city.
-
Table 1. Bacterial contamination in TW and GW
Sr#. Name of scheme TW GW E.Coli Coliform Total Coliform E.Coli Coliform Total Coliform CFU/mL CFU/mL CFU/mL CFU/mL CFU/mL CFU/mL 0/100 mL 0/100 mL 0/100 mL 0/100 mL 0/100 mL 0/100 mL 1 Brewery town 0 12 12 0 0 0 2 0 8 8 0 0 0 3 0 0 0 0 0 0 4 0 0 0 0 0 0 5 Jinnah town 0 12 12 0 0 0 6 0 0 0 0 0 0 7 0 8 8 0 0 0 8 12 26 38 0 0 0 9 0 0 0 0 0 0 10 Shahbaz town 0 0 0 0 0 0 11 0 16 16 0 4 4 12 0 0 0 0 3 3 13 8 26 34 0 0 0 14 0 0 0 0 0 0 15 Quetta main city 0 14 14 0 0 0 16 0 12 12 0 7 7 17 0 6 6 0 0 0 18 0 14 14 0 0 0 19 0 12 12 0 4 4 20 14 18 32 0 0 0 21 0 8 8 0 0 0 22 0 6 6 0 0 0 23 0 4 4 0 0 0 24 Satallite town 0 0 0 0 6 6 25 0 0 0 0 0 0 26 0 16 16 0 0 0 27 Chiltan town 0 0 0 0 0 0 28 0 0 0 0 2 2 29 0 0 0 0 0 0 30 0 0 0 0 0 0 31 0 0 0 0 0 0  下载: 导出CSV
Table 2. Physiochemical parameters and microbes in TW
TW GW Mean Std. Deviation Mean Std. Deviation pH 7.89 0.24 7.37 0.20 EC (µS/cm) 718.71 314.39 580.96 132.56 Turbidity (NTU) 5.15 8.30 2.48 0.58 TDS (mg/L) 439.45 194.58 474.61 151.63 E.coli 1.10 3.49 1.64 1.53 Coliform 7.03 7.96 1.64 1.53 Total coliform 8.13 10.54 7.37 0.20
下载: 导出CSV
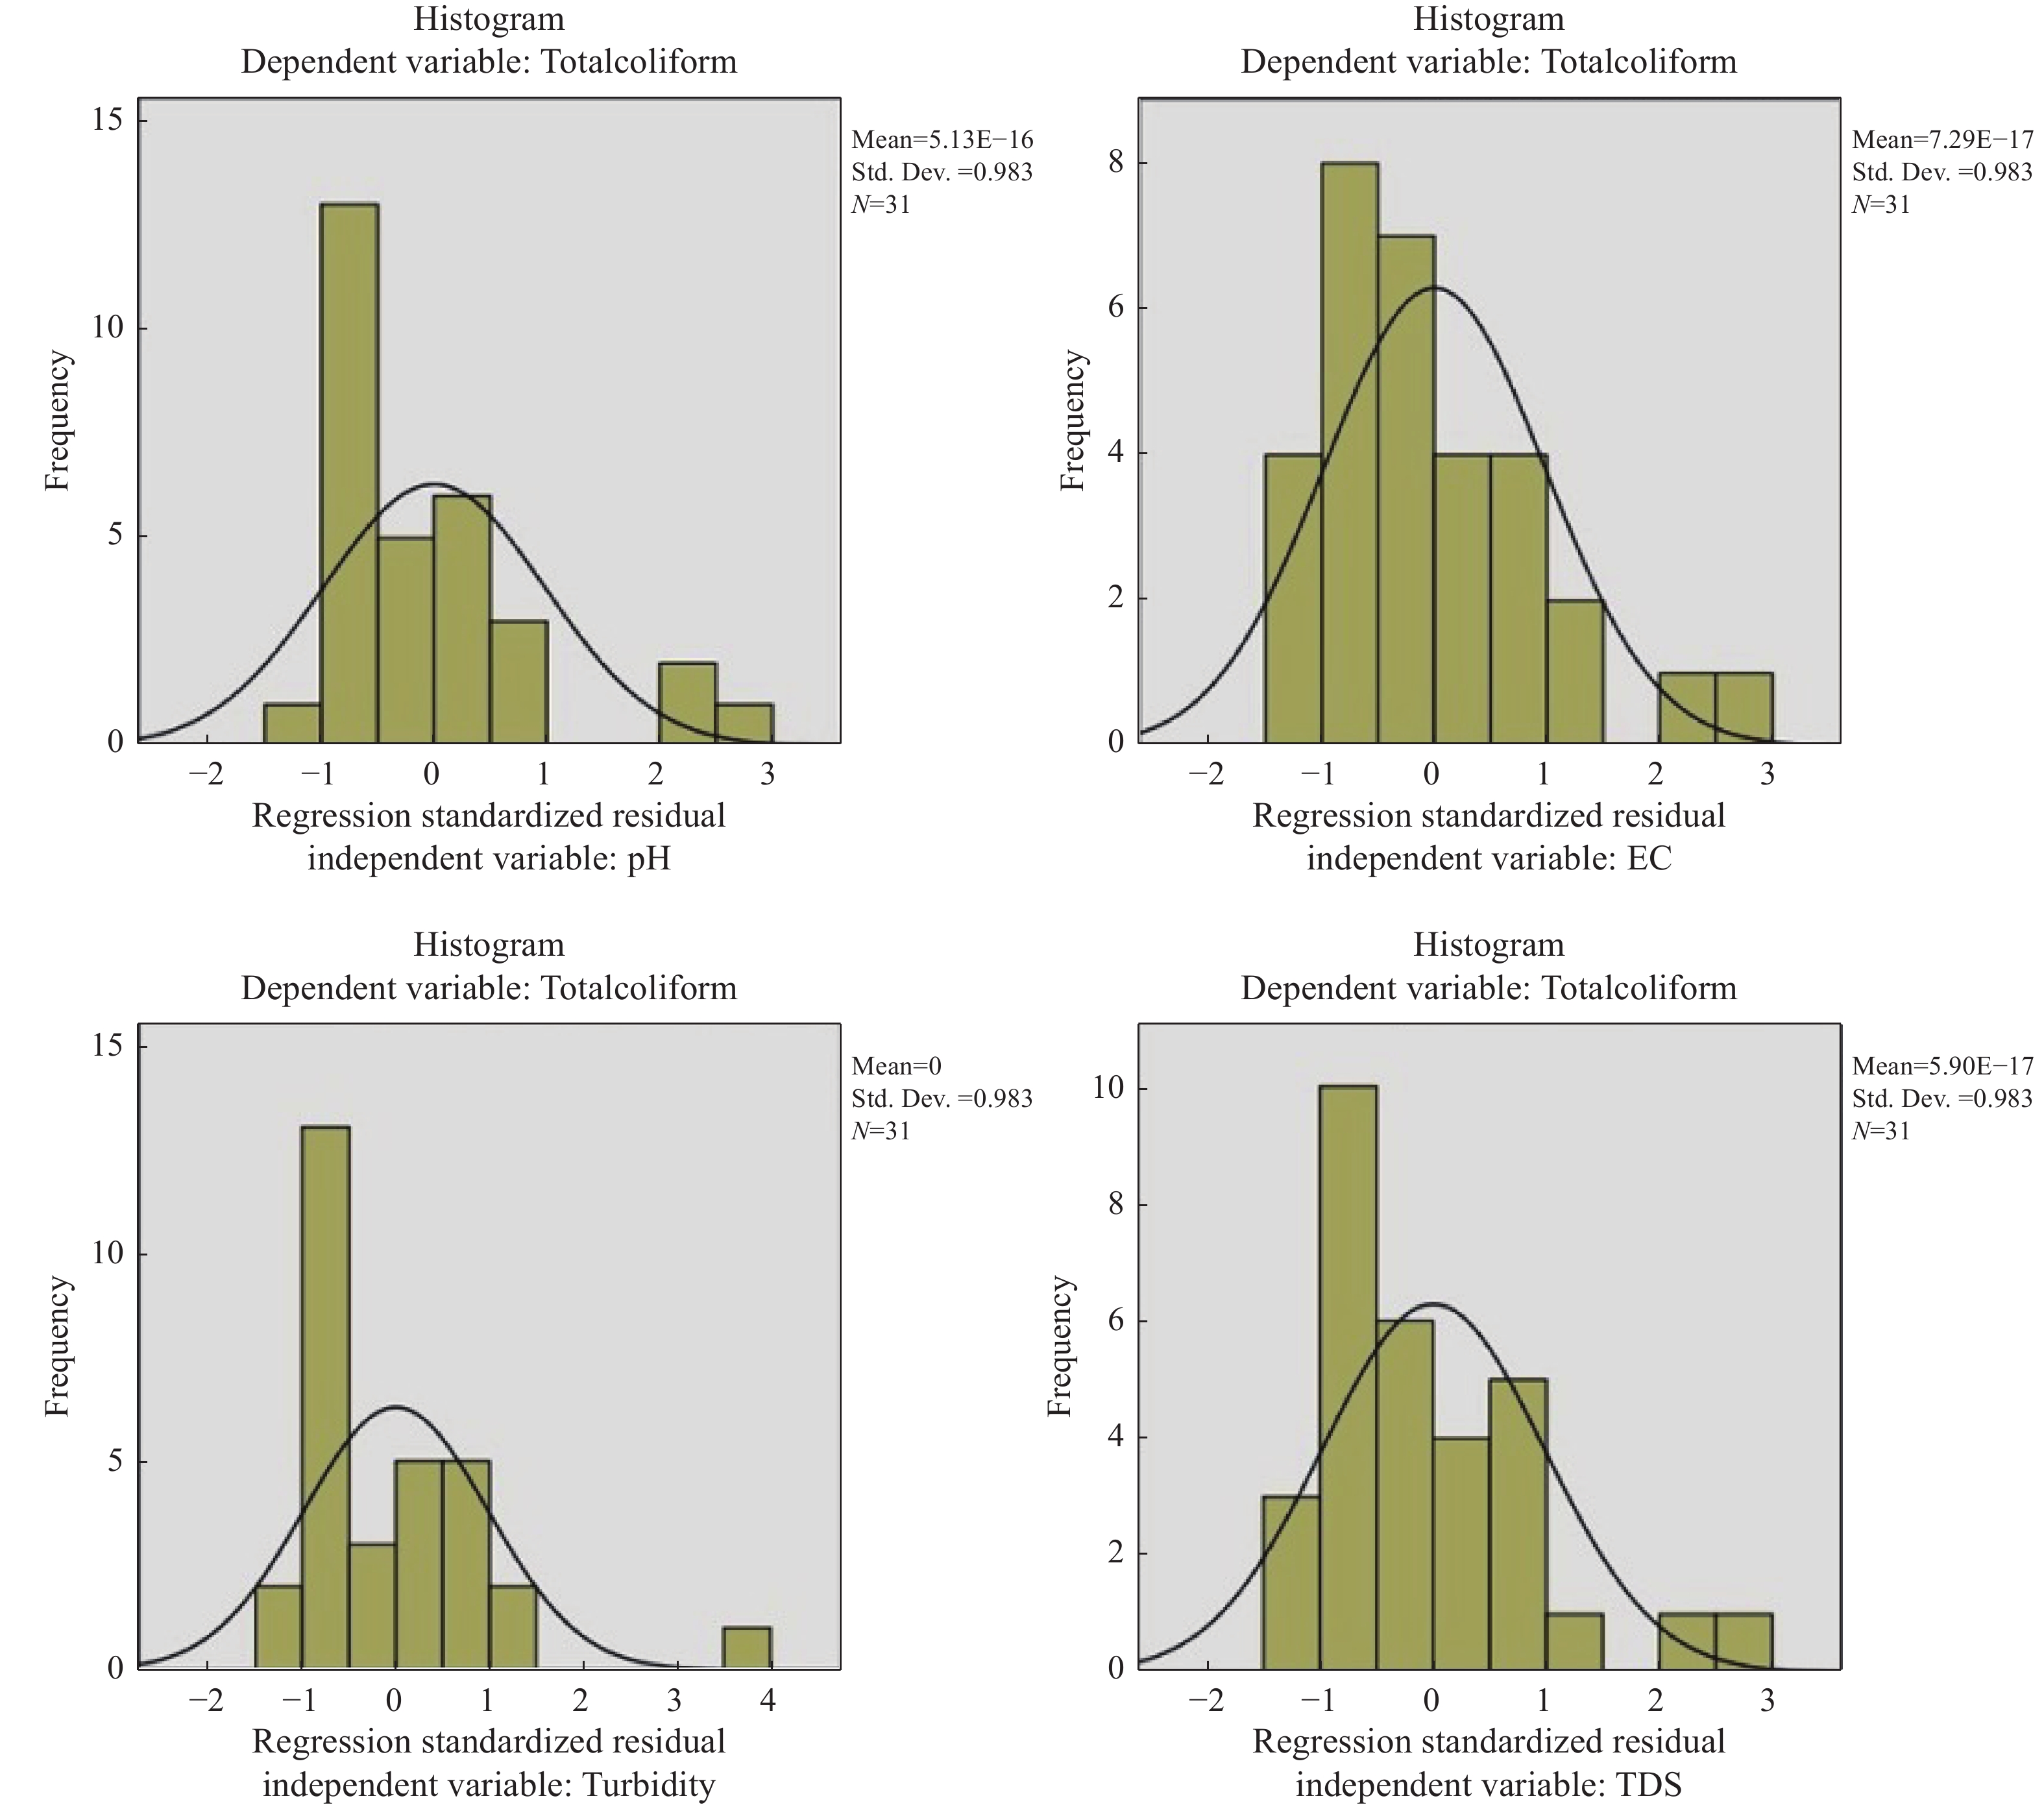
Table 3. Pearson Correlation of physiochemical parameters with Total Coliform in TW
pH EC Turbidity TDS E.coli Coliform Total coliform pH Pearson correlation 1 −0.099 −0.079 −0.102 −0.129 −0.080 −0.103 Sig. (2- tailed) 0.596 0.672 0.584 0.487 0.669 0.580 N 31 31 31 31 31 31 31 EC Pearson correlation −0.099 1 0.101 0.997** 0.438* 0.360* 0.417* Sig. (2- tailed) 0.596 0.589 0.000 0.014 0.047 0.020 N 31 31 31 31 31 31 31 Turbidity Pearson correlation −0.079 0.101 1 0.110 0.821** 0.591** 0.718** Sig. (2- tailed) 0.672 0.589 0.556 0.000 0.000 0.000 N 31 31 31 31 31 31 31 TDS Pearson correlation −0.102 0.997** 0.110 1 0.428* 0.346 0.403* Sig. (2- tailed) 0.584 0.000 0.556 0.016 0.057 0.025 N 31 31 31 31 31 31 31 E.coli Pearson correlation −0.129 0.438* 0.821** 0.428* 1 638** 0.813** Sig. (2- tailed) 0.487 0.014 0.000 0.016 0.000 0.000 N 31 31 31 31 31 31 31 Coliform Pearson correlation −0.080 0.360* 0.591** 0.346 0.638** 1 0.967** Sig. (2- tailed) 0.669 0.047 0.000 0.057 0.000 0.000 N 31 31 31 31 31 31 31 Total coliform Pearson correlation −0.103 0.417* 0.718** 0.403* 0.813** 0.967** 1 Sig. (2- tailed) 0.580 0.020 0.000 0.025 0.000 0.000 N 31 31 31 31 31 31 31 Notes: **Correlation is significant at the 0.01 level (2-tailed)
*Correlation is significant at the 0.05 level (2-tailed)
下载: 导出CSV
Table 4. Physiochemical Water Quality Analysis of TW and GW
Sr#. Name of scheme TW GW pH EC Turbidity TDS pH EC Turbidity TDS - µS/cm NTU mg/L - µS/cm NTU mg/L 6.5–8.5 - 5 1000 6.5–8.5 - 5 1000 1 Brewery Town 8.2 730 2.4 443 7.62 1178 3.1 753 2 7.8 726 1.9 442 7.68 575 2.6 666 3 8.0 787 2.1 482 7.54 685 1.8 423 4 7.82 520 2.1 309 7.32 433 3.1 565 5 Jinnah Town 7.5 1343 2.6 872 7.5 522 2.9 675 6 7.9 998 3.6 600 7.39 674 1.8 431 7 7.8 890 2 531 7.29 528 2.6 484 8 7.8 1 942 8.9 1159 7.45 573 3.5 314 9 7.99 896 2.6 574 7.32 493 2.1 566 10 Shahbaz Town 7.6 543 1.6 327 7.56 555 1.6 287 11 7.8 777 14.6 469 7.26 498 2.6 318 12 7.5 500 1.2 296 7.24 500 1.8 289 13 7.6 562 26.8 333 7.35 575 2.3 415 14 8.1 592 1.6 351 7.65 587 2.6 498 15 Quetta Main city 8.2 435 4.2 262 7.15 512 1.8 555 16 8.0 940 1.8 564 7.2 422 1.8 269 17 7.9 686 1.9 413 7.14 485 3.1 384 18 7.6 534 2.2 324 7.25 512 2.9 396 19 7.9 603 5.6 367 7.34 576 2.6 483 20 7.9 792 40.6 507 7.23 587 3.5 666 21 8.26 460 7.6 286 7.12 432 2.6 789 22 8.1 405 2.2 239 7.16 522 1.8 724 23 7.9 450 1.4 266 7.12 595 3.5 381 24 Satallite Town 8.2 1025 4.6 656 7.38 678 2.1 277 25 7.9 731 3 454 7.54 674 1.6 532 26 8.1 625 2.6 390 7.12 566 1.8 354 27 Chiltan Town 8.1 840 1.6 509 7.14 589 2.3 655 28 7.8 410 2 248 7.81 651 2.6 417 29 8.2 424 1.4 257 7.65 655 3.1 345 30 8.0 542 1.4 333 7.72 623 2.9 389 31 7.2 572 1.6 360 7.38 555 2.6 413
下载: 导出CSV
Table 5. Pearson Correlation of physiochemical parameters with total coliform in GW
pH EC turbidity TDS Coliform Total coliform pH Pearson Correlation 1 0.487** 0.094 −0.051 −0.139 −0.139 Sig. (2-tailed) 0.005 0.615 0.787 0.455 0.455 N 31 31 31 31 31 31 EC Pearson Correlation 0.487** 1 0.117 0.182 −0.135 −0.135 Sig. (2-tailed) 0.005 0.530 0.327 0.470 0.470 N 31 31 31 31 31 31 Turbidity Pearson Correlation 0.094 0.117 1 0.148 −0.241 −0.241 Sig. (2-tailed) 0.615 0.530 0.427 0.191 0.191 N 31 31 31 31 31 31 TDS Pearson Correlation −0.051 0.182 0.148 1 −0.442* −0.442* Sig. (2-tailed) 0.787 0.327 0.427 0.013 0.013 N 31 31 31 31 31 31 Coliform Pearson Correlation −0.139 −0.135 −0.241 −0.442* 1 1.000** Sig. (2-tailed) 0.455 0.470 0.191 0.013 0.000 N 31 31 31 31 31 31 Total coliform Pearson Correlation −0.139 −0.135 −0.241 −0.442* 1.000** 1 Sig. (2-tailed) 0.455 0.470 0.191 0.013 0.000 N 31 31 31 31 31 31 Notes: **. Correlation is significant at the 0.01 level (2-tailed).
*. Correlation is significant at the 0.05 level (2-tailed).
下载: 导出CSV
-
Aftab SM, Siddiqui RH, Farooqui MA. 2018. Strategies to manage aquifer recharge in Balochistan, Pakistan: An overview. In IOP Conference Series: Materials Science and Engineering, 414(1): 012023. IOP Publishing. Ahmed J, Wong LP, Chua YP, et al. 2020. Quantitative microbial risk assessment of drinking water quality to predict the risk of waterborne diseases in primary-school children. International Journal of Environmental Research and Public Health, 17(8): 2774. doi: 10.3390/ijerph17082774 Akhtar MM, Mohammad AD, Ehsan M, Akhtar R, ur Rehman J, Manzoor Z. 2021. Water resources of Balochistan, Pakistan — A review. Arabian Journal of Geosciences, 14(4): 1-6. doi: 10.1007/s12517-021-06940-8 Alam K. 2010. Evaluation of aquifer system in Quetta valley through geophysical methods and groundwater flow modeling. Ph.D thesis, University of the Punjab, Lahore-Pakistan. Alam K, Ahmad N. 2014. Determination of aquifer geometry through geophysical methods: A case study from Quetta Valley, Pakistan. Acta Geophysica, 62(1): 142-163. doi: 10.2478/s11600-013-0171-8 Azizullah A, Khattak MNK, Richter P, et al. 2011. Water pollution in Pakistan and its impact on public health — A review. Environment International, 37(2): 479-497. doi: 10.1016/j.envint.2010.10.007 Craun GF, Calderon RL. 2006. Workshop summary: Estimating waterborne disease risks in the United States. Journal of Water and Health, 4(S2): 241-253. doi: 10.2166/wh.2006.025 Daud MK, Nafees M, Ali S, et al. 2017. Drinking water quality status and contamination in Pakistan. Biomed Research International, 2017: 7908183. Dawood F, Akhtar MM, Ehsan M. 2021. Evaluating urbanization impact on stressed aquifer of Quetta Valley, Pakistan. Desalination and Water Treatment, 222: 103-113. Din M, Ahmad Z, Aleem A. et al. 2014. Pathogens from drinking water; Isolation and antibiogram of pathogenic organisms from drinking water in Quetta city. Professional Medical Journal, 21(4): 760-765. Durrani IH, Adnan S, Ahmad M. et al. 2018. Observed long-term climatic variability and its impacts on the ground water level of Quetta alluvial. Iranian Journal of Science and Technology, Transactions A: Science, 42(2): 589-600. Ferrer N, Folch A, Masó G, et al. 2020. What are the main factors influencing the presence of faecal bacteria pollution in groundwater systems in developing countries. Journal of Contaminant Hydrology, 228: 103556. doi: 10.1016/j.jconhyd.2019.103556 Ghani A, Chaudary ZA, Rehman H, et al. 2019. Assessment of sustainable groundwater extraction rate for Quetta city using MODFLOW. Pakistan Journal of Engineering and Applied Sciences, 24. Corpus ID: 135115506. Ilyas SZ, Khattak AI, Nasir SM, et al. 2010. Air pollution assessment in urban areas and its impact on human health in the city of Quetta, Pakistan. Clean Technologies and Environmental Policy, 12(3): 291-299. doi: 10.1007/s10098-009-0209-4 Jang WS, Engel B, Harbor J, et al. 2017. Aquifer vulnerability assessment for sustainable groundwater management using DRASTIC. Water, 9(10): 792. doi: 10.3390/w9100792 Kamran HW, Omran A. 2020. Water contamination and health hazards in Pakistan: An overview of the current scenario and contemporary challenges. Sustaining our Environment for Better Future: 75-84. doi: 10.1007/978-981-13-7158-5 Khan M, Abro SH, Taj MK, et al. 2016. Bacterial contamination of drinking water used at dairy farms in Quetta, Balochistan. Pure and Applied Biology, 5(4): 1. doi: 10.19045/bspab.2016.50089 Knappett PS, mckay LD, Layton A, et al. 2012. Unsealed tubewells lead to increased fecal contamination of drinking water. Journal of Water and Health, 10(4): 565-578. doi: 10.2166/wh.2012.102 Liu K, Luo X, Jiao JJ, et al. 2021. Gene abundances of AOA, AOB, and anammox controlled by groundwater chemistry of the Pearl River Delta, China. China Geology, 4: 463-475. doi: 10.31035/cg2021054 Muhammad AM, Zhonghua T, Sissou Z, et al. 2016. Analysis of geological structure and anthropological factors affecting arsenic distribution in the Lahore aquifer, Pakistan. Hydrogeology Journal, 24(7): 1891-1904. doi: 10.1007/s10040-016-1453-4 Ngwenya N, Ncube E J, Parsons J. 2013. Recent advances in drinking water disinfection: Successes and challenges. Reviews of Environmental Contamination and Toxicology: 111-170. doi: 10.1007/978-1-4614-4717-7_4 Oyelakin JF, Ahmad SM, Aiyelokun OO, et al. 2020. Water quality assessment of groundwater in selected potable water sources for household use in Ibadan, Southwest, Nigeria. International Journal of Energy and Water Resources: 1-8. doi: 10.1007/s42108-020-00090-5 Pandey PK, Kass PH, Soupir ML, et al. 2014. Contamination of water resources by pathogenic bacteria. Amb Express, 4(1): 1-16. doi: 10.1186/s13568-014-0051-x PSO Pakistan Buraue of Statistics. 2020. District at a glance Quetta, in 2020, May 11. WHO. 1993. World Health Organization. Guidelines for drinking-water quality. 1: Recommendations, second Edition. World Health Organization. WHO. 2008. Guidelines for Drinking water Quality, incorporating the first and second addenda: Third edition, 1: Recommendations. -


 点击查看大图

图(8) / 表ll (5)
计量
- 文章访问数: 755
- HTML全文浏览量: 288
- PDF下载量: 56
- 被引次数: 0


