 E-mail alert
 Rss
Rss

Analysis on the situation and countermeasures of water resources supply and demand in the cities of small and medium-sized river basins along southeast coast of China — taking Xiamen City as an example
-
Abstract: The small and medium-sized river basins along southeast coast of China hold comparatively abundant water resources. However, the rapid resources urbanization in recent years has produced a series of water problems such as deterioration of river water quality, water shortage and exacerbated floods, which have constrained urban economic development. By applying the principle of triple supply-demand equilibrium, this paper focuses on the estimation of levels of water supply and demand in 2030 at different guarantee probabilities, with a case study of Xiamen city. The results show that water shortage and inefficient utilization are main problems in the city, as the future water supply looks daunting, and a water shortage may hit nearly 2 × 10⁸ m3 in an extraordinarily dry year. Based on current water supply-demand gap and its trend, this paper proposes countermeasures and suggestions for developing and utilizing groundwater resources and improving the utilization rate of water resources, which can supply as a reference for other southeast middle-to-small-sized basin cities in terms of sustainable water resources and water environment protection.
-
Key words:
- Xiamen City /
- Water resources /
- Triple equilibrium /
- Probability /
- Supply and demand forecast
-
Table 1. Population, GDP, water resource distribution of Xiamen in 2018
Siming district Huli district Haicang district Jimei district Tongan district Xiangan district Total Population (10 thousand people) 101.5 103.1 37.5 70.0 61.1 37.8 411 GDP (¥100 million) 1 449.93 1 035.84 676.11 686.22 422.65 520.6 4 791.35 Water resources quantity(108 m3) 0.32 0.27 0.687 1.031 5.222 1.892 9.422  下载: 导出CSV
Table 2. Available water resources in 2030 at different guarantee rates (108 m3)
Administrative district Local surface water Water from Jiulong River Groundwater Other Total water supply 50% 75% 95% 50% 75% 95% 50% 75% 95% Siming 0.09 0.08 0.07 0.90 0.73 0.4 0 0.02 1.01 0.83 0.49 Huli 0.08 0.07 0.06 0.90 0.73 0.4 0 0.01 0.99 0.81 0.47 Haicang 0.30 0.23 0.22 1.57 1.27 0.70 0.05 0.01 1.93 1.56 0.98 Jimei 0.48 0.43 0.34 0.98 0.80 0.44 0.04 0.01 1.51 1.28 0.83 Tongan 1.75 1.54 1.24 0.19 0.16 0.09 0.24 0.01 2.19 1.95 1.58 Xiangan 0.50 0.45 0.35 0.77 0.63 0.34 0.16 0.01 1.44 1.25 0.86 Total 3.19 2.80 2.28 5.32 4.32 2.36 0.49 0.07 9.07 7.68 5.20
下载: 导出CSV
Table 3. Estimated total water demand in Xiamen, 2030 (108 m3)
Administrative
districtResidential Industrial Agricultural Total 50% 75% 95% Ecological 50% 75% 95% Siming 0.81 0.14 0.15 0.15 0.15 0.05 1.15 1.15 1.15 Huli 0.84 0.86 0 0 0 0.04 1.74 1.74 1.74 Haicang 0.38 0.62 1.11 1.11 1.12 0.03 2.14 2.14 2.15 Jimei 0.63 0.51 0.32 0.33 0.34 0.03 1.49 1.5 1.51 Tongan 0.57 0.52 0.5 0.55 0.62 0.02 1.61 1.66 1.73 Xiangan 0.36 0.98 0.63 0.66 0.7 0.02 1.99 2.02 2.06 Total 3.59 3.63 2.71 2.81 2.92 0.18 10.11 10.21 10.32
下载: 导出CSV
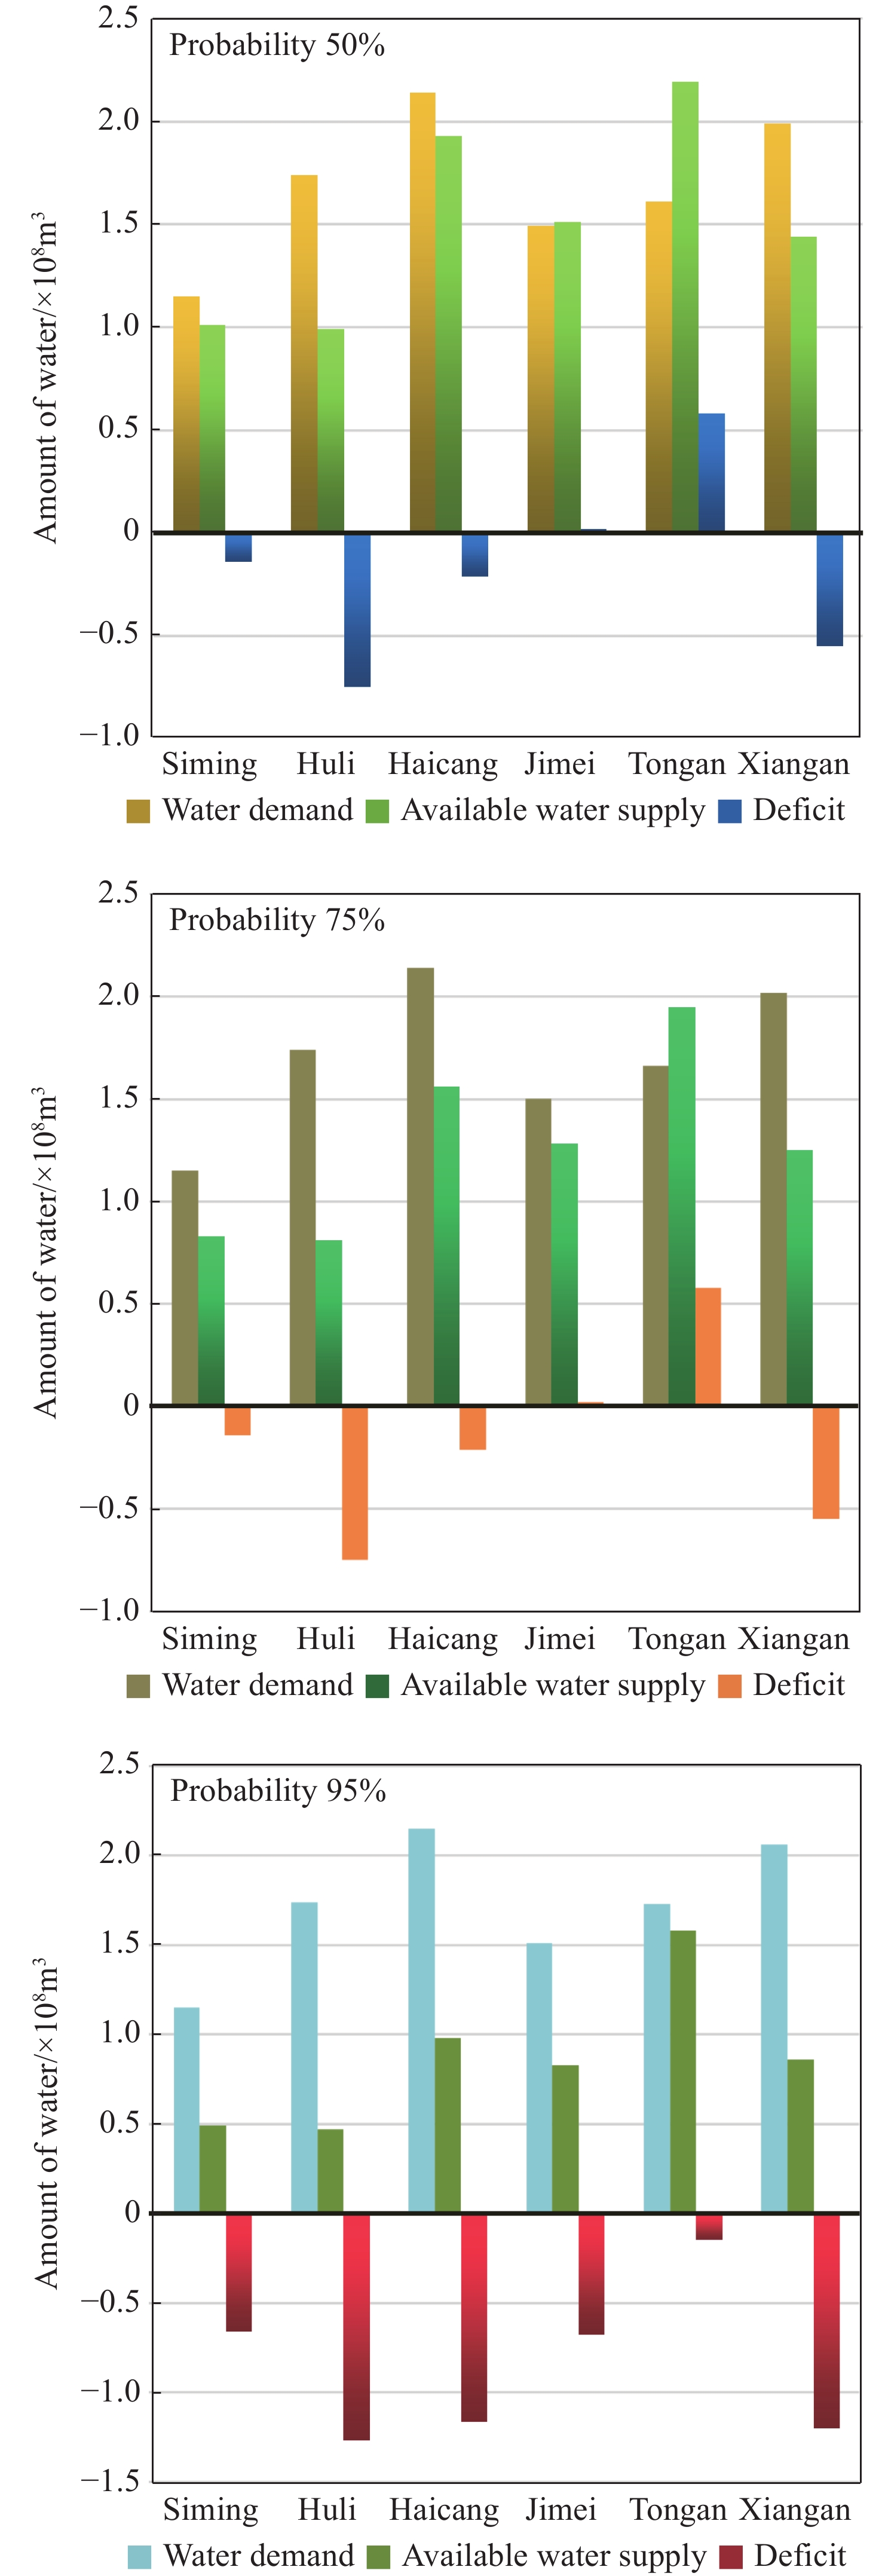
Table 4. Predicted water demand and supply (First equilibrium) (108 m3)
Administrative district Water demand① Water available② Surplus③=②-① Water deficiency ratio 50% 75% 95% 50% 75% 95% 50% 75% 95% 50% 75% 95% Xiamen City 10.11 10.21 10.32 9.07 7.68 5.20 −1.04 −2.53 −5.12 10.29 24.78 49.61
下载: 导出CSV
Table 5. Water demand in 2030 by the second budget analysis (108 m3)
Administrative district Residential Industrial Agricultural Ecological Total 50% 75% 95% 50% 75% 95% Siming 0.72 0.1 0.11 0.11 0.11 0.05 0.98 0.98 0.98 Huli 0.74 0.6 0 0 0 0.04 1.38 1.38 1.38 Haili 0.32 0.44 0.84 0.84 0.84 0.03 1.63 1.63 1.63 Jimei 0.54 0.36 0.25 0.26 0.27 0.03 1.18 1.19 1.2 Tongan 0.47 0.37 0.41 0.45 0.51 0.02 1.27 1.31 1.37 Xiangan 0.29 0.7 0.5 0.53 0.56 0.02 1.51 1.54 1.57 Total 3.08 2.58 2.1 2.19 2.29 0.18 7.94 8.03 8.13
下载: 导出CSV
Table 6. Water resource demand and supply in 2030 (Second equilibrium) (108 m3)
Administrative
districtWater demand① Water available② Surplus③=②-① Water deficiency ratio 50% 75% 95% 50% 75% 95% 50% 75% 95% 50% 75% 95% Xiamen City 7.94 8.03 8.13 9.07 7.68 5.20 1.13 −0.35 −2.93 −14.23 4.36 36.04
下载: 导出CSV
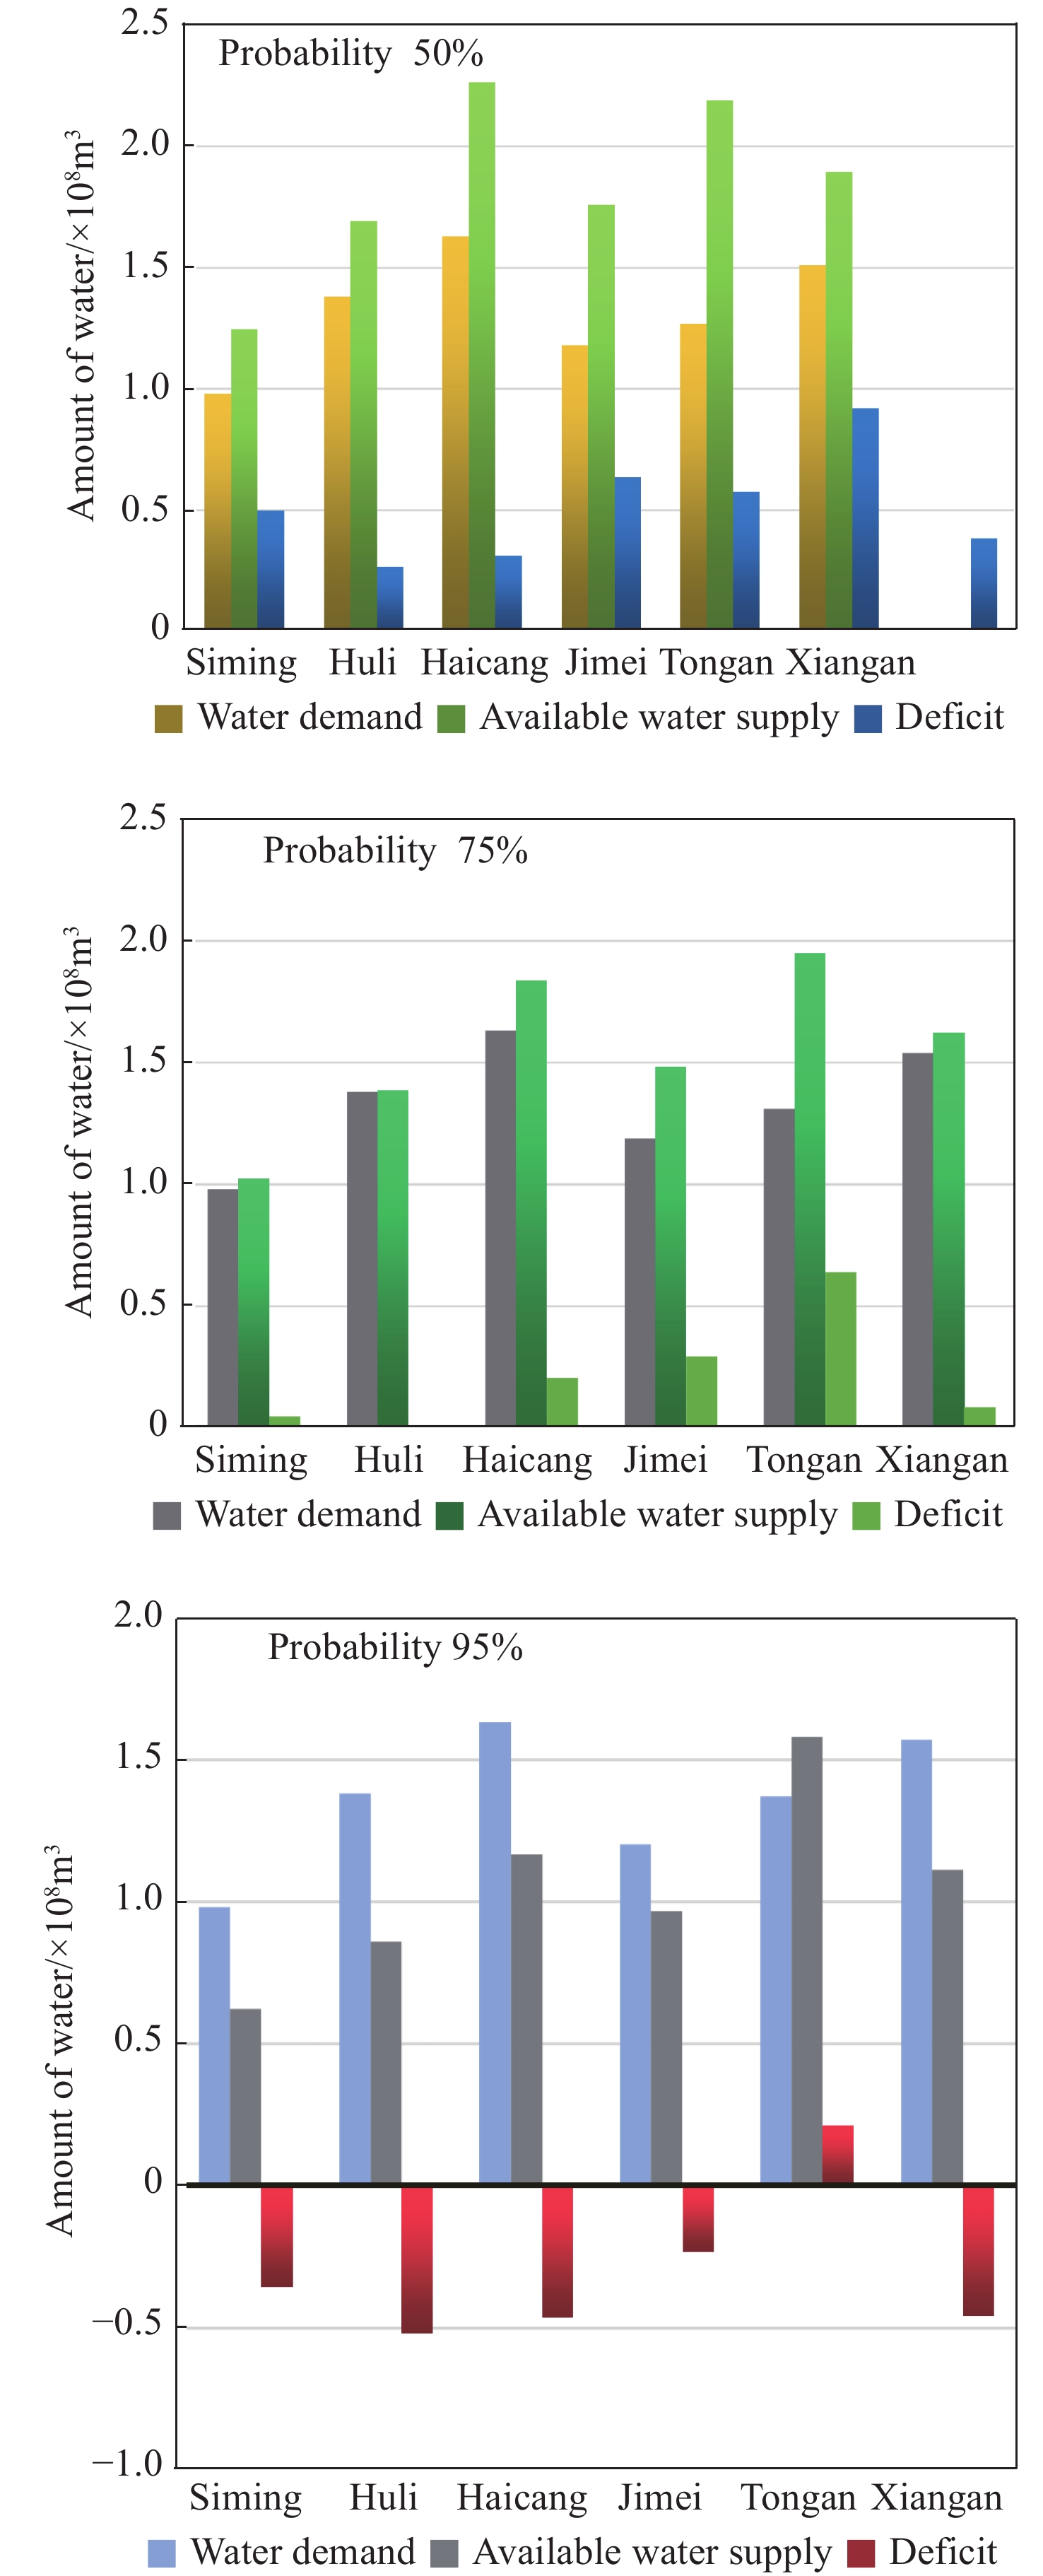
Table 7. Water resource demand and supply in 2030 (Third equilibrium) (108 m3)
Administrative
districtWater demand① Water available② Surplus③=②-① Water deficiency ratio% 50% 75% 95% 50% 75% 95% 50% 75% 95% 50% 75% 95% Siming 0.98 0.98 0.98 1.25 1.03 0.62 0.27 0.05 −0.36 −27.32 −4.60 36.61 Huli 1.38 1.38 1.38 1.69 1.39 0.86 0.31 0.01 −0.52 −22.70 −0.51 37.82 Haicang 1.63 1.63 1.63 2.27 1.84 1.17 0.64 0.21 −0.46 −39.07 −12.66 28.47 Jimei 1.18 1.19 1.2 1.76 1.48 0.97 0.58 0.29 −0.23 −48.95 −24.64 19.44 Tongan 1.27 1.31 1.37 2.19 1.95 1.58 0.92 0.64 0.21 −72.44 −48.85 −15.33 Xiangan 1.51 1.54 1.57 1.90 1.62 1.11 0.39 0.08 −0.46 −25.54 −5.44 29.21 Total 7.94 8.03 8.13 11.05 9.31 6.30 3.11 1.28 −1.83 −39.18 −15.88 22.51
下载: 导出CSV
-
Cheng XR, Ren LL, Yang XL, et al. 2015. Comparison of supply-demand planning schemes of water resources over Sanya River Basin. Water Resources Protection, 31(6): 5-10 (in Chinese). Diao WJ, Feng ZL, Liu XC, et al. 2017. Optimal Allocation of Water Resource in North of Weifang Based on Visual MODFLOW. Water Resources and Power, 35(4): 25-28. (in Chinese) Dong ZC. 2008. Water Resources Planning and Management. China Water & Power Press: Beijing. (in Chinese) Hao GL, Wang X, Luo Y, et al. 2017. Assessment of water shortage risk in Beijing based on improved comprehensive evaluation model. Water Resources Protection, 33(6): 27-31. ( in Chinese) Huang CL, Zheng CH. 2009. Spatial differentiation of water resources supply and demand balance in Fujian Province. Resources Science, 31(5): 750-756. (in Chinese) Kang AQ, Wei CJ, Xie XM, et al. 2011. Research and application on triple equilibrium law under the framework of water resources entire elements option allocation. Journal of China Institute of Water Resources and Hydropower Research, 9(3): 161-167. ( in Chinese) Lin PF, You JJ, Wang L, et al. 2016. Study on evaluation of effect from water-source connection on safety of urban water supply system. Water Resources and Hydropower Engineering, 47(01): 26-30, 40. ( in Chinese) Liu JX, Yuan WL, Kang AQ. 2011. Example analysis of the impact of typical and long series year calculation methods on water allocation results. Heilongjiang Science and Technology of Water Conservancy, 39(01): 159-160, 170. (in Chinese) Margaret WG, Li CC, Mohamed Sayeed, et al. 2011. Watershed modeling using large-scale distributed computing in condor and the soil and water assessment tool model. Simulation Transactions of the Society for Modeling & Simulation International, 88(3): 365-380. doi: 10.1177/0037549711402524 Qian ZY. 2001. Study on China’s water resources strategy for sustainable development. China Water & Power Press. (in Chinese) Read L, Madani K, Inanloo B. 2014. Optimality versus stability in water resource allocation. Journal of Environmental Management, 133: 343-354. doi: 10.1016/j.jenvman.2013.11.045 Shi H. 2002. The state of global water resource and the problems of water environment in China. Research of Soil and Water Conservation, 9(1): 145-150. (in Chinese) Wang H, Qin DY, Wang JH, et al. 2003. Study on the rational allocation of water resources in the Yellow Huaihai Basin. Science Press: Beijing. (in Chinese) Xie JY, Chen X, Xu Q. 2020. Impact of urbanization on water resources vulnerability in Amoy City. International Journal Hydroelectric Energy, 28(6): 19-21, 59. ( in Chinese) Xu XQ. 1999. Desalination of seawater is most effective way to solve water shortage in Amoy. Journal of Oceanography in Taiwan Strait, 18(4): 450-455. (in Chinese) -


 点击查看大图

计量
- 文章访问数: 588
- HTML全文浏览量: 200
- PDF下载量: 40
- 被引次数: 0


