Spatial-temporal difference between nitrate in groundwater and nitrogen in soil based on geostatistical analysis
-
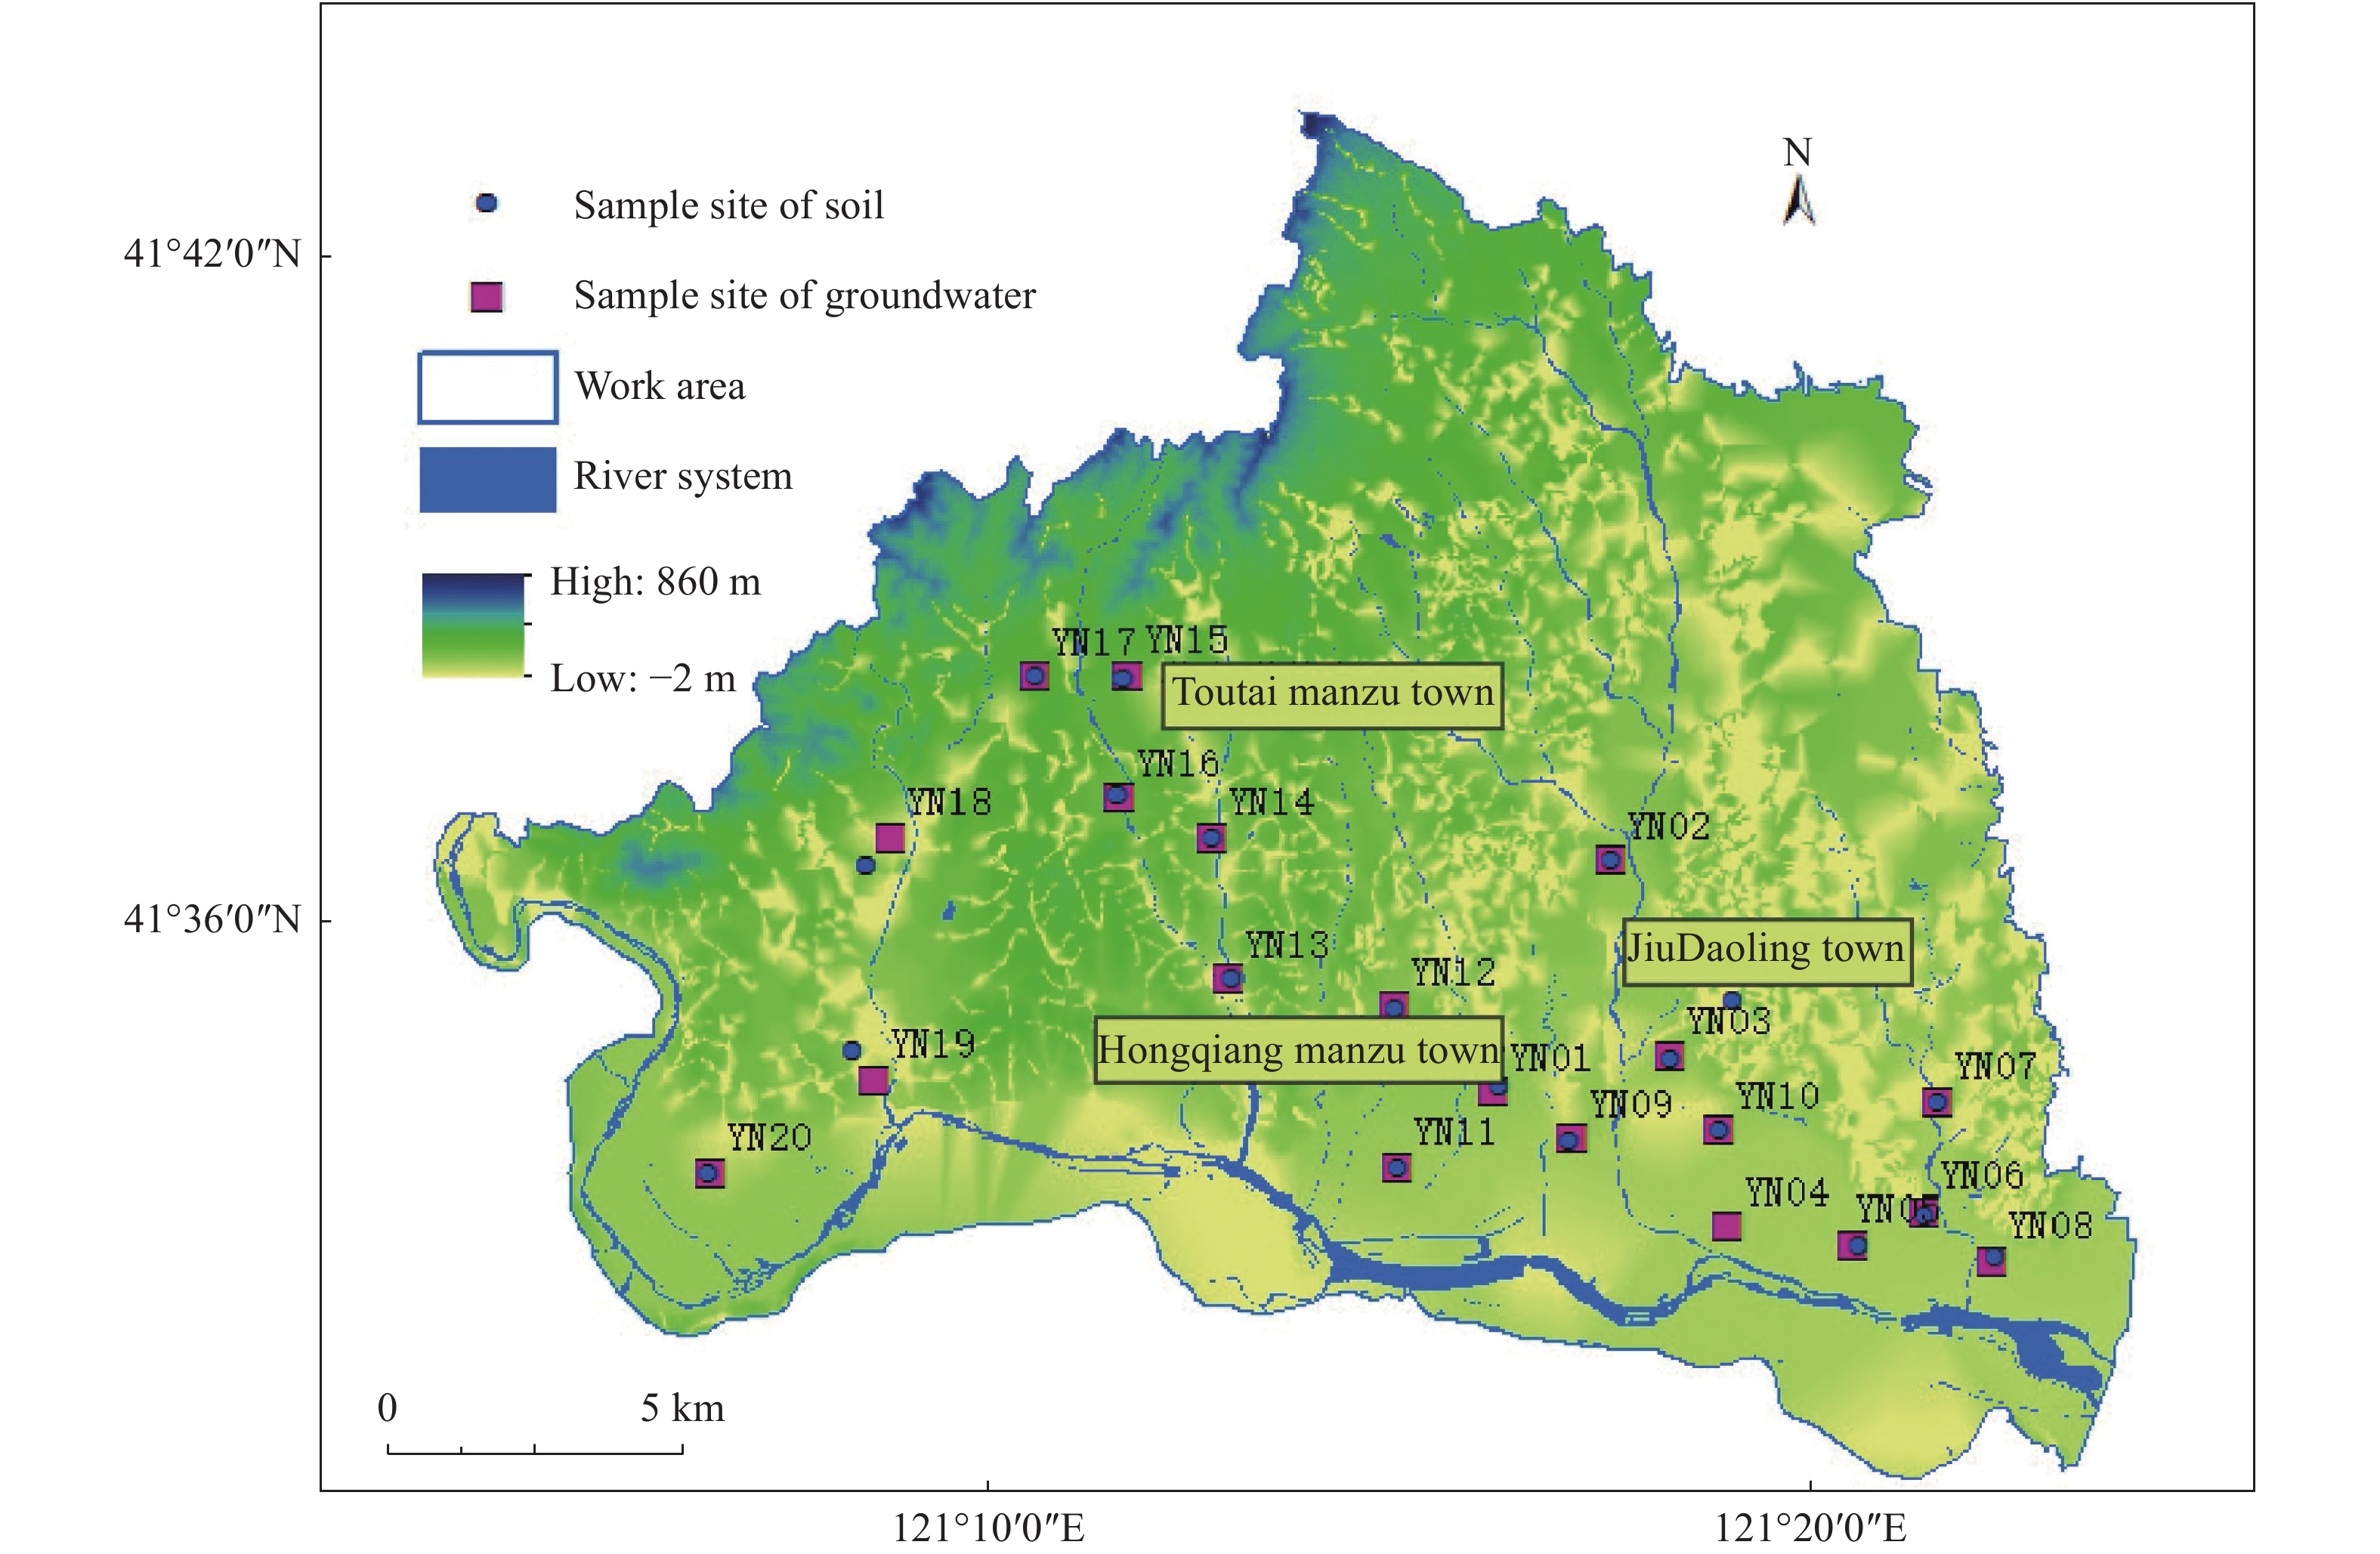
Abstract: The study of temporal and spatial variations of nitrate in groundwater under different soil nitrogen environments is helpful to the security of groundwater resources in agricultural areas. In this paper, based on 320 groups of soil and groundwater samples collected at the same time, geostatistical analysis and multiple regression analysis were comprehensively used to conduct the evaluation of nitrogen contents in both groundwater and soil. From May to August, as the nitrification of groundwater is dominant, the average concentration of nitrate nitrogen is 34.80 mg/L; The variation of soil ammonia nitrogen and nitrate nitrogen is moderate from May to July, and the variation coefficient decreased sharply and then increased in August. There is a high correlation between the nitrate nitrogen in groundwater and soil in July, and there is a high correlation between the nitrate nitrogen in groundwater and ammonium nitrogen in soil in August and nitrate nitrogen in soil in July. From May to August, the area of low groundwater nitrate nitrogen in 0–5 mg/L and 5–10 mg/L decreased from 10.97% to 0, and the proportion of high-value area (greater than 70 mg/L) increased from 21.19% to 27.29%. Nitrate nitrogen is the main factor affecting the quality of groundwater. The correlation analysis of nitrate nitrogen in groundwater, nitrate nitrogen in soil and ammonium nitrogen shows that they have a certain period of delay. The areas with high concentration of nitrate in groundwater are mainly concentrated in the western part of the study area, which has a high consistency with the high value areas of soil nitrate distribution from July to August, and a high difference with the spatial position of soil ammonia nitrogen distribution in August.
-
Key words:
- Groundwater /
- Nitrate /
- Soil /
- Spatial-temporal variation /
- Geostatistical analysis
-
Table 1. Evaluation of nitrate in groundwater
Index item Sample number Class Ⅲ standard value (mg/L) Exceeding standard points Exceeding standard rate (%) Maximum concentration
(mg/L)May nitrate (calculated as nitrogen) 20 20 13 65.00 87.97 June nitrate (calculated as nitrogen) 20 20 13 65.00 96.46 July nitrate (calculated as nitrogen) 20 20 12 60.00 75.63 August nitrate (calculated as nitrogen) 20 20 13 65.00 96.59 (May-August) Nitrate (calculated as nitrogen) 80 20 51 63.75 96.59 Table 2. Statistics of groundwater nitrate parameters (mg/L)
Project Stage Average value Standard deviation Minimum value Maximum value Coefficient of variation (%) Nitrate in groundwater May 35.98 25.11 0.61 87.97 69.80 Nitrate in groundwater June 33.72 28.32 4.68 96.46 83.98 Nitrate in groundwater July 30.73 20.50 5.74 75.63 66.71 Nitrate in groundwater August 38.76 27.01 10.15 96.59 69.70 Table 3. Statistics of soil nitrogen parameter characteristics (mg/L)
Project Stage Average value Standard deviation Minimum value Maximum value Coefficient of variation (%) Ammonium nitrogen (0–20 cm) May 17.16 17.26 3.26 76.95 100.57 June 19.12 19.12 2.99 74.36 100.01 July 14.57 29.70 1.23 133.04 203.81 August 0.74 0.23 0.33 1.34 31.03 Nitrate nitrogen (0–20 cm) May 3.33 0.78 2.43 6.16 23.46 June 1.64 0.36 1.13 2.34 22.01 July 0.57 0.70 0.20 3.36 123.72 August 4.04 3.74 0.60 17.21 92.68 Ammonium nitrogen (20–40 cm) May 19.96 43.76 2.20 190.04 219.26 June 18.31 34.62 2.25 156.32 189.12 July 24.07 29.05 0.70 107.54 120.69 August 0.55 0.18 0.30 0.95 32.14 Nitrate nitrogen (20–40 cm) May 3.15 0.55 2.41 4.72 17.60 June 1.46 0.28 1.12 2.22 19.30 July 0.41 0.17 0.22 0.87 41.45 August 7.85 18.60 0.59 86.11 236.91 Ammonium nitrogen (40–60 cm) May 16.09 32.01 1.06 130.70 198.91 June 13.58 18.41 2.01 78.82 135.54 July 18.31 22.90 0.78 93.85 125.11 August 0.61 0.25 0.29 1.12 40.79 Nitrate nitrogen (40–60 cm) May 3.35 0.77 2.51 5.35 22.91 June 1.38 0.50 0.33 3.11 36.22 July 0.42 0.12 0.21 0.70 27.61 August 7.64 11.78 0.77 53.02 154.23 Table 4. NO3− correlation analysis with groundwater chemical factors
Correlation coefficient NO3− Ca2+ Mg2+ Cl− TDS Permanent hardness NO2− NH4+ NO3− 1.00 0.85 0.72 0.73 0.89 0.94 0.05 −0.01 Ca2+ 0.85 1.00 0.56 0.88 0.94 0.94 0.06 0.04 Mg2+ 0.72 0.56 1.00 0.48 0.74 0.73 0.11 0.01 Cl− 0.73 0.88 0.48 1.00 0.84 0.84 0.08 0.04 TDS 0.89 0.94 0.74 0.84 1.00 0.96 0.09 0.04 Permanent hardness 0.94 0.94 0.73 0.84 0.96 1.00 0.07 0.03 NO2− 0.05 0.06 0.11 0.08 0.09 0.07 1.00 0.89 NH4+ −0.01 0.04 0.01 0.04 0.04 0.03 0.89 1.00 Table 5. Correlation analysis of nitrate nitrogen in groundwater and soil
Nitrate nitrogen in groundwater Soil nitrogen Optimal model Coefficient of goodness of fit (R2) Significance Significant degree July nitrate nitrogen July nitrate nitrogen three times 0.669 0.008 More relevant August nitrate nitrogen July nitrate nitrogen three times 0.666 0.003 More relevant August nitrate nitrogen August ammonia nitrogen compound 0.793 0 More relevant Table 6. Correlation analysis of nitrate in groundwater and soil
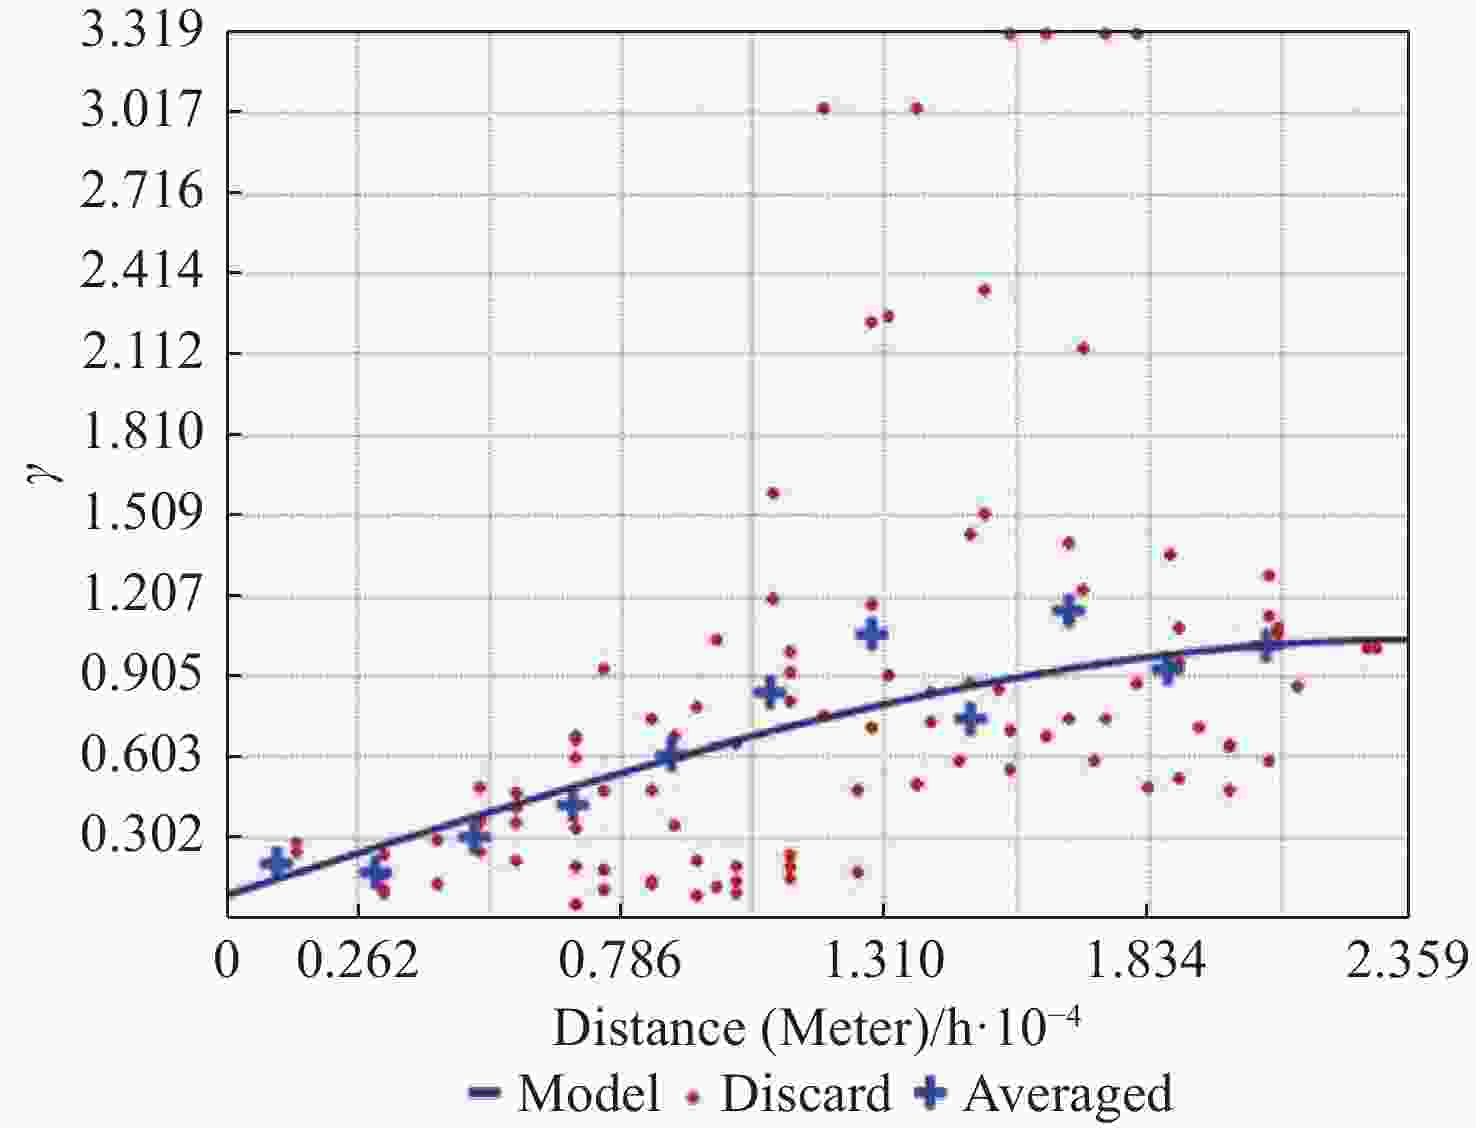
Project Stage Sample raw data Converted data Model name Gold value (C0) Base value (C0+C) Nugget Coefficient (C0/C0+C) Variable a/m skewness kurtosis skewness kurtosis Nitrate nitrogen in groundwater May 0.423 2 2.116 9 0.4232 2.116 9 Stable function 66.3286 1444.1306 0.0459 23 586 June 1.030 6 3.794 4 −0.5812 2.845 6 Index function 0.0543 0.953 0 0.0570 23 586 July 0.658 1 2.454 9 −0.3688 2.154 8 Sphere function 0.0837 1.044 2 0.0802 21 136 August 0.800 6 2.392 9 0.092 0 1.736 1 Index function 0.0873 1.162 2 0.0751 23 586 Soil nitrate nitrogen May 0.956 0 3.714 7 0.605 4 3.163 0 Sphere function 0.0179 0.018 0 0.9944 23 625 June 1.155 3 4.439 9 0.575 9 3.742 4 Index function 0.0308 0.030 9 0.9968 23 625 July 2.858 6 11.3000 1.434 2 5.324 5 Sphere function 0.0055 0.053 3 0.1032 6 199 August 3.549 7 14.9750 0.521 5 3.684 5 Index function 0.9192 0.919 3 0.9999 23 625 Soil ammonium nitrogen May 3.062 1 11.5330 1.009 9 3.906 2 Index function 1.0533 1.053 4 0.9999 23 625 June 2.733 4 10.0600 0.946 1 3.471 5 Index function 0.7896 0.790 6 0.9987 23 625 July 2.022 7 6.313 4 −0.2278 2.338 5 Index function 1.0712 1.865 8 0.5741 16 997 August 0.285 5 2.212 9 0.285 5 2.212 9 Exponential function 0.0607 0.357 4 0.1698 23 625 -
Abdelhakim L, Abdellah EH, Karima B. 2020. Spatial and statistical assessment of nitrate contamination in groundwater: Case of Sais Basin, Morocco. Journal of Groundwater Science and Engineering, 8(02): 143−157. DOI: 10.19637/j.cnki.2305-7068.2020.02.006. Cui JS, Liu SF, Gao YK, et al. 2022. Assessment of groundwater nitrate content under land use changes in Zhanjiang City. Environmental Chemistry, 41(7): 1−12. (in Chinese) DOI: 10.7524/j.issn.0254-6108.2021071101. Dai MX, Shi RG, Zhao YJ, et al. 2007. Spatial variability of soil cadmium in Huxian agricultural area, Sichuan Province. Journal of Agro-Environment Science, (3): 1093−1099. (in Chinese) DOI: 10.3321/j.issn:1672-2043.2007.03.058. Han YP, Chai Y, Liu ZP, et al. 2018. Temporal and spatial distribution characteristics of nitrogen content in the groundwater of People’s Victory Canal irrigation district. Journal of North China University of Water Resources and Electric Power (Natural Science Edition), 39(01): 25−30, 96. (in Chinese) DOI: 10.3969/j.issn.1002-5634.2018. Huang S. 2019. GIS-based simulation and analysis of peak nitrate lag time in global vadose zone. Jilin University: 2019.000294. (in Chinese) DOI: 10.27162/d.cnki.gjlin. Li JY, Li Y, Huang ZG, et al. 2022. Fertilization in intensive sugarcane planting areas significantly increased riverine nitrate pollution: Evidenced by nitrogen and oxygen isotopes in a watershed. Journal of Plant Nutrition and Fertilizers, 28(1): 104−113. (in Chinese) DOI: 10.11674/zwyf.2021513. Li Y, Kang FX, Zou AD. 2019. Isotope analysis of nitrate pollution sources in groundwater of Dong’e geohydrological unit. Journal of Groundwater Science and Engineering, (02): 145−154. DOI: 10.19637/j.cnki.2305-7068.2019.02.005. Liu MH, Luo SQ, Du XSH. 2021. Exploring equity in healthcare services: Spatial accessibility changes during subway expansion. ISPRS. Geo-Inf, 10: 439. DOI: 10.3390/ijgi10070439. Ma BQ, Wang X, Tang C. 2021. Application of various environmental tracers in identifying nitrate sources of groundwater. Environmental Science and Technology, 34(06): 37−40, 44. (in Chinese) DOI: 10.19824/j.cnki.cn32-1786/x.2021.0084. Ma CY, Wang JL, CHEN Z, et al. 2019. Spatial distribution of soil moisture estimated using thermal vegetation drought indices. Journal of Irrigation & Drainage, 38(3): 28−34. (in Chinese) DOI: 10.13522/j.cnki.ggps.20170036. Michener R, Lajtha K. 2007. Stable isotopes in ecology and environmental science. Oxford, UK: Blackwell Publishing Ltd. Nixdorf E, Sun YY, Lin M, et al. 2017. Development and application of a novel method for regional assessment of groundwater contamination risk in the Songhua River Basin. Science of the Total Environment, 605-606: 598−609. DOI: 10.1016/j.scitotenv.2017.06.126. Pati S, Dash Mihir K, Mukherjee CK, et al. 2014. Assessment of water quality using multivariate statistical techniques in the coastal region of Visakhapatnam, India. Environmental Monitoring and Assessment, 186(10): 6385−6402. DOI: 10.1007/s10661-014-3862-y. Sacchi E, Acutis M, Bartoli M, et al. 2013. Origin and fate of nitrates in groundwater from the central Po plain: Insights from isotopic investigations. Applied Geochemistry, (34): 164−180. DOI: 10.1016/j.apgeochem.2013.03.008. Sun XB, Cui J, Dai YJ. 2022. Research on the evaluation of land resources carrying capacity in Jinzhou area. Geological Bulletin of China, 41(08): 1487−1493. (in Chinese) DOI: 10.12097/j.issn.1671-2552.2022.08.014. Wang YN, Xie HQ, Li FL, et al. 2020. Spatial variation analysis of intensive and economical utilization of urban land in China using ArcGIS. Geomatics & Spatial Information Technology, 43(12): 32−34, 37. (in Chinese) DOI: 10.3969/j.issn.1672-5867.2020.12.008. Yuan HY, Yang SQ, Zhang WF, et al. 2022. Temporal and spatial variation characteristics and drivving factors of nitrogen of shallow groundwater in Hetao irrigation district. Environmental Science, 043(004): 1−15. (in Chinese) DOI: 10.13227/j.hjkx.202107187. Zhang Y, Li FD, Zhang QY, et al. 2014. Tracing nitrate pollution sources and transformation in surface-and ground-waters using environmental isotopes. Science of the Total Environment, 490: 213−222. DOI: 10.1016/j.scitotenv.2014.05.004. Zhang Z, Lu R, Wu SY, et al. 2022. Heavy metal pollution and health risk assessment of mine soil in Yangtze River economic belt. Huan Jing Ke Xue, 43(7): 3763−3772. DOI: 10.13227/J.HJKX.202109102. -

 E-mail alert
 Rss
Rss


 下载:
下载:


