Water resource utilization characteristics and driving factors in the Hainan Island
-
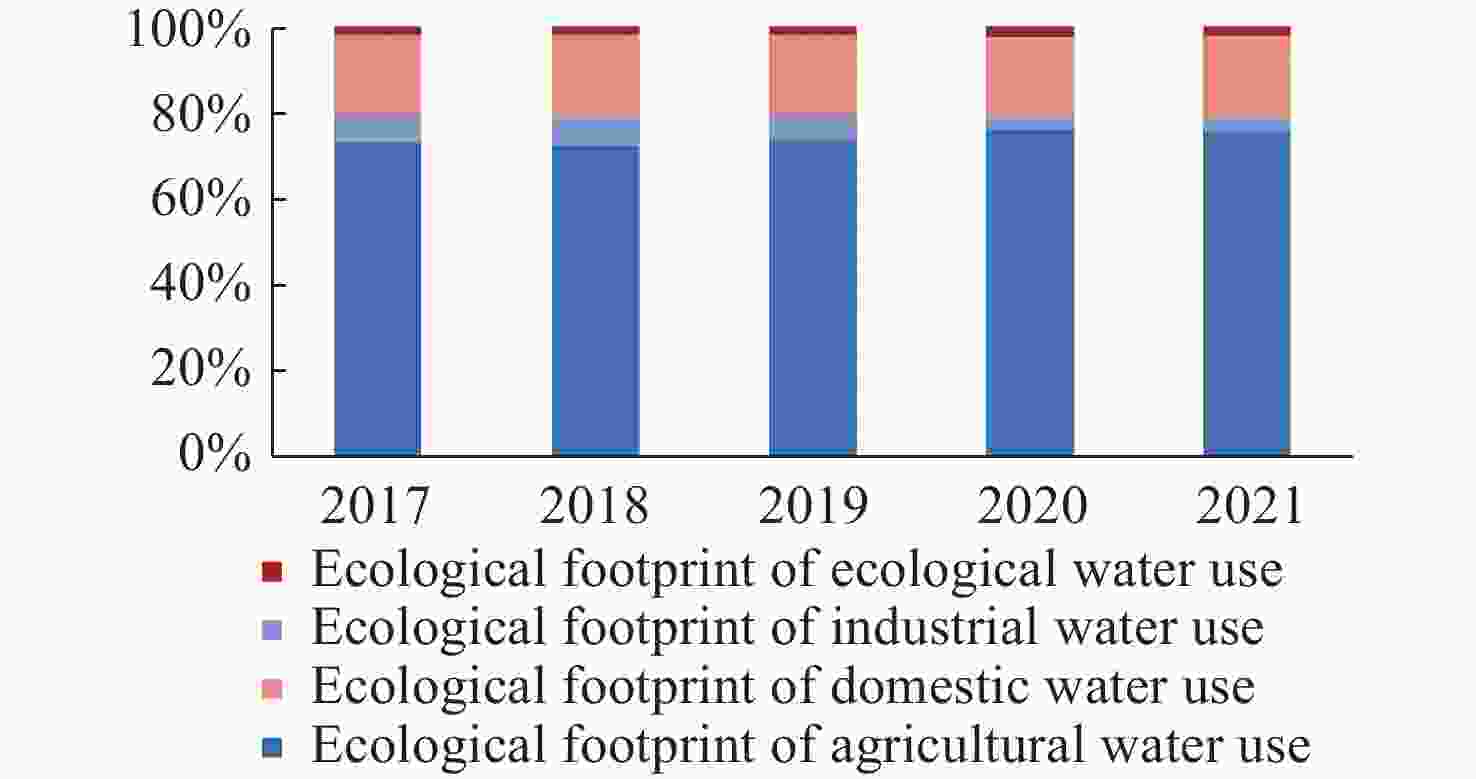
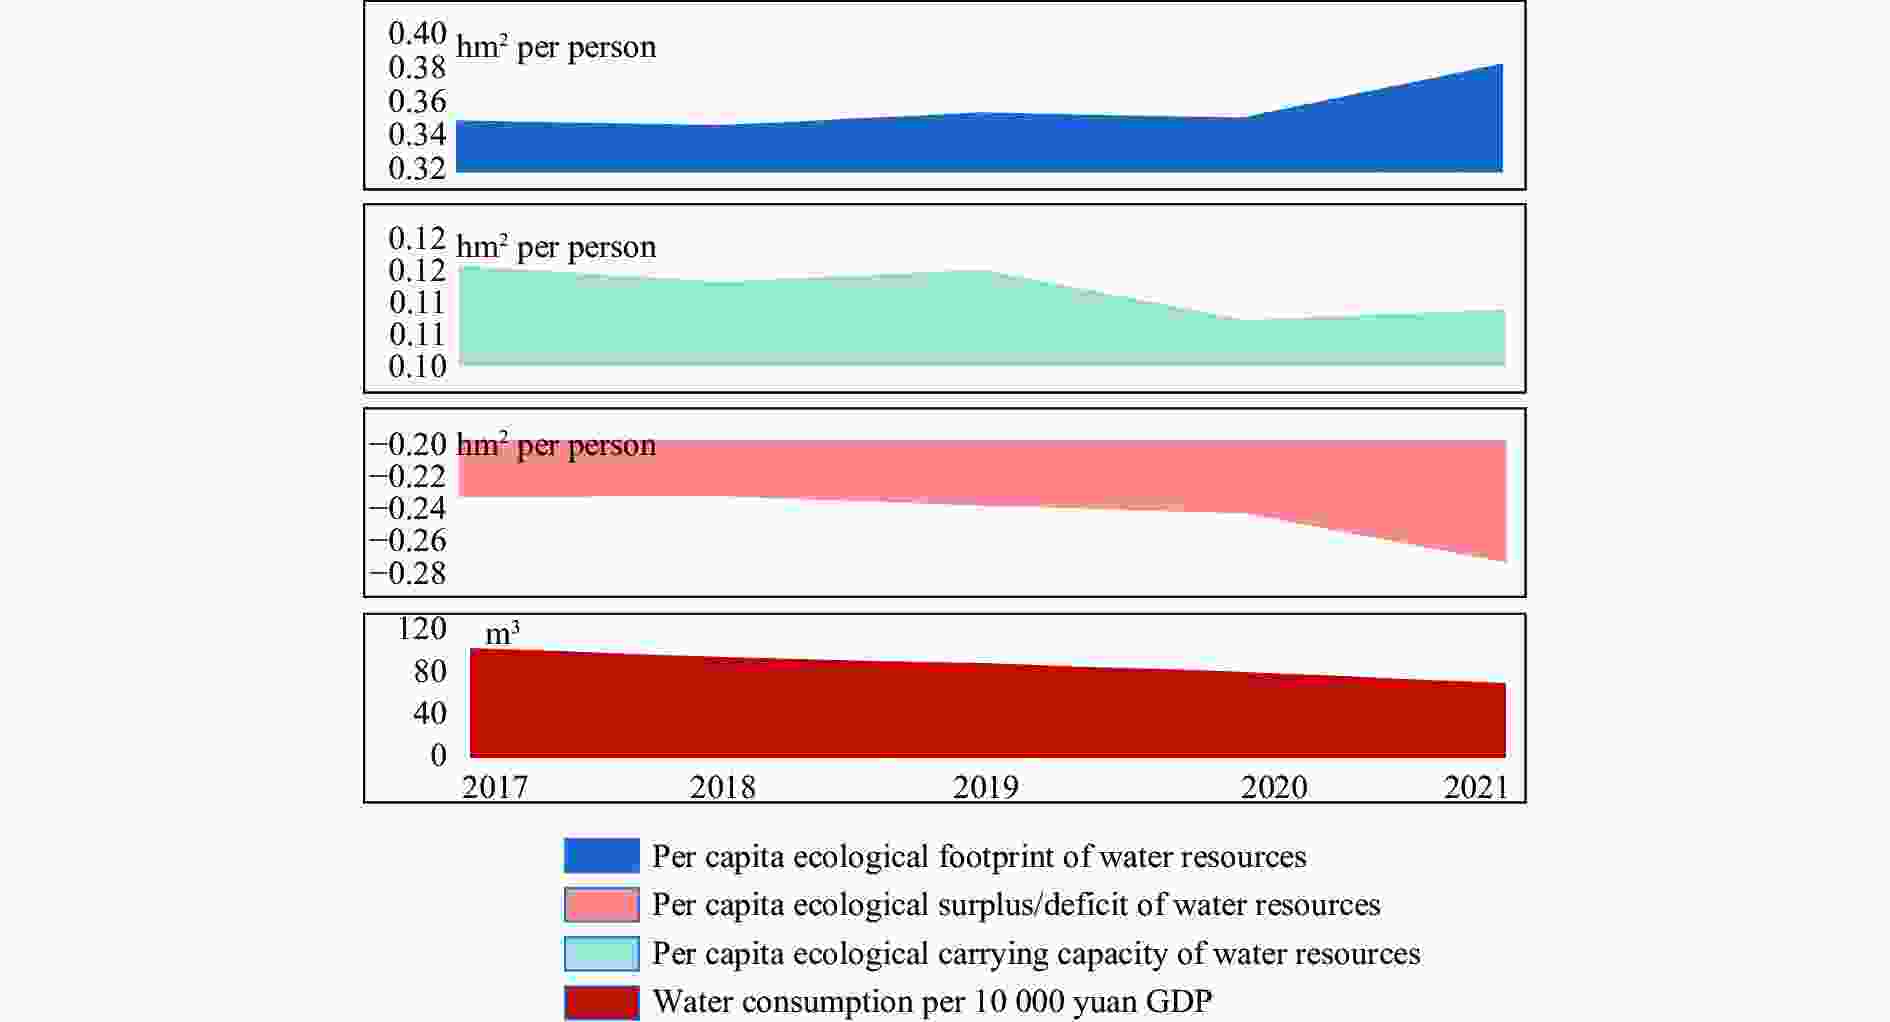
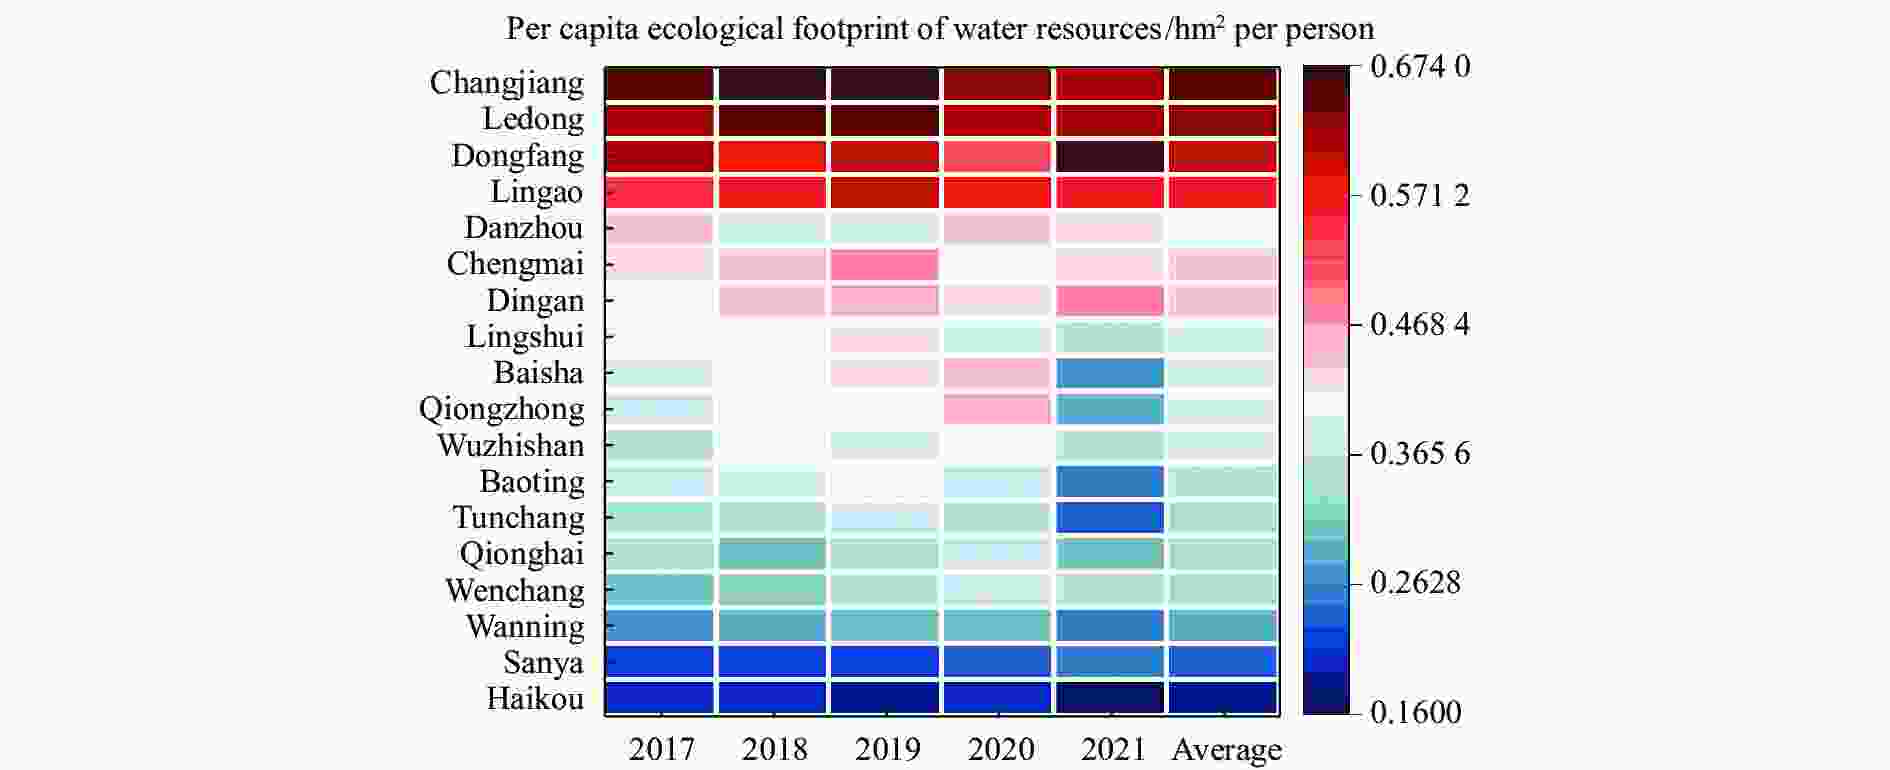
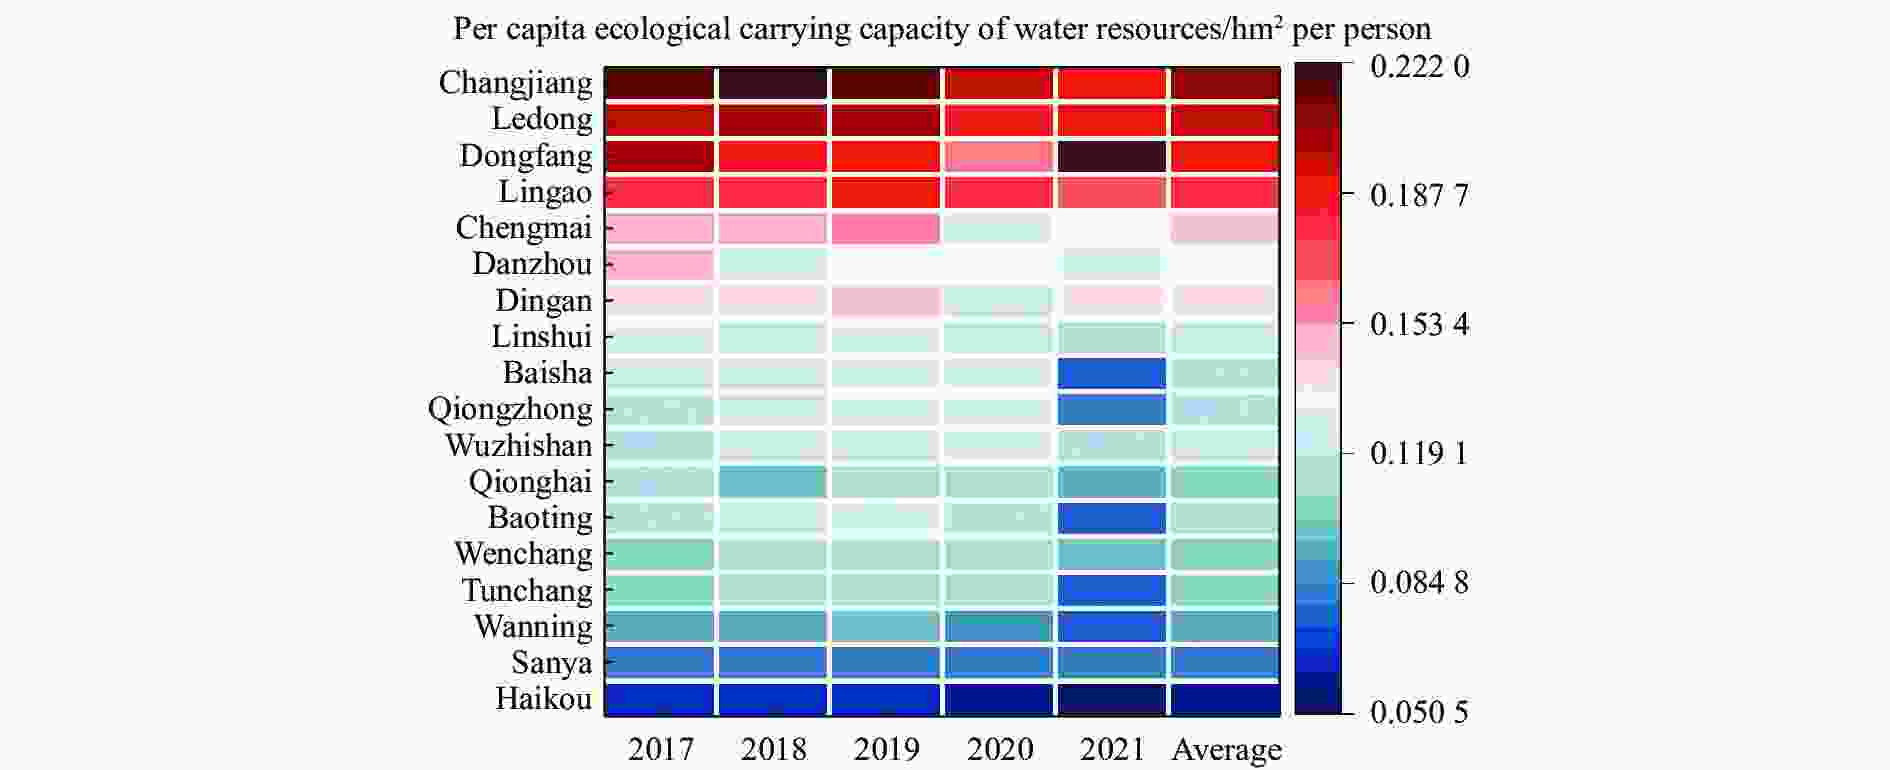
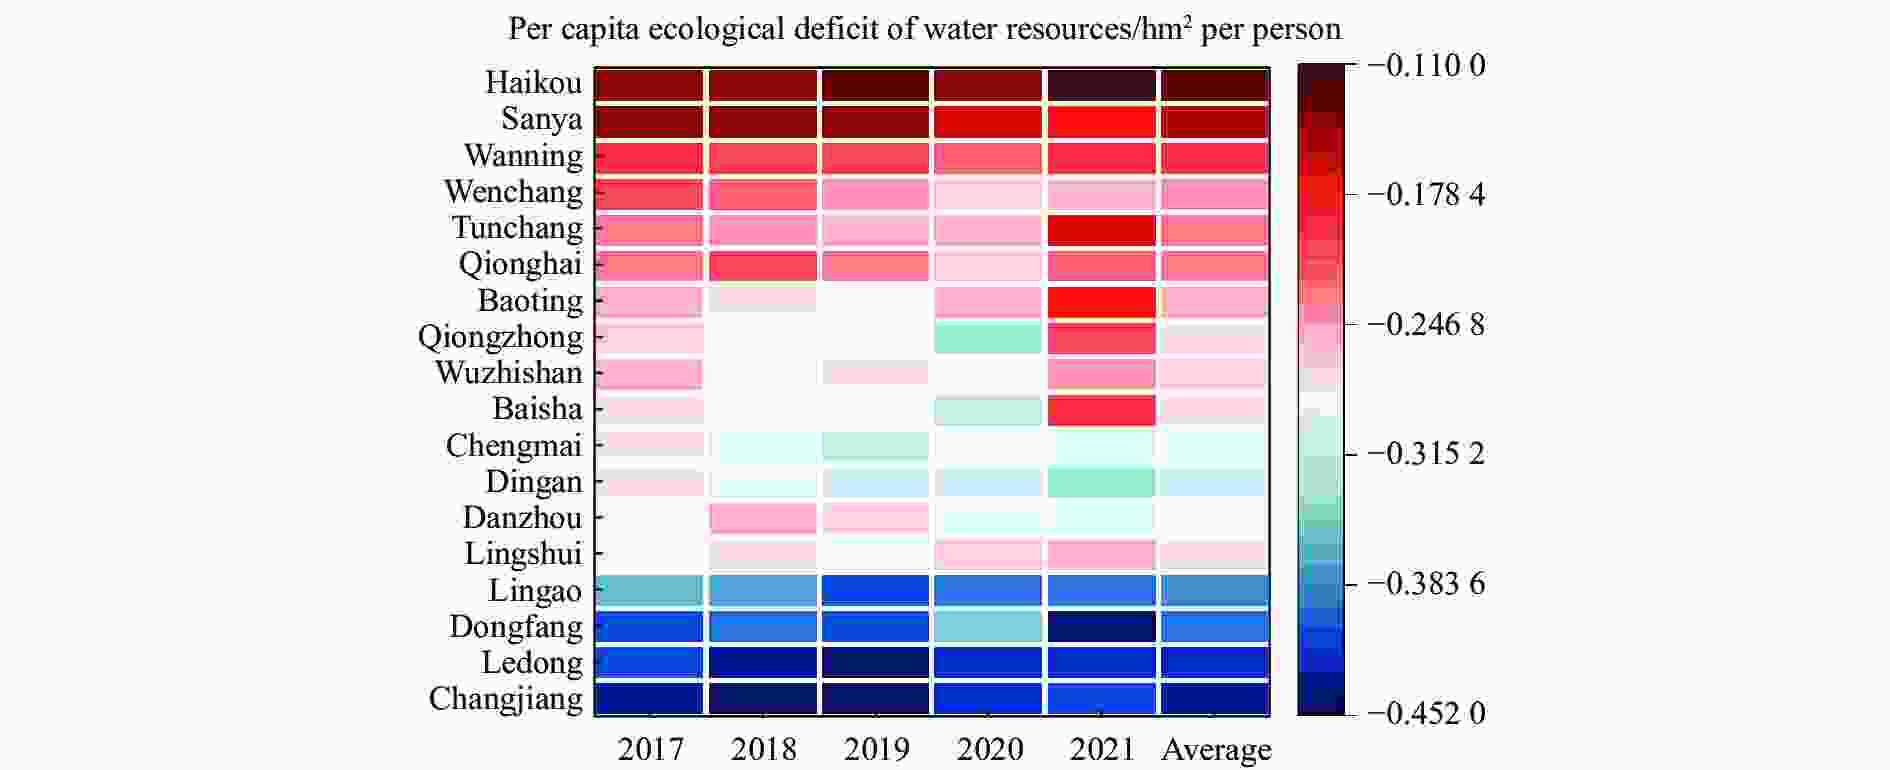
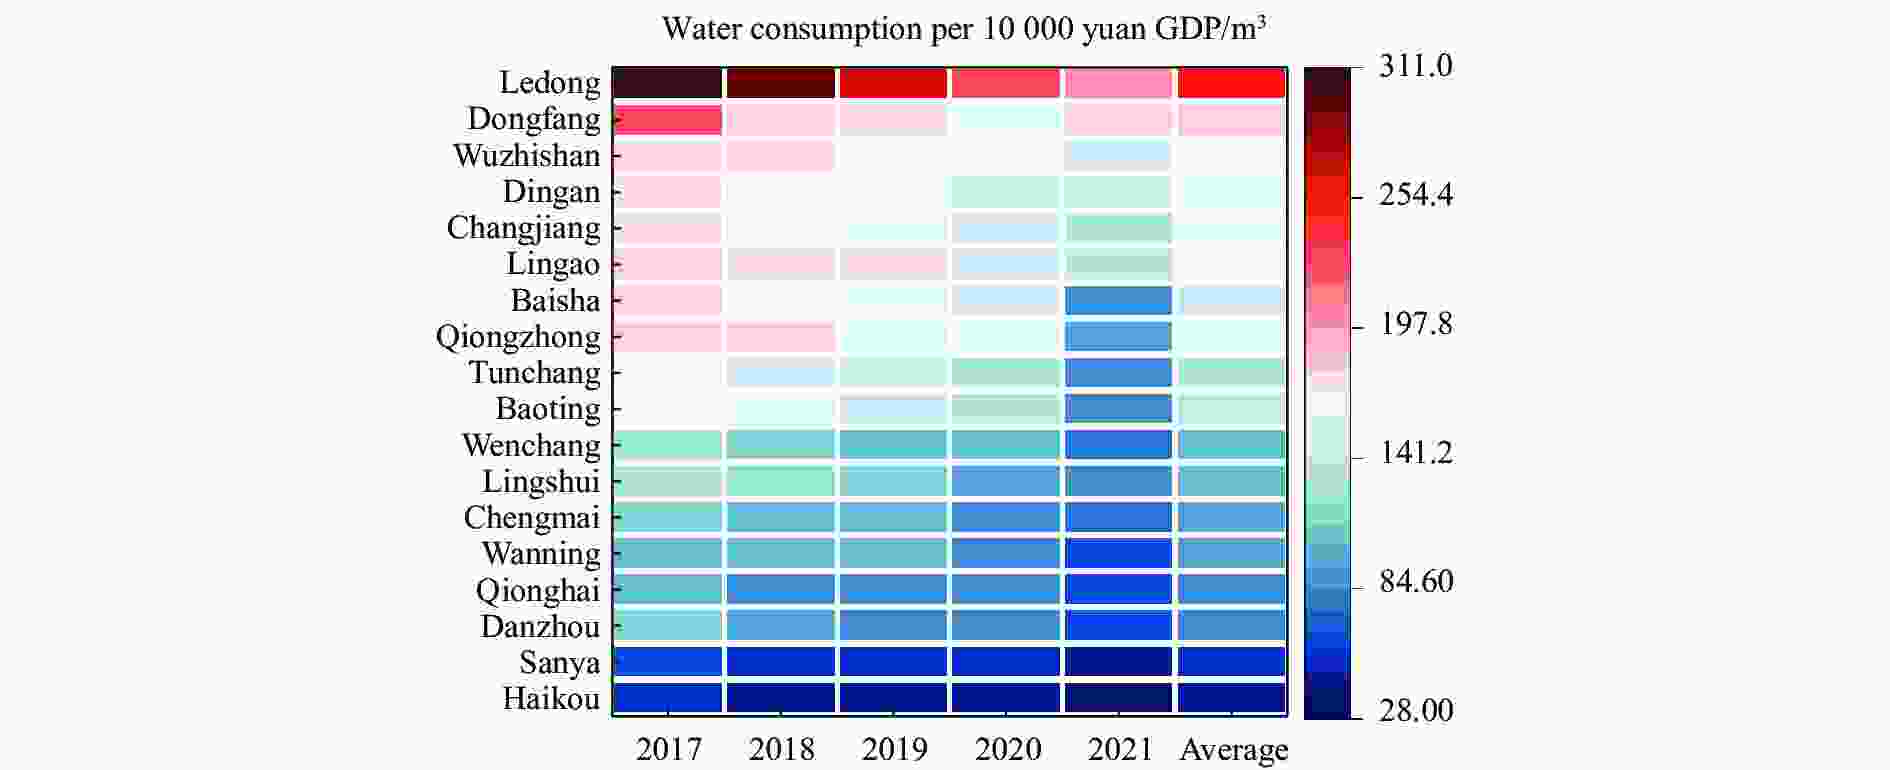
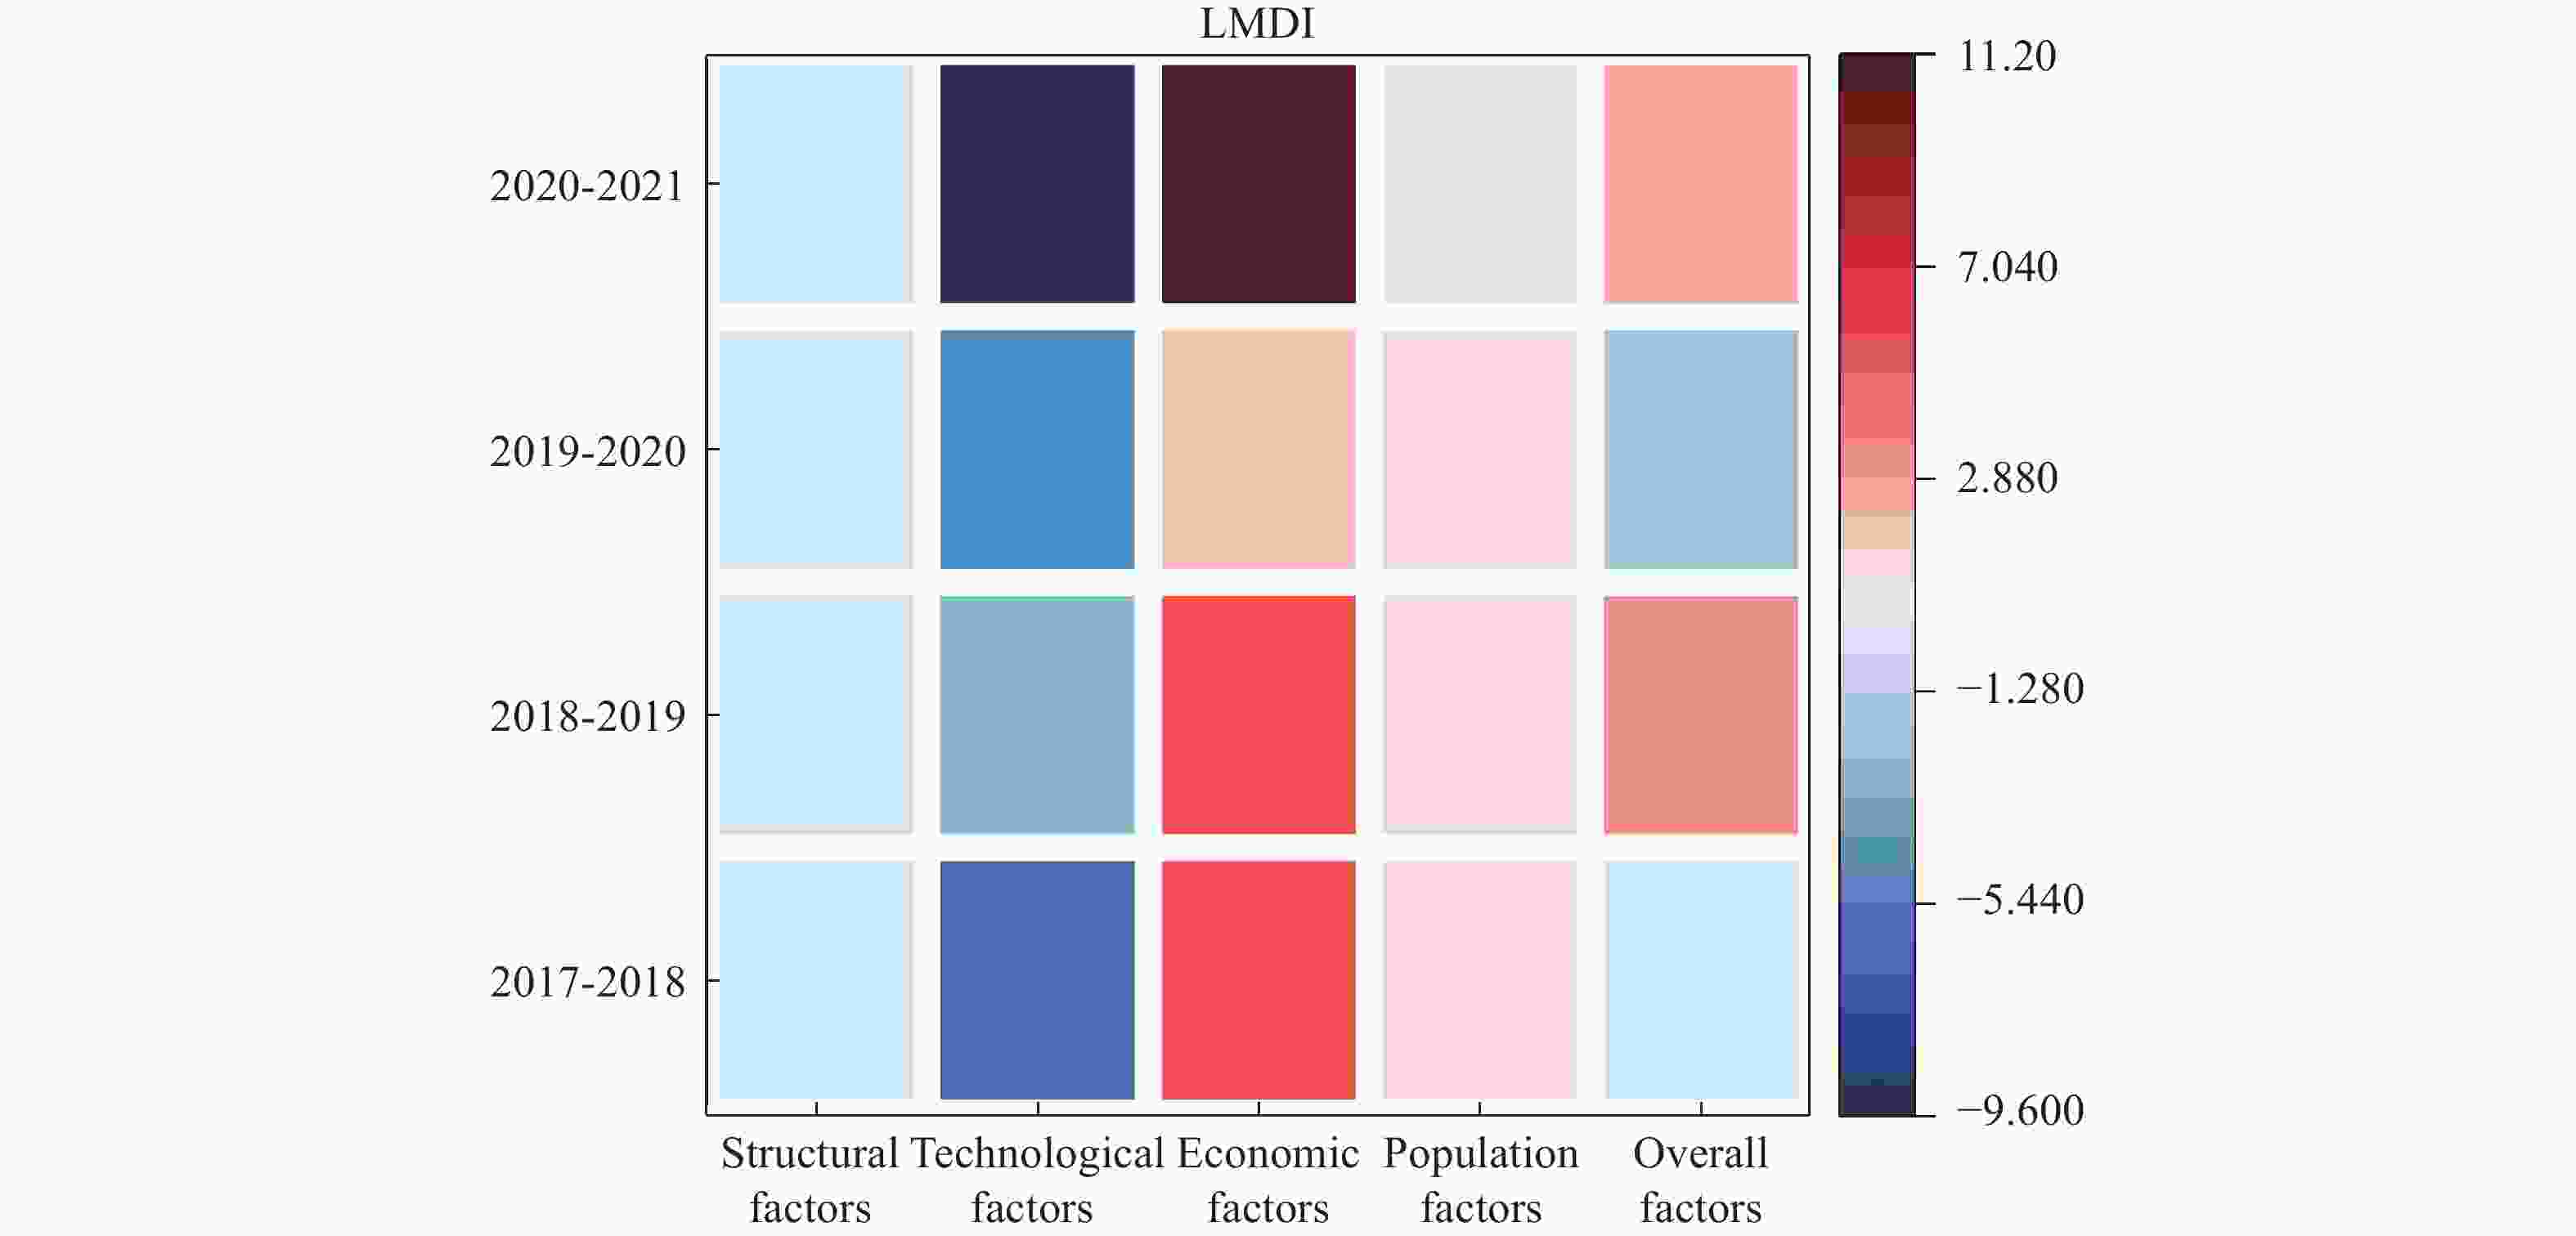
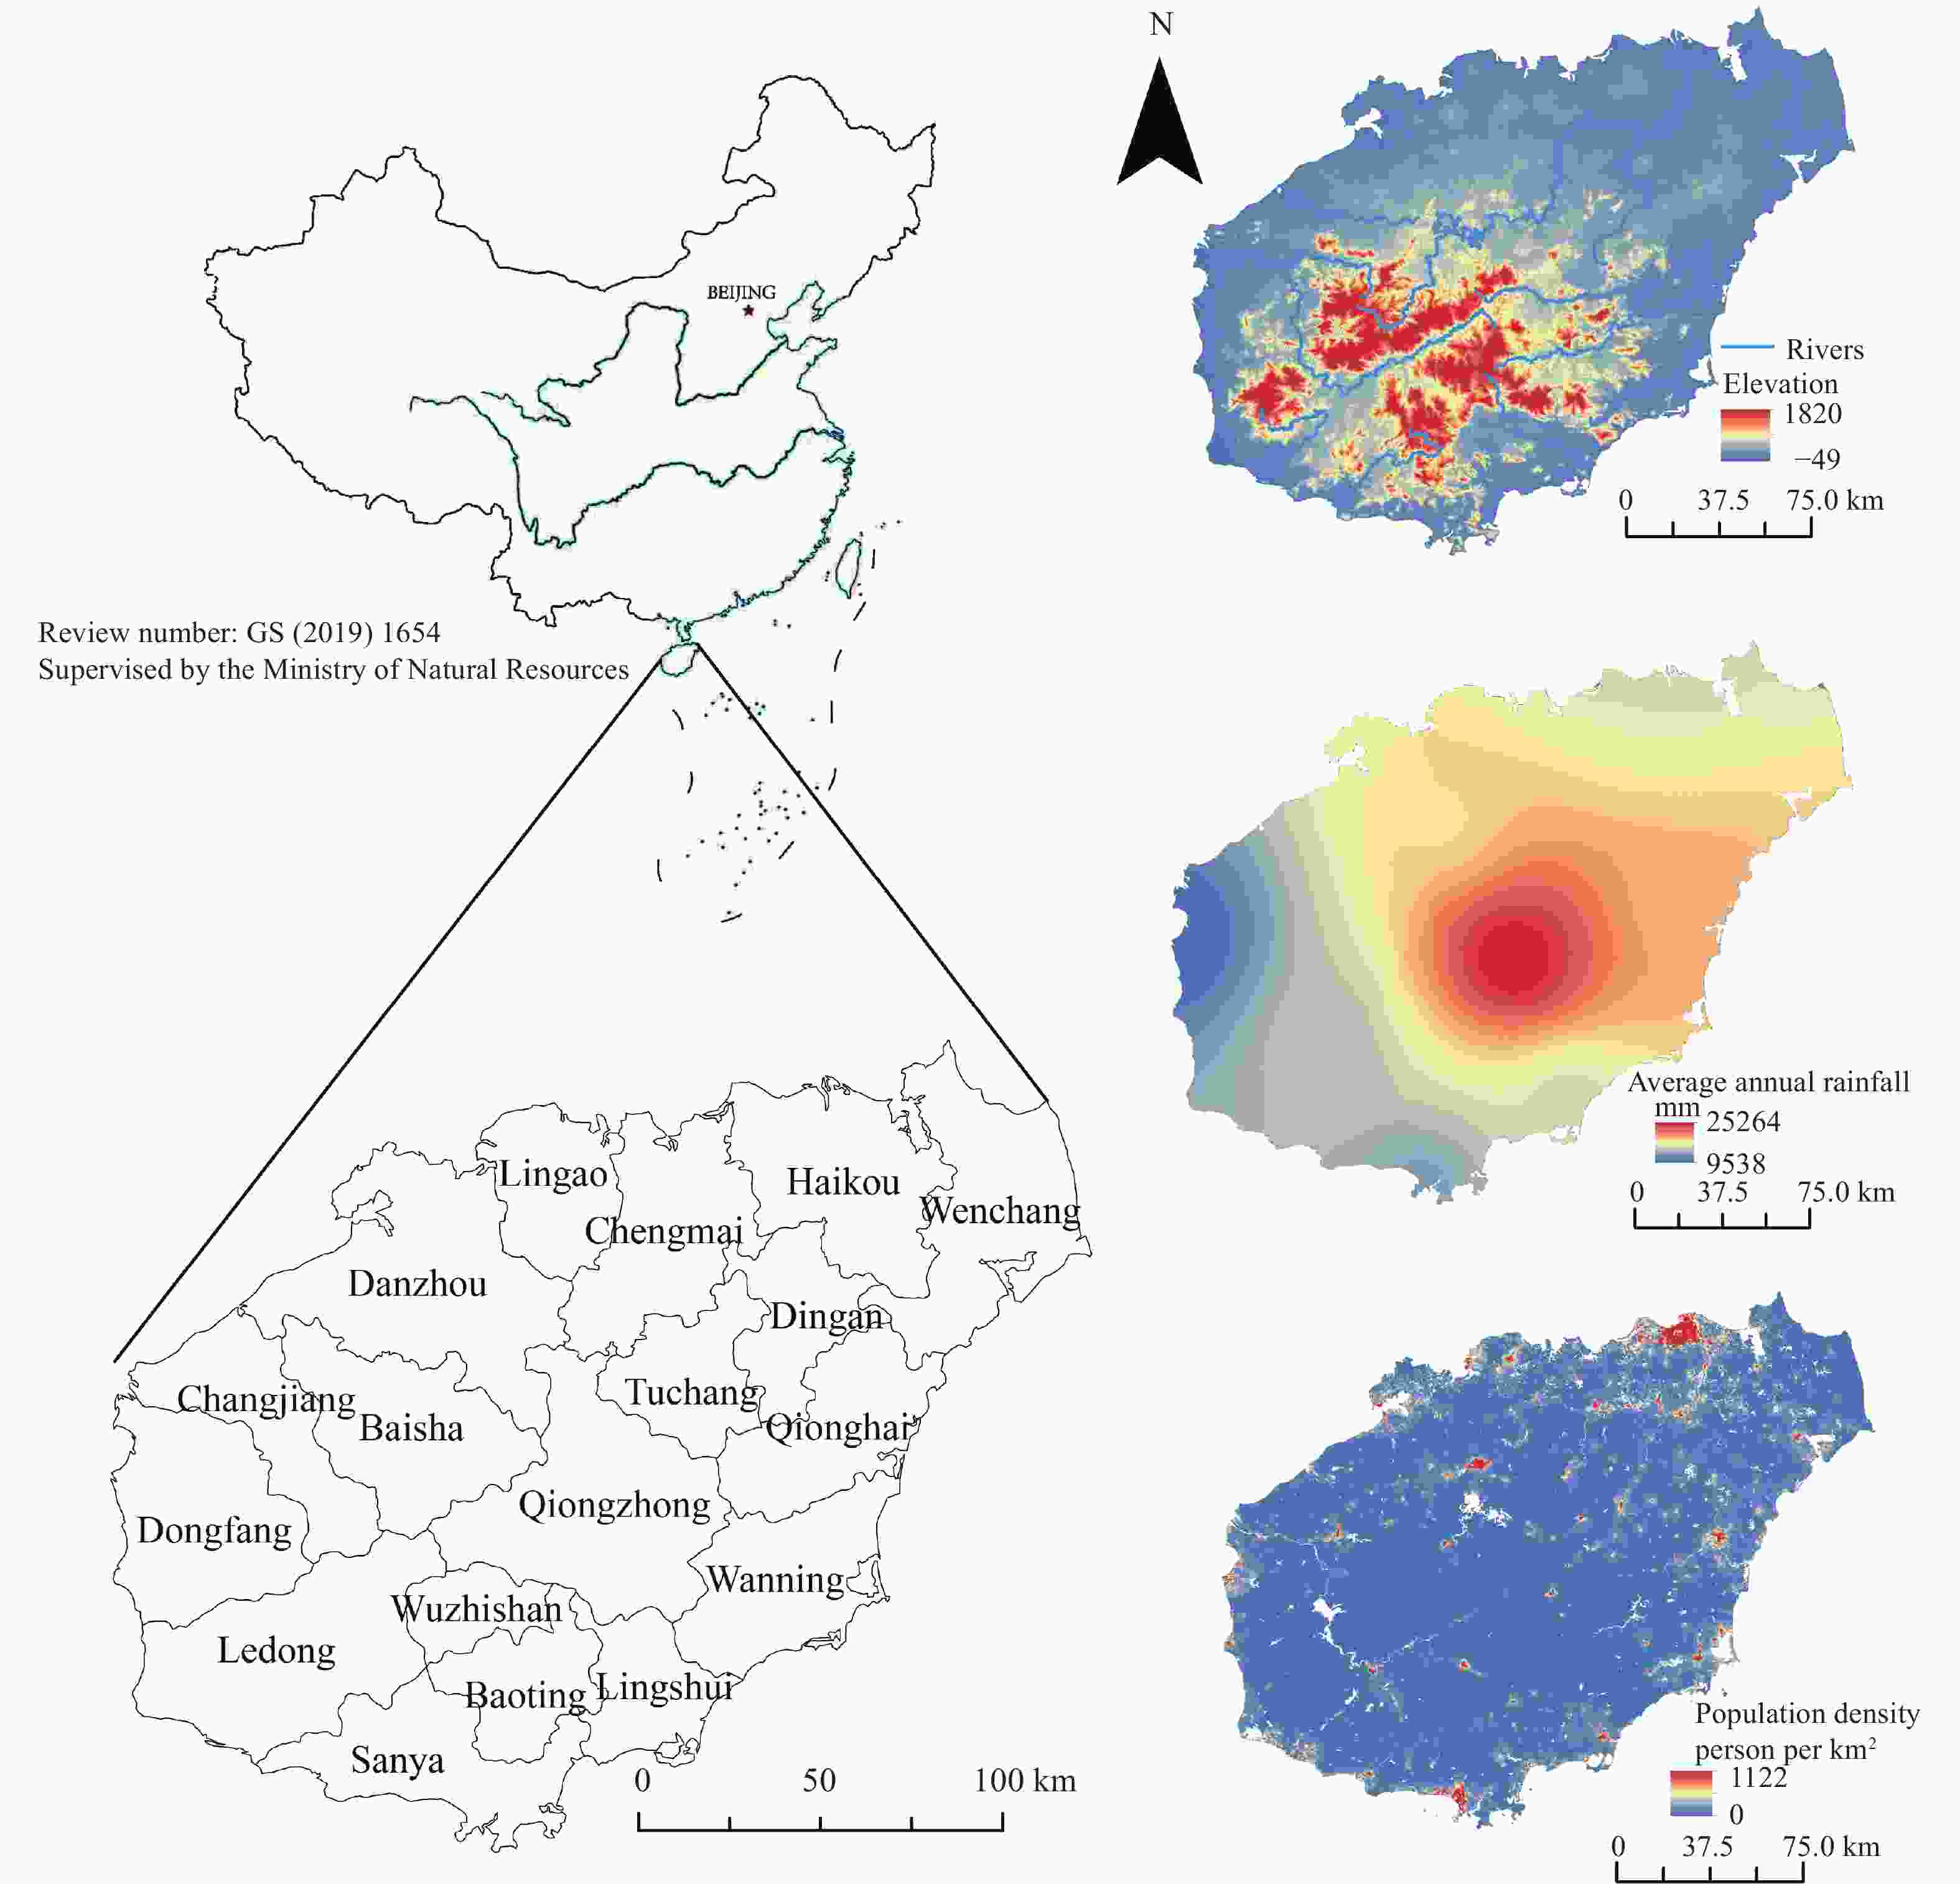
Abstract: The scarcity of water resources caused by the unique topography and uneven rainfall distribution in Hainan Island has become a major factor restricting local development. In order to provide effective and scientific reference basis for the overall water resource utilization status and solving this problem, this study calculated the water resource utilization situation of Hainan Island from 2017 to 2021 in detail using methods including water resource ecological footprint analysis. Furthermore, a spatial correlation analysis was conducted to examine the island’s water resource utilization characteristics, and the driving factors behind the changes in water resource utilization over the past five years were analyzed using the LMDI model. The results show that: (1) During the study period, the water resource ecological footprint in Hainan Island exhibited a slow growth trend, while the ecological carrying capacity showed a downward tendency. The per capita ecological deficit of water resources remains relatively high, and the water consumption per 10 000 yuan GDP in the whole land continues to decrease, indicating that the overall pressure on water resource demand remains high with significant regional differences accompanied by the efficiency of water resource utilization steadily improving at the same time; (2) Agricultural water use accounts for the highest proportion in the entire water use structure, while ecological water use represents the smallest share, with a year-on-year increase, indicating that Hainan Island highlights the agricultural development and is increasingly conscious of the ecological environment; (3) Significant spatial differentiation in water resource utilization characteristics exists in Hainan Island, with the western region being a hot spot aggregation area for per capita water resource ecological footprint, per capita ecological carrying capacity of water resources, water consumption per 10 000 yuan GDP, while it is a cold spot cluster area for per capita ecological deficit of water resources. The opposite holds true for the eastern region of Hainan Island; (4) Economic and technological factors have a major impact on the changes in water resource ecological footprint within the designated area. Among them, economic factors drive the growth of the water resource ecological footprint in Hainan Island, and exacerbate local water resource consumption, while technological factors negatively contribute to the amount of water resource utilization in Hainan Island, indicating that advanced technology has improved water resource utilization efficiency and significantly reduced water resource consumption.
-
Table 1. Moran’s I statistics for water resource utilization characteristics in Hainan Island from 2017 to 2021
Hainan Island Per capita ecological footprint of water
resourcesPer capita ecological carrying capacity of water resources I Variance Z(P) P I Variance Z(P) P 2017 0.464 75 0.043 157 2.520 29 0.011 726 0.483 192 0.043 320 2.604 172 0.009 210 2018 0.352 48 0.042 888 1.986 04 0.047 028 0.377 248 0.042 965 2.103 786 0.035 397 2019 0.340 11 0.043 020 1.919 32 0.054 944 0.374 435 0.043 278 2.082 648 0.037 283 2020 0.292 56 0.042 488 1.704 68 0.088 253 0.358 527 0.042 292 2.029 424 0.042 415 2021 0.339 53 0.044 180 1.895 22 0.058 063 0.378 596 0.043 108 2.106 775 0.035 137 Hainan
IslandPer capita ecological surplus/deficit of water resources Water consumption per 10 000 yuan GDP I Variance Z(P) P I Variance Z(P) P 2017 0.450 41 0.043 128 2.452 11 0.014 202 0.091 243 0.040 106 0.749 344 0.453 650 2018 0.337 28 0.042 883 1.912 78 0.055 776 0.008 160 0.039 355 0.337 650 0.735 627 2019 0.321 33 0.043 154 1.829 99 0.067 252 −0.003 590 0.040 476 0.274 547 0.783 664 2020 0.256 90 0.042 665 1.528 52 0.126 383 0.028 143 0.042 166 0.423 516 0.671 919 2021 0.317 40 0.044 551 1.782 48 0.074 671 0.111 384 0.041 865 0.831 860 0.405 488 -
Cao JK, Zhang J, Ma SQ. 2014. The analysis of water resource ecological carrying capacity of Hainan International Island. Springer International Publishing. DOI: 10.1007/978-3-319-03449-2_7. Chen J, Xu L, Wu DL. 2022. Water-saving technology, rebound effect of irrigation water use and regional heterogeneity in the North China Plain - an analysis based on Malmquist and LMDI indices. Journal of Natural Resources, 37(8): 2181−2194. (in Chinese) DOI: 10.31497/zrzyxb.20220817. Chen YG. 2009. Spatial autocorrelation theory development and method improvement based on Moran statistics. Geographical Research, 28(6): 1449−1463. (in Chinese) DOI: 10.11821/yj2009060002. Cheng HX, Hu LQ, Lin YJ. 2014. Spatial and temporal distribution characteristics of cold hot spots of dust storms in Xinjiang in the past 50a. Arid Zone Resources and Environment, 28(7): 100−104. (in Chinese) DOI: 10.13448/j.cnki.jalre.2014.07.011. Dai D, Sun MD, Xu XQ, et al. 2019. Assessment of the water resource carrying capacity based on the ecological footprint: A case study in Zhangjiakou City, North China. Environmental Science & Pollution Research International. Deng W, Yan L, Wang Y, et al. 2019. A study on water resources carrying capacity based on water usage intensity in Hainan Province. Iop Conference Series: Earth and Environmental Science, 237(3). DOI: 10.1088/1755-1315/237/3/032090. Dong YH, Liu SL, An NN, et al. 2015. Landscape pattern dynamics in Da’an City, Jilin based on landscape index and spatial autocorrelation. Journal of Natural Resources, 30(11): 1860−1871. (in Chinese) DOI: 10.11849/zrzyxb.2015.11.007. Fu QJ, Xing QF, Lin ZH. 2022. A brief analysis of the characteristics of the series of precipitation changes in Hainan Island from 1956 to 2016. Water Resources Technical Supervision, (4): 135−138. (in Chinese) Gernot SA,Peter EBC,Peter DB, et al. 2011. The water supply footprint (WSF): A strategic planning tool for sustainable regional and local water supplies. Journal of Cleaner Production, 19(15): 1677−1686. Guo S, Liu GL, Liu SX. 2023. Driving factors of NOX emission reduction in China’s power industry: Based on LMDI decomposition model. Environmental Science and Pollution Research International, 30(17): 51042−51060. DOI: 10.1007/s11356-023-25873-1. Huang BR, Cui SH, Li YM. 2016. Characteristics of ecological footprint changes and influencing factors from 2000 to 2010 in China. Environmental Science, 37(2): 420−426. (in Chinese) DOI: 10.13227/j.hjkx.2016.02.003. Huang L, Zhang LZ, Zhu JX, et al. 2019. Spatial and temporal characteristics of water resources carrying capacity in Henan Province. South-North Water Diversion and Water Conservancy Science and Technology, 17(1): 54−60. (in Chinese) DOI: 10.13476/j.cnki.nsbdqk.2019.0008. Huang LN, Zhang WX, Jiang CL, et al. 2008. Ecological footprint calculation method for water resources. Journal of Ecology, (3): 1279−1286. (in Chinese) DOI: 10.3321/j.issn:1000-0933.2008.03.044. Ridha I, Ben SH. 2018. Water footprint and economic water productivity of sheep meat at farm scale in humid and semi-arid agro-ecological zones. Small Ruminant Research, S092144881830484X. Jia CZ, Qiao YY, Guan GG, et al. 2019. Spatial and temporal variation characteristics and drivers of ecological footprint of water resources in Shanxi Province. Soil and Water Conservation Research, 26(2): 370−376. (in Chinese) DOI: 10.13869/j.cnki.rswc.2019.02.053. Li FG, Liu W, Dong ZF, et al. 2023. Comprehensive evaluation of ecological footprint and sustainable use of water resources in Sichuan Province. Environmental Pollution and Prevention, 45(2): 245−249, 256. (in Chinese) DOI: 10.15985/j.cnki.1001-3865.2023.02.019. Li LB. 2019. Estimation of water resources availability in Hainan Island. Water Information Technology, 6: 38−44. (in Chinese) DOI: 10.19364/j.1674-9405.2019.06.007. Liang X, Zhu LR, Lin YW, et al. 2021. Study on the influence mechanism and evolution of water resources security system in Nandu River basin of Hainan Island. Water Resources and Hydropower Technology, 52(8): 101−109. (in Chinese) DOI: 10.13928/j.cnki.wrahe.2021.08.010. Liu ZG, Zheng Y. 2011. Study on the ecological carrying capacity of regional water based on the ecological footprint method: The case of Huzhou City, Zhejiang Province. Resource Science, 33(6): 1083−1088. (in Chinese) Liu ZY, Fei Y, Shi HD, et al. 2021. Analysis of soil heavy metal sources in Rucheng County, Hunan Province based on UNMIX model and Moran index. Environmental Science Research, 34(10): 2446−2458. (in Chinese) DOI: 10.13198/j.issn.1001-6929.2021.05.25. Lu C, Xi R, Hei ZJ, et al. 2022. Safety Evaluation of water environment carrying capacity of five cities in Ningxia based on ecological footprint of water resources. Asian Agricultural Research, 14(5): 11−16. Lu L, Fan LJ, Pei LX, et al. 2023. Groundwater resources and their environmental geological problems in Hainan Island. Geology in China: 1−17. (in Chinese) Meng QX, Zheng YN, Liu Q, et al. 2023. Analysis of spatiotemporal variation and influencing factors of land-use carbon emissions in nine provinces of the Yellow River Basin based on the LMDI Model. Land, 12(2), 437. Ma XL, Qiao YQ, Wang J, et al. 2023. Spatial and temporal patterns of depth and breadth of water ecological footprint and influencing factors in Shaanxi Province. Arid Zone Research, 40(3): 469−480. (in Chinese) DOI: 10.13866/j.azr.2023.03.13. Niu FQ, Yang XY, Sun DQ. 2020. Evaluation of resource and environmental carrying capacity under different development patterns: The case of Hainan Province. Tropical Geography, 40(6): 1109−1116. (in Chinese) DOI: 10.13284/j.cnki.rddl.003281. Ouyang XT, Liao HY, Jiang QX, et al. 2023. Simulation and regulation of sustainable water resources use in China based on an improved ecological footprint model of water resources. Environmental Science, 44(3): 1368−1377. (in Chinese) DOI: 10.13227/j.hjkx.202204267. Pinto EP, Pires MA, Matos RS. et al. 2021. Lacunarity exponent and Moran index: A complementary methodology to analyze AFM images and its application to chitosan films. Physica A: Statistical Mechanics and Its Applications, 581. DOI: 10.1016/j.physa.2021.126192. Sylwia SD, Peter FR,Andrzej B. 2022. Aerobic biostabilization of the organic fraction of municipal solid waste-monitoring hot and cold spots in the reactor as a novel tool for process optimization. Materials (Basel, Switzerland), 15(9): 3300. DOI: 10.3390/ma15093300. William ER, Wackernagel M. 1996. Ecological footprints and appropriated carrying capacity: Measuring the Natural Capital Requirements of the Human Economy. William ER. 1992. Ecological footprints and appropriated carrying capacity: What urban economics leaves out. Environment and Urbanization. Wu Z, Chen X, Liu BB, et al. 2014. Simulation of spatial distribution of water yield in Hainan Island under different land use/cover types. Water Resources Conservation, 30(3): 5. (in Chinese) Xia J, Diao YX, She DX, et al. 2022. Analysis of water resource ecological security and carrying capacity in Poyang Lake basin. Water Resources Conservation, 38(3): 1−8, 24. (in Chinese) Xu LL, Liu HQ, Jin Y, et al. 2017. Characteristics of water resources development and utilization and major water resources problems in Hainan Province. Tropical Agricultural Science, 37(9): 120−127. (in Chinese) DOI: 10.12008/j.issn.1009-2196.2017.09.024. Yang B, Wang W, Qin DJ, et al. 2022. Analysis and prediction of water resources carrying capacity of Hainan Island. Hydrology, 42(3): 78−83. (in Chinese) Yang B, Wang W, Qin DJ, et al. 2022. Evaluation of engineering water shortage constraints in Hainan Island. China Rural Water Conservancy and Hydropower, 12: 121−127. (in Chinese) DOI: 10.19797/j.cnki.1000-0852.20210110. Zhao XF. 2023. Carbon emission drivers and regional differences in China based on LMDI model. Modern Marketing, 3: 15−17. (in Chinese) DOI: 10.19932/j.cnki.22-1256/F.2023.03.015. Zhu ZR, Zhan YQ, Cao YQ, et al. 2022. Spatial and temporal characteristics of the ecological footprint of water resources in Liaoning Province and its influencing factors. Journal of the Changjiang Academy of Sciences, 39(11): 29−34. (in Chinese) DOI: 10.11988/ckyyb.202106902022. -

 E-mail alert
 Rss
Rss


 下载:
下载:
