Effective groundwater level recovery from mining reduction: Case study of Baoding and Shijiazhuang Plain area
-
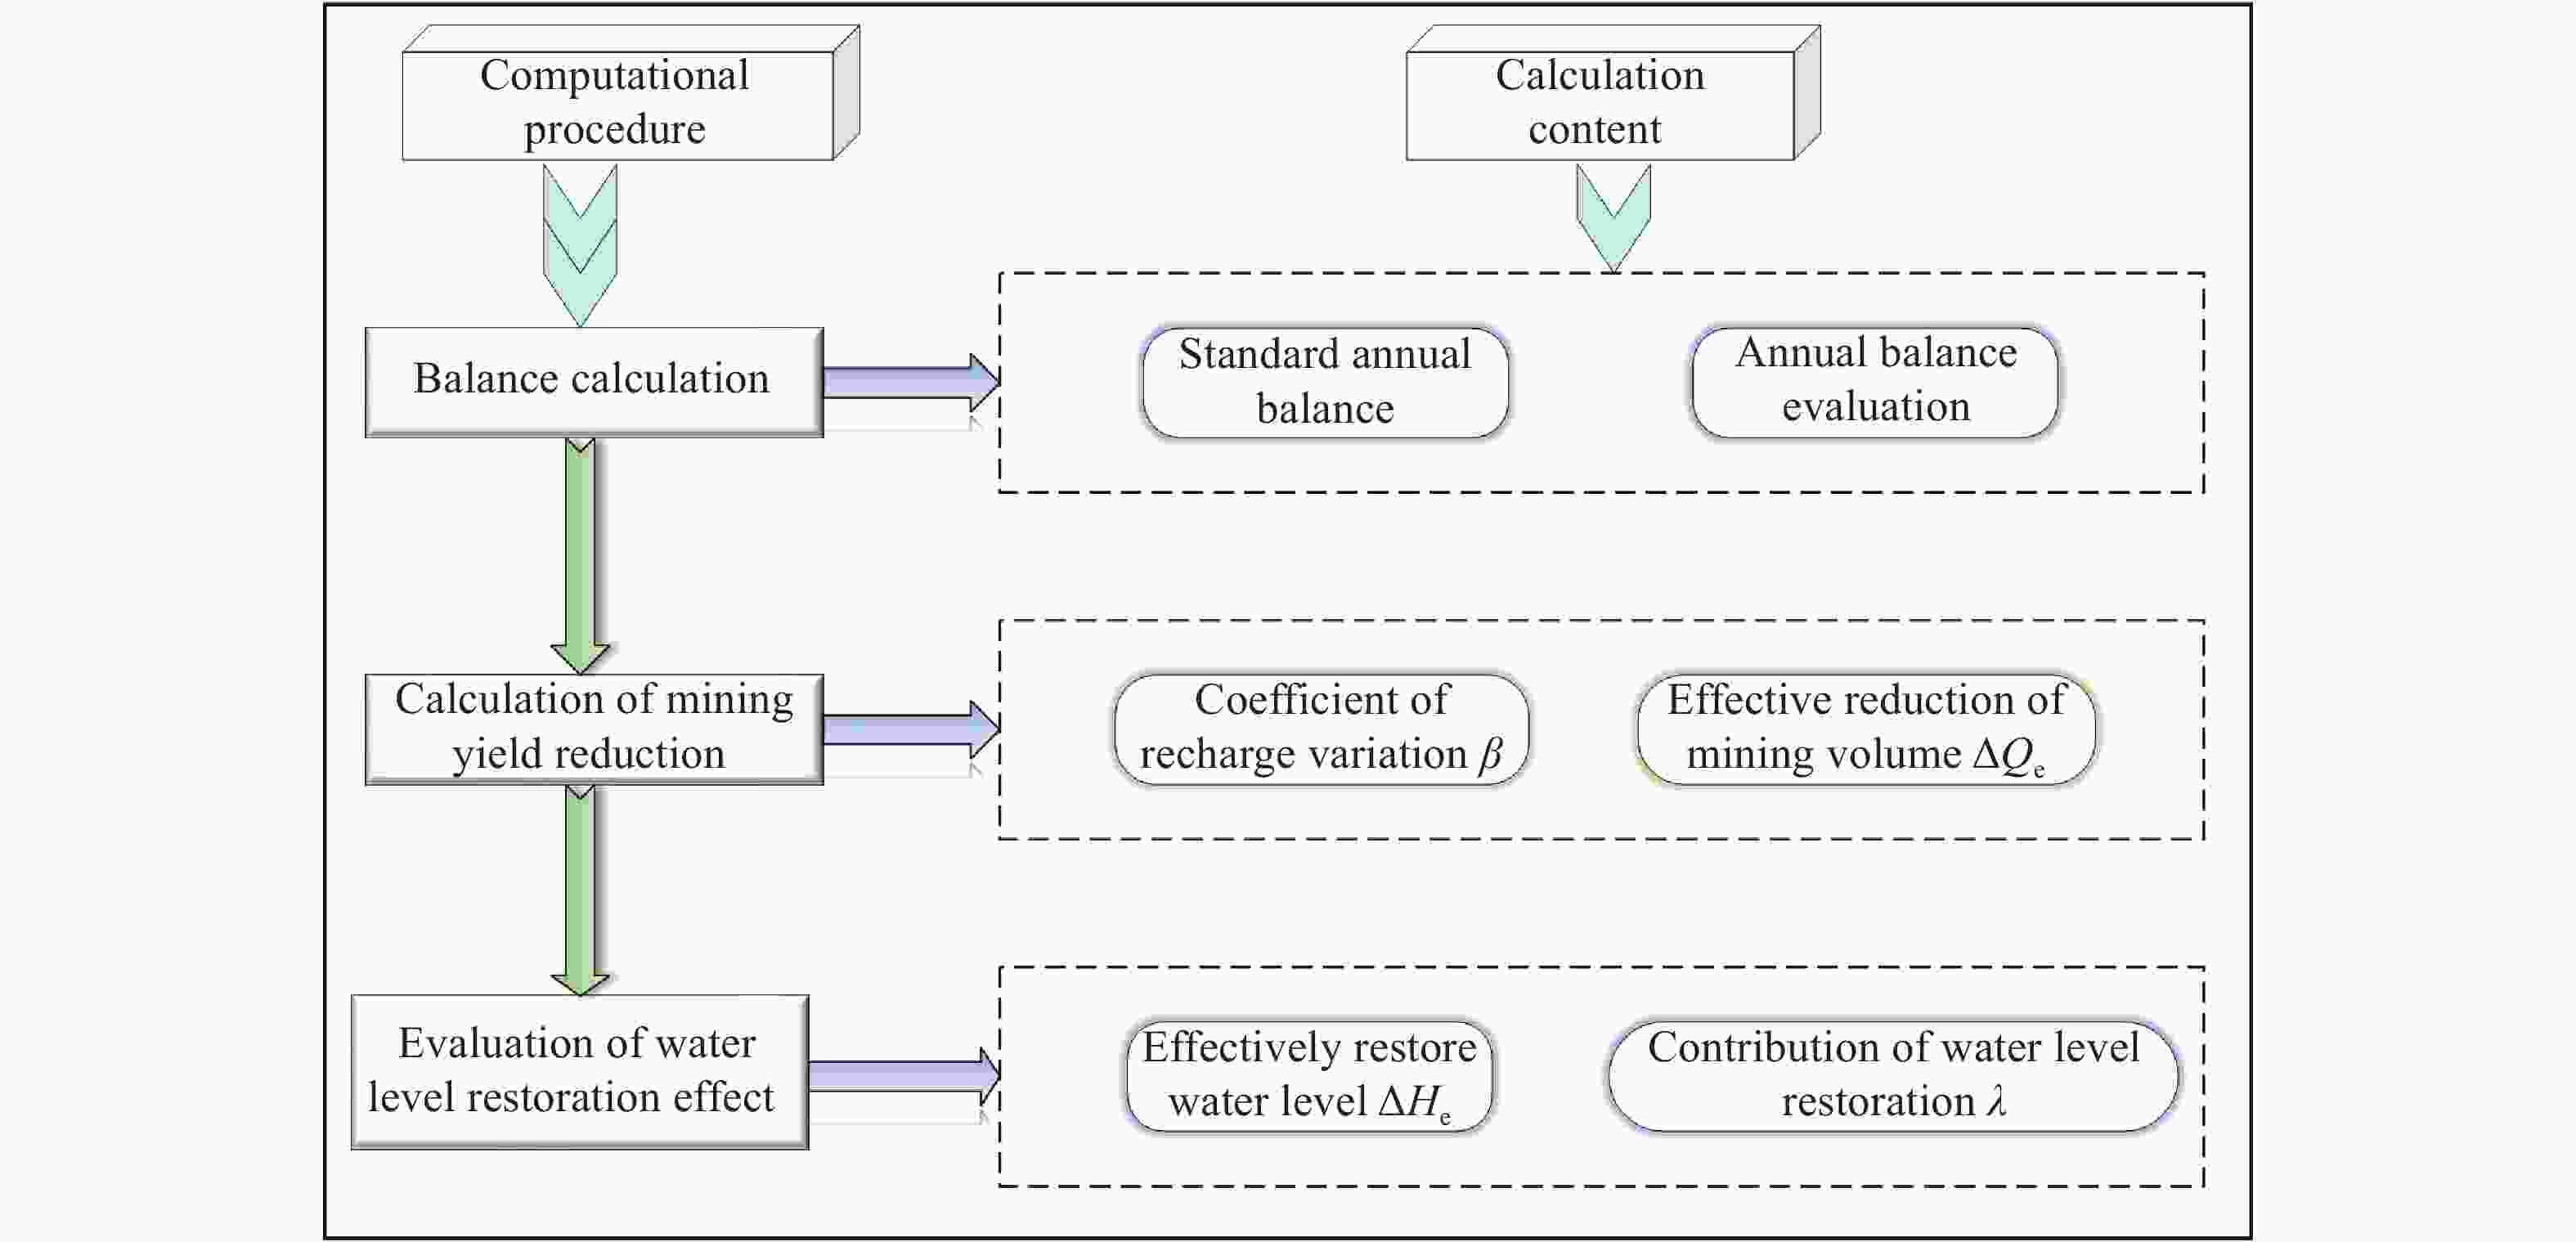
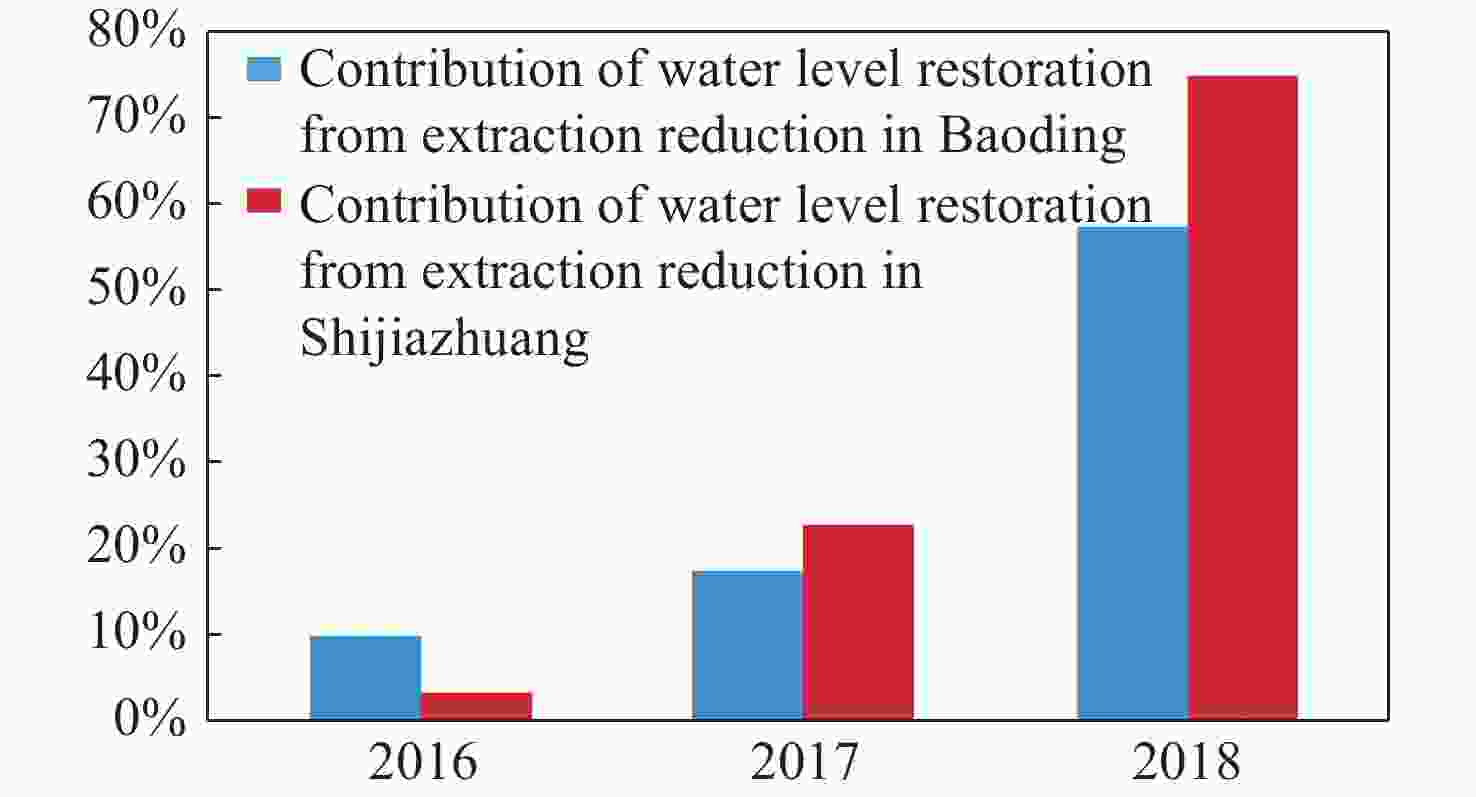
Abstract: The effective recovery of water level is a crucial measure of the success of comprehensive groundwater over-exploitation management actions in North China. However, traditional evaluation method do not directly capture the relationship between mining and other equilibrium elements. This study presents an innovative evaluation method to assess the water level recovery resulting from mining reduction based on the relationship between variation in exploitation and recharge. Firstly, the recharge variability of source and sink terms for both the base year and evaluation year is calculated and the coefficient of recharge variation β is introduced, which is then used to calculate the effective mining reduction and solve the water level recovery value caused by the effective mining reduction, and finally the water level recovery contribution by mining reduction is calculated by combining with the actual volume of mining reduction in the evaluation area. This research focuses on Baoding and Shijiazhuang Plain area, which share similar hydrogeological conditions but vary in groundwater exploitation and utilization. As the effect of groundwater level recovery with mining reduction was evaluated in these two areas as case study. In 2018, the results showed an effective water level recovery of 0.17 m and 0.13 m in the shallow groundwater of Shijiazhuang and Baoding Plain areas, respectively. The contributions of recovery from mining reduction were 76% and 57.98% for these two areas, respectively. It was notable that the water level recovery was most prominent in the foothill plain regions. From the evaluation results, it is evident that water level recovery depends not only on the intensity of groundwater mining reduction, but also on its effectiveness. The value of water level recovery alone cannot accurately indicate the intensity of mining reduction, as recharge variation significantly influences water level changes. Therefore, in practice, it is crucial to comprehensively assess the impact of mining reduction on water level recovery by combining the coefficient of recharge variation with the contribution of water level recovery from mining reduction. This integrated approach provide a more reasonable and scientifically supported basis, offering essential data support for groundwater management and conservation. To improve the accuracy and reliability of evaluation results, future work will focus on the standardizing and normalizing raw data processing.
-
Table 1. List of the feature variable dataset
Cone of depression feature variable data set Class Indicator Source characteristic Meteorological factors Precipitation Statistical data Accumulative Evaporation Statistical data Accumulative Topographical factors Terrain slope Remote
sensing dataDistributive Surface elevation Remote
sensing dataDistributive Anthropogenic factors River
rechargeStatistical data Accumulative Mining volume Statistical data Accumulative Aquifer hydraulic properties Permeability
coefficientEmpirical
parameterDistributive Specific yield Empirical
parameterDistributive Labeled data Content Classification type Water level: Rise or not Yes (1) No (0) Table 2. List of parameters for calculating and evaluating the effect of water level recovery from mining reduction in Baoding Plain
Evaluation area Area
/ km2Specific yield 2015 baseline recharge volume
/ 104 m32015 mining volume
/ 104 m32016 mining volume
/ 104 m32017 mining volume
/ 104 m32018 mining volume
/ 104 m3Plain area in Laishui County 263 0.20 18 423.13 7 495.30 7 042.9 6 806.9 5 968.3 Plain area in Yi County 190 0.18 34 126.67 11 551.00 1 0651 10 265 4 613 Zhuozhou 742 0.05 10 204.25 17 700.00 16 900 16 307 15 337 Dingxing County 707 0.08 8 875.71 17 218.00 16 756 16 462 15 688 Gaobeidian 672 0.08 10 058.09 12 034.00 11 644 11 276 10 714 Tang County 252 0.08 16 833.70 7 835.00 7 228 6 850 6 460 Shunping County 236 0.07 10 608.58 12 646.50 11 750 11 150 10 430 Mancheng district 294 0.10 10 681.52 8 700.00 8 100 7 690 7 011 Xushui district 727 0.08 8 991.97 13 628.00 12 535 12 640 10 320.2 Rongcheng County 316 0.10 3 546.99 7 950.00 7 502 7 306 / Baoding Downtown Area 315 0.15 3 407.75 5 845.85 4 325 4 684 4 631.8 Qingyuan district 863 0.14 11 139.53 20 510.00 19 339.43 18 232 17 055 Anxin County 726 0.10 9 459.80 8 186.00 7 711.01 7 613.03 / Quyang County 427 0.10 17 272.07 3 965.00 3 630 3 520 3 300 Wangdu County 374 0.08 6 055.51 10 144.45 9 422.38 8 792 8 178 Anguo 486 0.10 5 915.52 13 920.00 13 025 12 364 11 138.3 Boye County 340 0.08 3 994.77 8 522.00 7 840 7 393 6 953 Li County 644 0.10 8 759.29 9 100.00 8 420 7 900 7 242 Gaoyang County 487 0.08 5 634.43 8 100.00 7 550 7 003 6 620 Xiong County 524 0.05 6 244.85 8 578.00 7 986 7 901 / Whole city 9585 0.10 210 234.11 213 629.10 199 357.72 192 154.93 151 659.6 Table 3. List of parameters for calculating and evaluating the effect of water level recovery from mining reduction in Shijiazhuang Plain
Evaluation area Area/km2 Specific yield 2015 baseline recharge volume/
104 m32015 mining volume
/ 104 m32016 mining volume
/ 104 m32017 mining volume
/ 104 m32018 mining volume
/ 104 m3Downtown Area 429.4 0.12 8 132.224519 11 356 11 271 12 147 9 005 Xingtang 422.0 0.1 10 656.92124 6 889.25 6 940.25 7 693 7 831 Lingshou 128.3 0.12 3 236.08211 2 900.2 2 890 340 324 Luquan 267.7 0.12 5 032.648822 7 650 7 130.65 5 431 5 435 Yuanshi 315.5 0.1 6 102.918782 8 262.85 5 343.1 4 259 3 810 Gaoyi 222.0 0.1 3 609.209271 6 196.5 5 776.6 6 035 5 830 Zhao County 675.0 0.1 11 427.86402 19 523.65 19 050.2 19 190 18 679 Luancheng 354.0 0.1 6 742.877551 8 667.45 7 642.35 8 992 8 381 Gaocheng 813.0 0.07 13 344.11308 26 599.05 20 242.75 0 19 915 Jinzhou 619.0 0.1 6 196.16712 16 195.9 15 310.2 17 718 13 361 Shenze 301.0 0.1 6 173.60483 6 836.55 6 813.6 4 298 4 216 Wuji 500.0 0.18 8 697.156923 11 475 11 475 12 500 12 175 Zhengding 468.0 0.1 8 096.255698 16 260.5 15 130 9 663 7 268 Xinle 525.0 0.1 10 188.89672 14 477.2 14 108.3 15 853 14 395 Whole city 6990.9 0.1 106 807.0573 170 759.05 155 622.25 124 119 130 625 Table 4. Effective mining reduction and coefficients of recharge variation in the Baoding Plain from 2016 to 2018
Evaluation Area 2016 effective recovery of
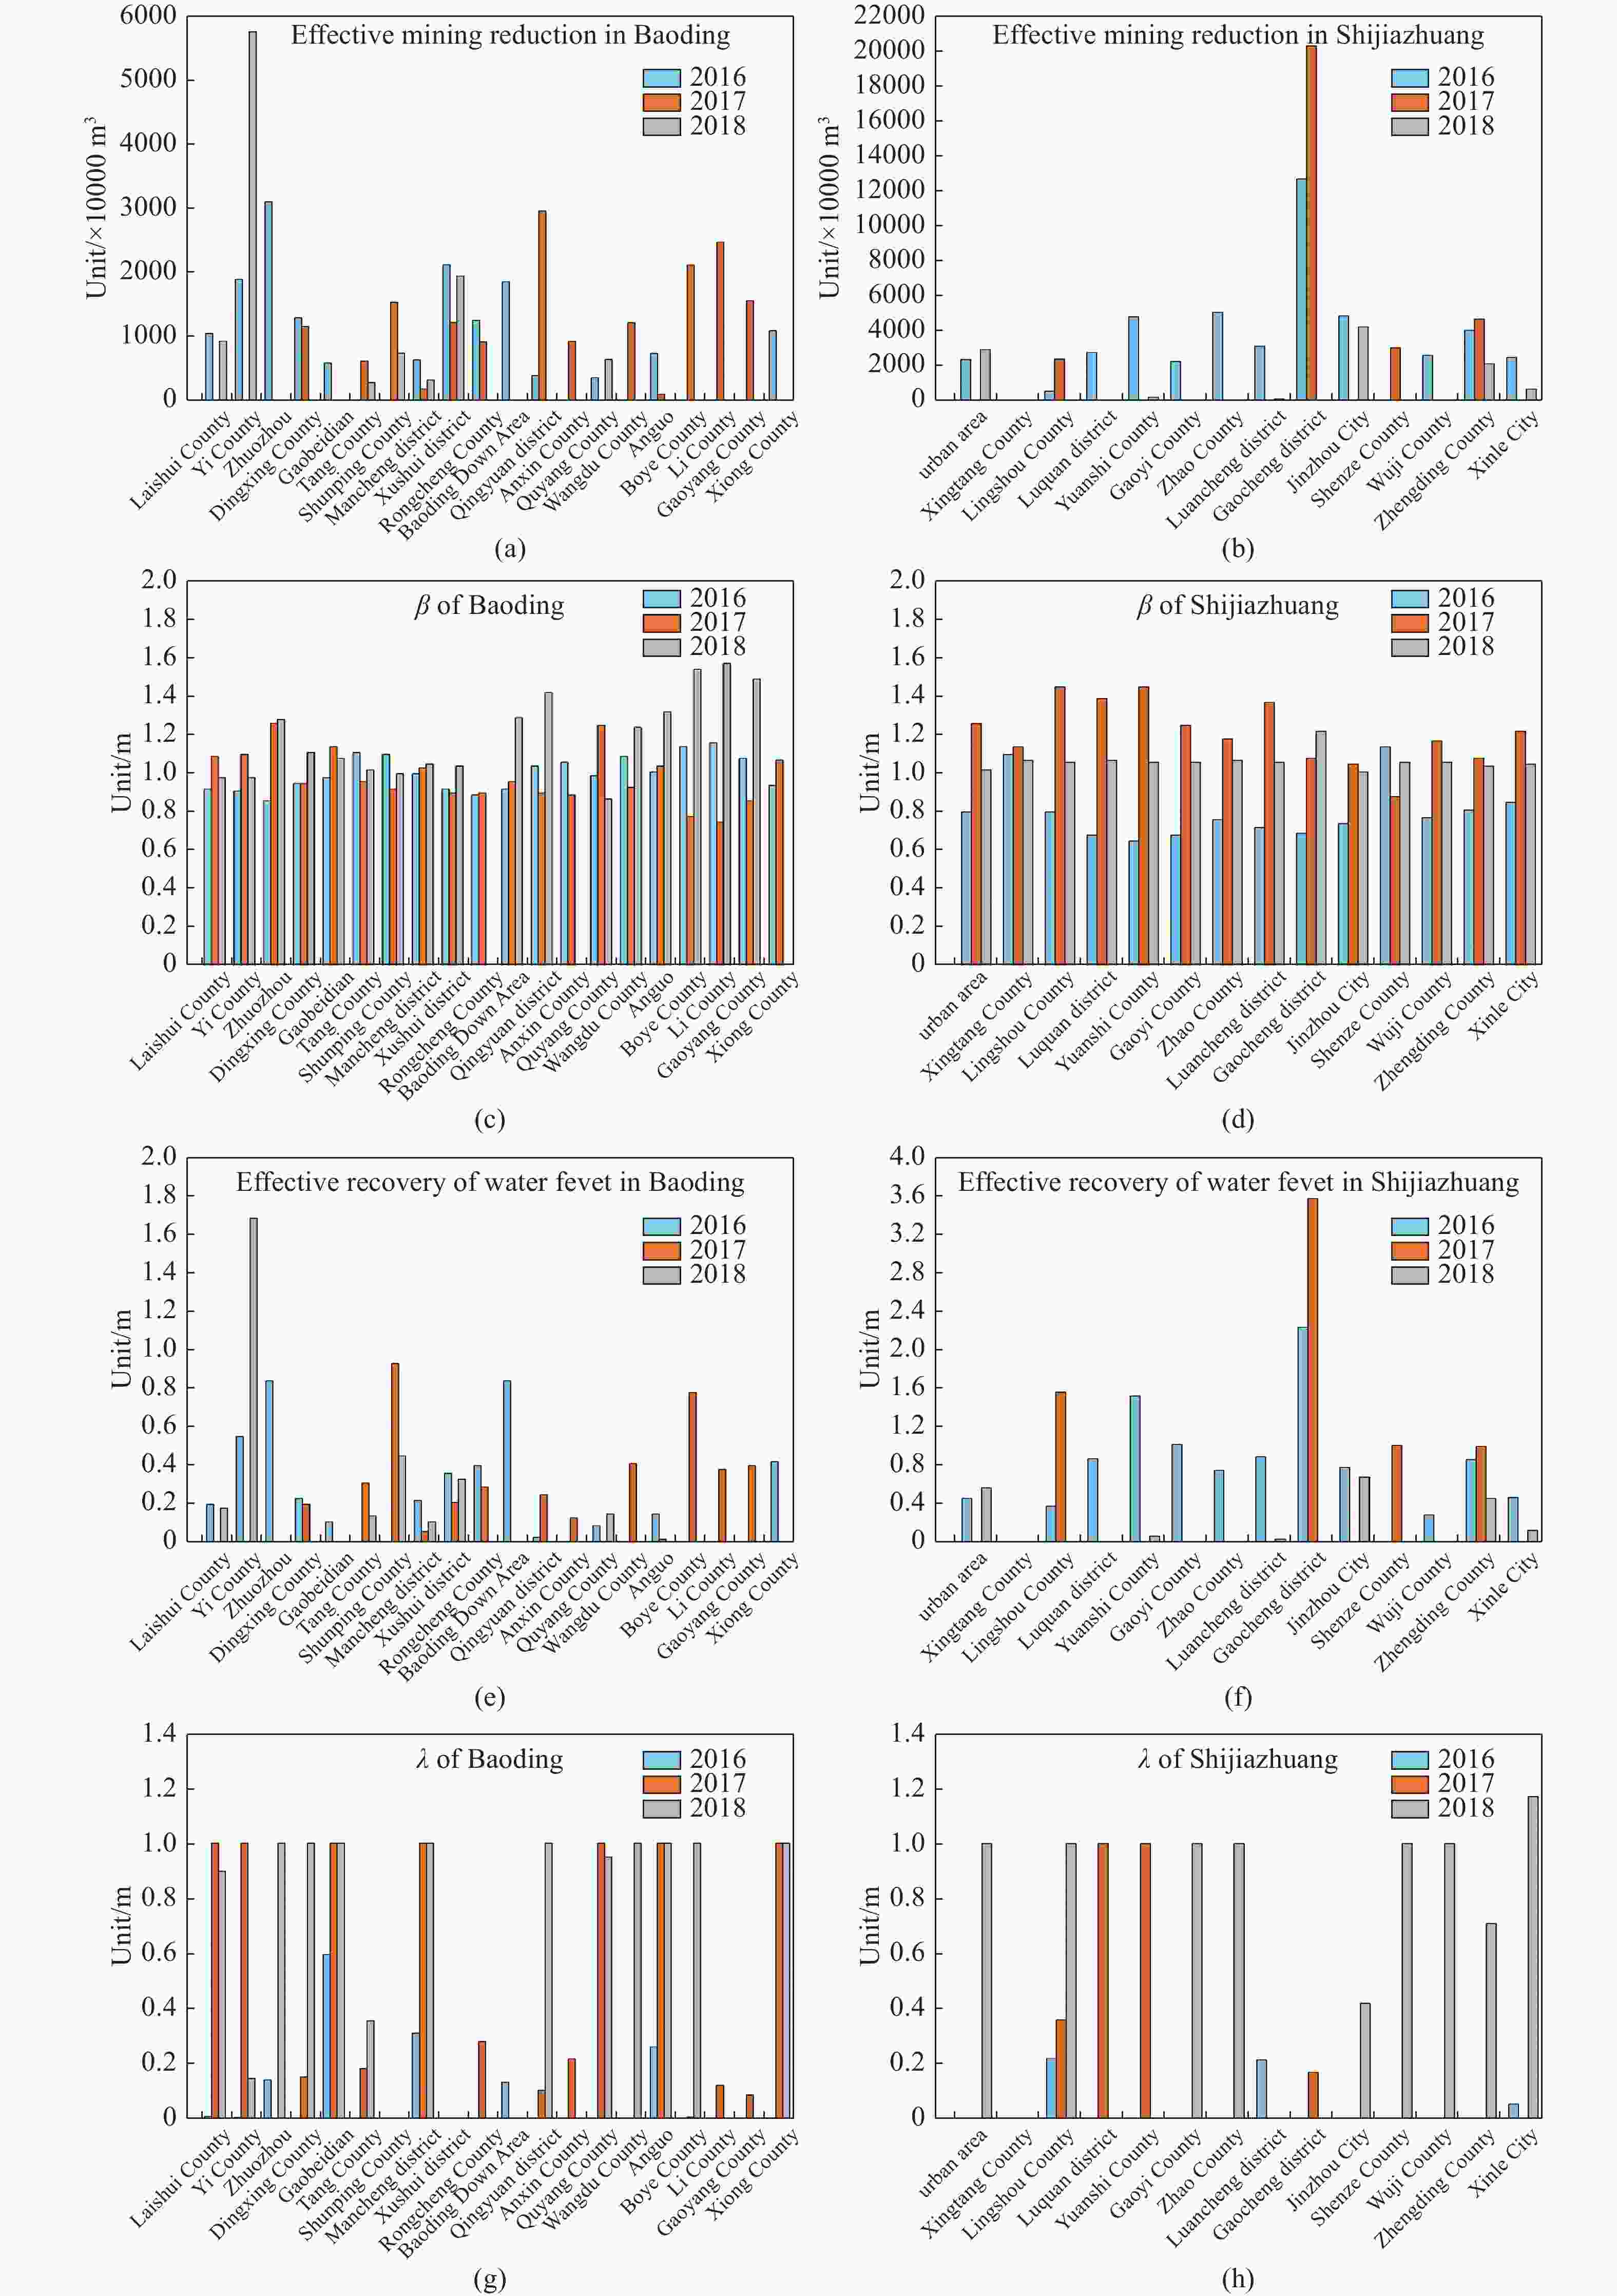
water level/ mλ/ % 2017effective recovery of water level/ m λ/ % 2018 effective recovery of water level/ m λ/ % Plain area in Laishui County 0.20 1.13 0.00 100.00 0.18 89.77 Plain area in Yi County 0.55 0.74 0.00 100.00 1.68 14.87 Zhuozhou 0.84 14.35 0.00 0.00 0.00 100.00 Dingxing County 0.23 0.00 0.20 15.45 0.00 100.00 Gaobeidian 0.11 59.61 0.00 100.00 0.00 100.00 Tang County 0.00 0.00 0.31 18.40 0.14 35.68 Shunping County 0.00 0.00 0.93 0.00 0.45 0.00 Mancheng district 0.22 31.27 0.06 100.00 0.11 100.00 Xushui district 0.36 0.00 0.21 0.00 0.33 0.00 Rongcheng County 0.40 0.00 0.29 28.24 0.00 0.00 Baoding Downtown Area 0.84 13.56 0.00 0.00 NA NA Qingyuan district 0.03 0.00 0.25 10.63 0.00 100.00 Anxin County 0.00 0.00 0.13 21.89 NA NA Quyang County 0.09 0.00 0.00 100.00 0.15 95.06 Wangdu County 0.00 0.00 0.41 0.00 0.00 100.00 Anguo 0.15 26.38 0.02 100.00 0.00 100.00 Boye County 0.00 0.00 0.78 0.95 0.00 100.00 Li County 0.00 0.00 0.38 12.42 0.00 0.00 Gaoyang County 0.00 0.00 0.40 8.93 0.00 NA Xiong County 0.42 0.00 0.00 100.00 NA 100.00 Whole city 0.17 8.98 0.18 16.19 0.13 57.98 Table 5. Effective mining reduction and coefficient of recharge variation in the Shijiazhuang Plain from 2016 to 2018
Evaluation area 2016 Effective mining reduction/ 104 m3 β 2017 Effective mining reduction/ 104 m3 β 2018 Effective mining reduction/ 104 m3 β Downtown Area 2377.515 849 0.80 0.00 1.26 2930.48 1.02 Xingtang 0 1.10 0 1.14 0 1.07 Lingshou 584.491 5118 0.80 2 398.682988 1.45 0 1.06 Luquan 2 780.984848 0.68 0 1.39 0 1.07 Yuanshi 4 801.894876 0.65 0 1.45 236.0331701 1.06 Gaoyi 2 257.20428 0.68 0 1.25 0 1.06 Zhao County 5 059.534095 0.76 0.00 1.18 0.00 1.07 Luancheng 3 135.757728 0.72 0.00 1.37 124.85 1.06 Gaocheng 12 671.69238 0.69 2 0242.75 1.08 0.00 1.22 Jinzhou 4 853.347933 0.74 0.00 1.05 4224.15 1.01 Shenze 0 1.14 3033.84 0.88 0.00 1.06 Wuji 2 612.186442 0.77 0.00 1.17 0.00 1.06 Zhengding 4 040.841819 0.81 4 669.576455 1.08 2 136.717389 1.04 Xinle 2 493.067936 0.85 0.00 1.22 698.00 1.05 Whole city 47 668.52 0.78 30 344.85 1.17 10 350.24 1.07 Table 6. Effective water level restoration by reduction of mining and effective recovery of water level in Shijiazhuang Plain from 2016 to 2018
Evaluation area 2016 effective restoration of water level/ m λ/ % 2017 effective restoration of water level/ m λ/ % 2018 effective restoration of water level/ m λ/ % Downtown Area 0.46 0.00 0.00 0.00 0.57 100.00 Xingtang 0.00 0.00 0.00 0.00 0.00 0.00 Lingshou 0.38 22.10 1.56 36.00 0.00 100.00 Luquan 0.87 0.00 0.00 100.00 0.00 0.00 Yuanshi 1.52 0.00 0.00 100.00 0.07 0.00 Gaoyi 1.02 0.00 0.00 0.00 0.00 100.00 Zhao County 0.75 0.00 0.00 0.00 0.00 100.00 Luancheng 0.89 21.47 0.00 0.00 0.04 0.00 Gaocheng 2.23 0.00 3.56 17.00 0.00 0.00 Jinzhou 0.78 0.00 0.00 0.00 0.68 42.00 Shenze 0.00 0.00 1.01 0.00 0.00 100.00 Wuji 0.29 0.00 0.00 0.00 0.00 100.00 Zhengding 0.86 0.00 1.00 0.00 0.46 71.00 Xinle 0.47 5.42 0.00 0.00 0.13 117.00 Whole city 0.79 1.97 0.50 22.00 0.17 76.00 Table 7. Comparison of 2016 water level restoration calculation results and simulation results in Baoding Plain
Evaluation area 2016 effective water level restoration/ m 2016 restoration calculated by model/ m Plain area in Laishui County 0.20 0.070 Plain area in Yi County 0.55 0.100 Zhuozhou 0.84 0.660 Dingxing County 0.23 0.170 Gaobeidian 0.11 0.180 Tang County 0.00 0.070 Shunping County 0.00 0.050 Mancheng district 0.22 0.180 Xushui district 0.36 0.290 Rongcheng County 0.40 0.330 Baoding Downtown Area 0.84 0.650 Qingyuan district 0.03 0.020 Anxin County 0.00 0.002 Quyang County 0.09 0.001 Wangdu County 0.00 0.001 Anguo 0.15 0.000 Boye County 0.00 0.000 Li County 0.00 0.000 Gaoyang County 0.00 0.000 Xiong County 0.42 0.390 Whole city 0.17 0.150 -
Ashaolu E, Omotosho O. 2015. Assessment of static water level and overburden pattern for sustainable groundwater development and management in Ilorin City, Nigeria. Malaysian Journal of Society and Space, 11: 1−11. Breiman L. 2001. Random forests. Machine Language, 45(1): 5−32. DOI: 10.1023/A:1010933404324. Cao WG, Yang HF, Gao YY, et al. 2020. Prediction of groundwater quality evolution in the Baoding Plain of the SNWDP benefited regions. Journal of Hydraulic Engineering, 51(8): 924−935. (in Chinese) DOI: 10.13243/j.cnki.slxb.20200035. Chen F, Hou J, Y LL, et al. 2016. Analysis of groundwater overdraft treatment in China. Water Conservancy Planning and Design, 11: 3−7. (in Chinese) DOI: 10.3969/j.issn.1672-2469.2016.11.002. Chi GY, Su XS, Lyu H, et al. 2021. Simulating the shallow groundwater level response to artificial recharge and storage in the plain area of the Daqing River Basin, China. Sustainability, 13(10): 5626. DOI: 10.3390/su13105626. Ding YY, Chen F, Li YY, et al. 2020. Compiling background and ideas of the action plan for comprehensive treatment of groundwater over-exploitation in North China. China Water Resources, (13): 22−25. (in Chinese) DOI: 10.3969/j.issn.1000-1123.2020.13.016. Hu LT, Xu ZX, Huang WD. 2016. Development of a river-groundwater interaction model and its application to a catchment in Northwestern China. Journal of Hydrology, 543: 483−500. DOI: 10.1016/j.jhydrol.2016.10.028. Hua SS, Zheng CM. 2018, Study on the dynamic change of land water reserves in China under the urbanization and climate change. China City Environmental Science Society Annual Conference of Science and Technology. (in Chinese) Ji ZJ, Cui YL, Zhang SQ, et al. 2021. Evaluation of the impact of ecological water supplement on groundwater restoration based on numerical simulation: A case study in the section of Yongding River, Beijing plain. Water, 13(21): 3059. DOI: 10.3390/w13213059. Jia SF, Li YY, Lyu AF, et al. 2016. Estimation of excess pumping of shallow groundwater aquifer in Haihe Plain. South-to-North Water Transfers and Water Science & Technology, 14(4): 1−7,71. (in Chinese) DOI: 10.13476/j.cnki.nsbdqk.2016.04.001. Jing H, HE X, Cao GL, Zheng CM, et al. 2018. Numerical simulation and sensitivity analysis of underground water pressure in North China Plain. 2018 proceedings of the Chinese Academy of Environmental Sciences Annual Meeting of Science and Technology (Vol. third). (in Chinese) Kitanidis PK. 2015. Persistent questions of heterogeneity, uncertainty, and scale in subsurface flow and transport. Water Resources Research, 51(8): 5888−5904. DOI: 10.1002/2015wr017639. Koch J, Berger H, Henriksen HJ, et al. 2019. Modelling of the shallow water table at high spatial resolution using random forests. Hydrology and Earth System Sciences, 23(11): 4603−4619. DOI: 10.5194/hess-23-4603-2019. Lai DR, Qin HH, Wan W, et al. 2018. Scenario analysis on water resources utilization of the North China Plain based on MIKE SHE model. Journal of Water Resources and Water Engineering, 29(5): 60−67. (in Chinese) DOI: 10.11705/j.issn.1672-643X.2018.05.10. Li H, Ding YY, Li YY, et al. 2019. Analysis of status quo and problems of water conservation in China in new situation. South-to-North Water Transfers and Water Science & Technology, 17(1): 202−208. (in Chinese) DOI: 10.13476/j.cnki.nsbdqk.2019.0027. Li LL, Zhou ZC, Shao JL, et al. 2021. Advances in groundwater numerical simulation in deep geological disposal of high-level radioactive waste. Hydrogeology & Engineering Geology, 48(6): 13−23. (in Chinese) DOI: 10.16030/j.cnki.issn.1000-3665.202010061. Liang XZ. 2022. Extreme rainfall slows the global economy. Nature, 601(7892): 193−194. DOI: 10.1038/d41586-021-03783-x. Liu Q, Gui DW, Zhang L, et al. 2022. Simulation of regional groundwater levels in arid regions using interpretable machine learning models. Science of the Total Environment, 831: 154902. DOI: 10.1016/j.scitotenv.2022.154902. Liu ZF, Wang LL, Lin HX. 2015. Optimization of underground water pressure alternative water source scheme in receiving water area of South to North Water Diversion Project in Jining. Water Conservancy Planning and Design, 2: 31−34. (in Chinese) DOI: 10.3969/j.issn.1672-2469.2015.02.011. Lunzer JJ. 2019. Using groundwater modeling to assess groundwater and stream connectivity in a river restoration application. M. S. thesis. Montana Tech of The University of Montana. Ma Sh. 2019. Study on underground water pressure recovery plan and effect in Tianjin plain area. M. S. thesis. Tianjin: Tianjin Agricultural University. (in Chinese) Ma YJ. 2016. Exploitation and protection of groundwater resources in the North China Plain. Natural Science (Abstract), 4: 467−641. (in Chinese) Ministry of Water Resources of Baoding City. Baoding water resources bulletin 2016-2018. Ministry of Water Resources of Shijiazhuang City. Shijiazhuang water resources bulletin 2016-2018. Nan T, Cao WG. 2023. Effect of ecological water supplement on groundwater restoration in the Yongding River based on multi-model linkage. Water, 15(2): 374. DOI: 10.3390/w15020374. Shao JL, Li L, Cui YL, et al. 2013. Groundwater flow simulation and its application in groundwater resource evaluation in the North China plain, China. Acta Geologica Sinica—English Edition, 87(1): 243−253. DOI: 10.1111/1755-6724.12045. Wakode HB, Baier K, Jha R, et al. 2018. Impact of urbanization on groundwater recharge and urban water balance for the city of Hyderabad, India. International Soil and Water Conservation Research, 6(1): 51−62. DOI: 10.1016/j.iswcr.2017.10.003. Wang DC. 1986. Foundation of hydrogeology. Beijing: Geology Press Geological Publishing House. Wang SQ, Shao JL, Song XF, et al. 2008. Application of MODFLOW and geographic information system to groundwater flow simulation in North China Plain, China. Environmental Geology, 55(7): 1449−1462. DOI: 10.1007/s00254-007-1095-x. Wang XH, Liu TL, Zheng XL, et al. 2018. Short-term prediction of groundwater level using improved random forest regression with a combination of random features. Applied Water Science, 8(5): 125. DOI: 10.1007/s13201-018-0742-6. Xu Y, Gong H, Chen B, et al. 2021. Long-term and seasonal variation in groundwater storage in the north china plain based on grace. International Journal of Applied Earth Observation and Geoinformation, 104: 102560. DOI: 10.19637/j.cnki.2305-7068.2022.02.002. Zhang ML, Hu LT, Yao LL, et al. 2018. Numerical studies on the influences of the South-to-North Water Transfer Project on groundwater level changes in the Beijing Plain, China. Hydrological Processes, 32(12): 1858−1873. DOI: 10.1002/hyp.13125. -

 E-mail alert
 Rss
Rss


 下载:
下载:
