 E-mail alert
 Rss
Rss

-
Abstract: Over the years, the Shaying River Basin has experienced frequent instances of river pollution. The presence of numerous critical pollutant discharge enterprises and sewage-treatment plants in the vicinity of the Shaying River has transformed it a major tributary with relatively serious pollution challenge within the upper reaches of Huaihe River Basin. To study the sources of manganese (Mn), chromium (Cr), nickel (Ni), arsenic (As), cadmium (Cd) and lead (Pb) in Shaying River water, 123 sets of surface water samples were collected from 41 sampling points across the entire basin during three distinct phases from 2019 to 2020, encompassing normal water period, dry season and wet season. The primary origins of heavy metals in river water were determined by analyzing the heavy metal contents in urban sewage wastewater, industrial sewage wastewater, groundwater, mine water, and the heavy metal contributions from agricultural non-point source pollution. The analytical findings reveal that Mn primarily originates from shallow groundwater used for agricultural irrigation, While Cr mainly is primarily sourced from urban sewage treatment plant effluents, coal washing wastewater, tannery wastewater, and industrial discharge related to metal processing and manufacturing. Ni is mainly contributed by urban sewage treatment plant effluents and industrial wastewater streams associated with machinery manufacturing and metal processing. Cd primarily linked to industrial wastewater, particularly from machinery manufacturing and metal processing facilities, while Pb is predominantly associated with urban sewage treatment plant effluents and wastewater generated in Pb processing and recycling wastewater. These research provides a crucial foundation for addressing the prevention and control of dissolved heavy metals at their sources in the Shaying River.
-
Key words:
- Industrial waste /
- Urban sewage /
- Mine water /
- Agricultural non-point source pollution
-
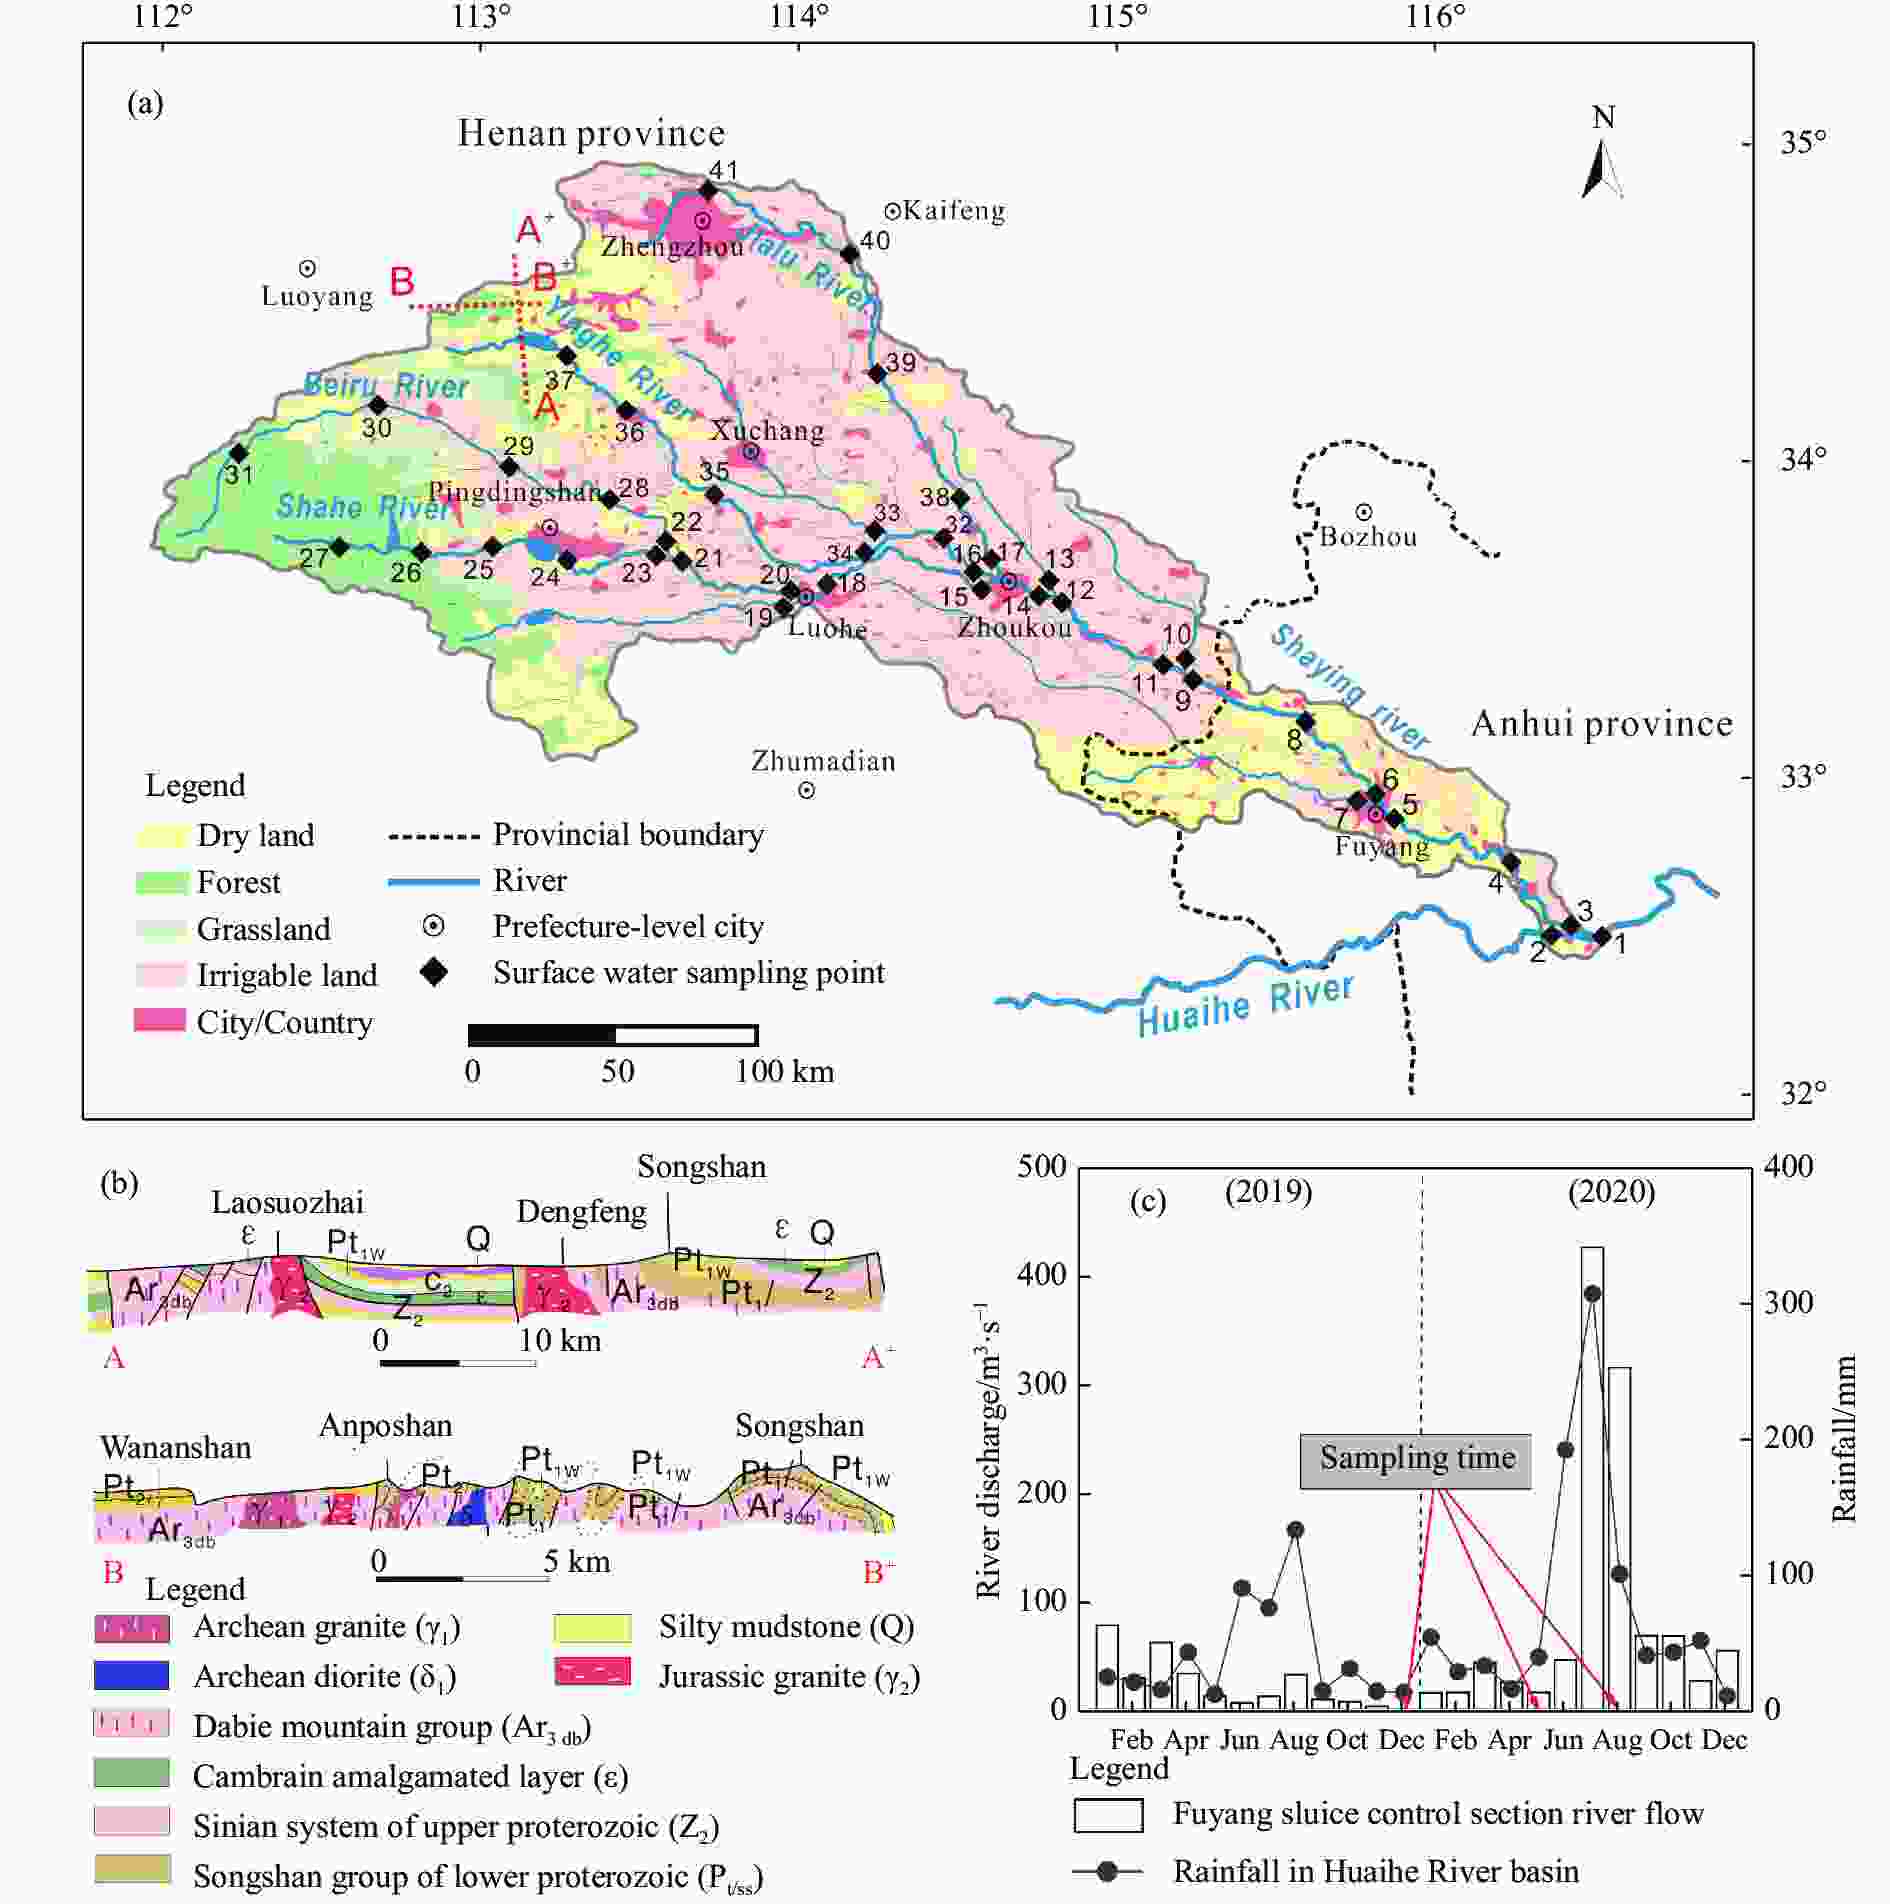
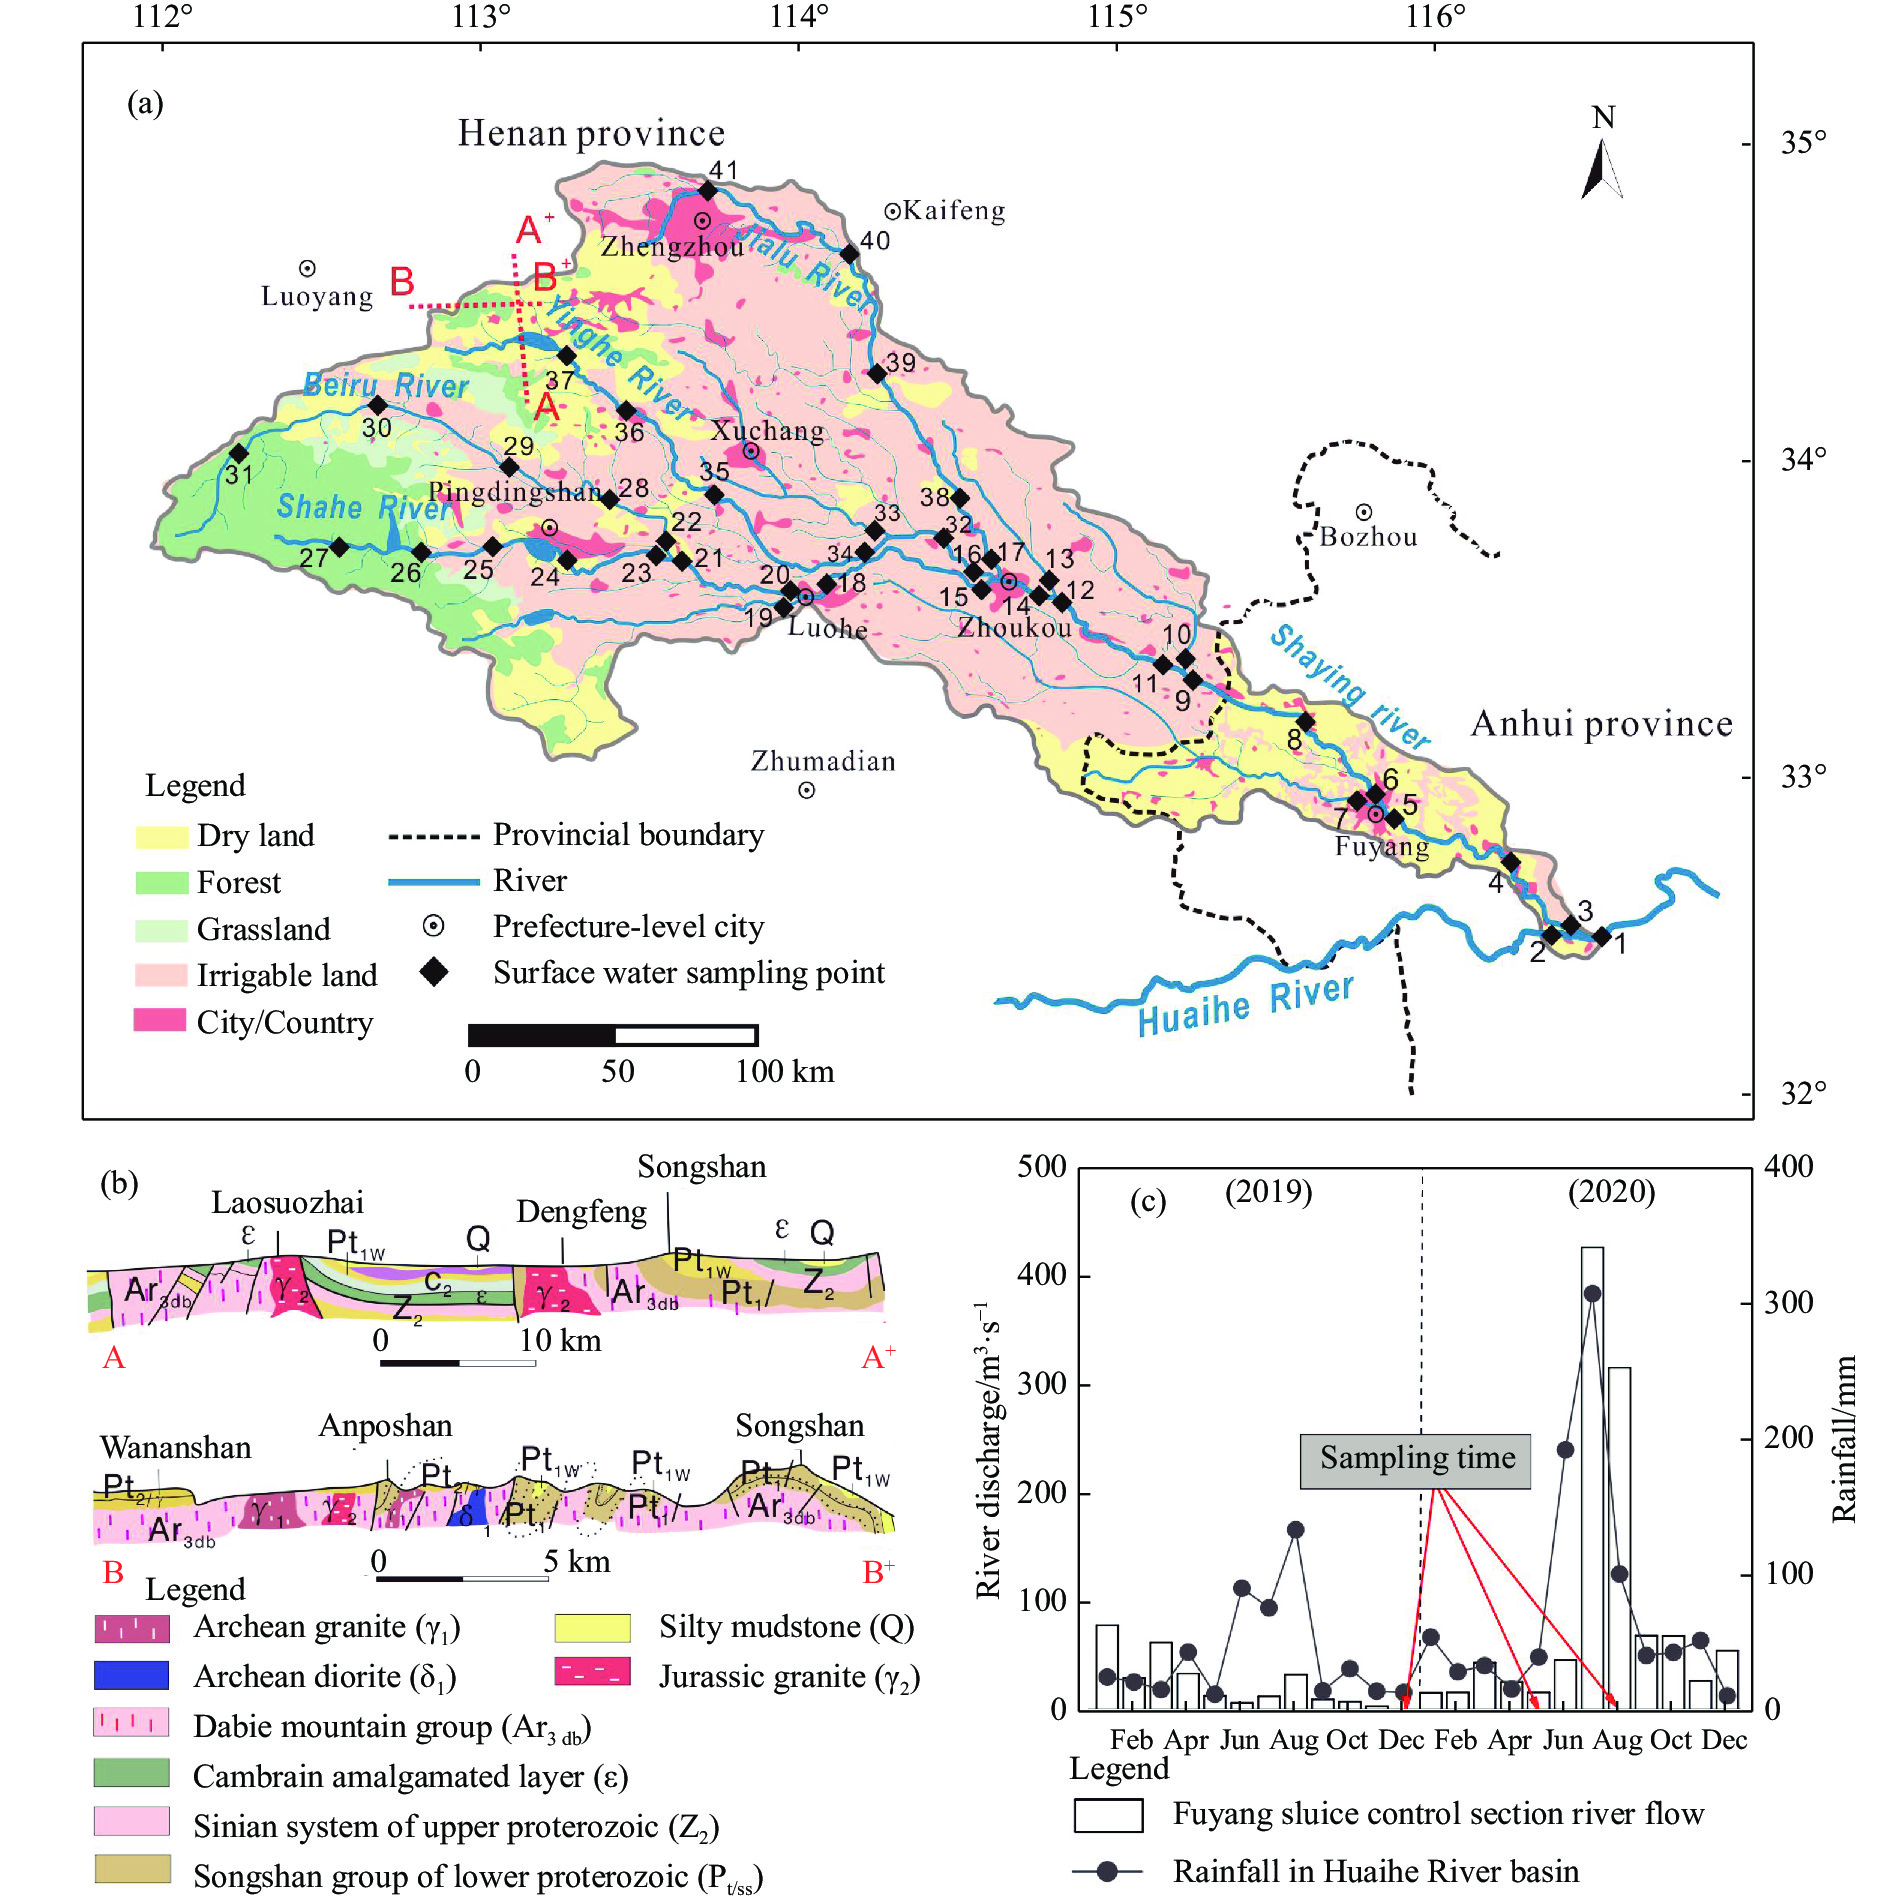
Figure 1. a. Distribution of sampling points in the Shaying River Basin; b. Geological profile; c. Rainfall and river flow chart from Fuyang hydrologic station
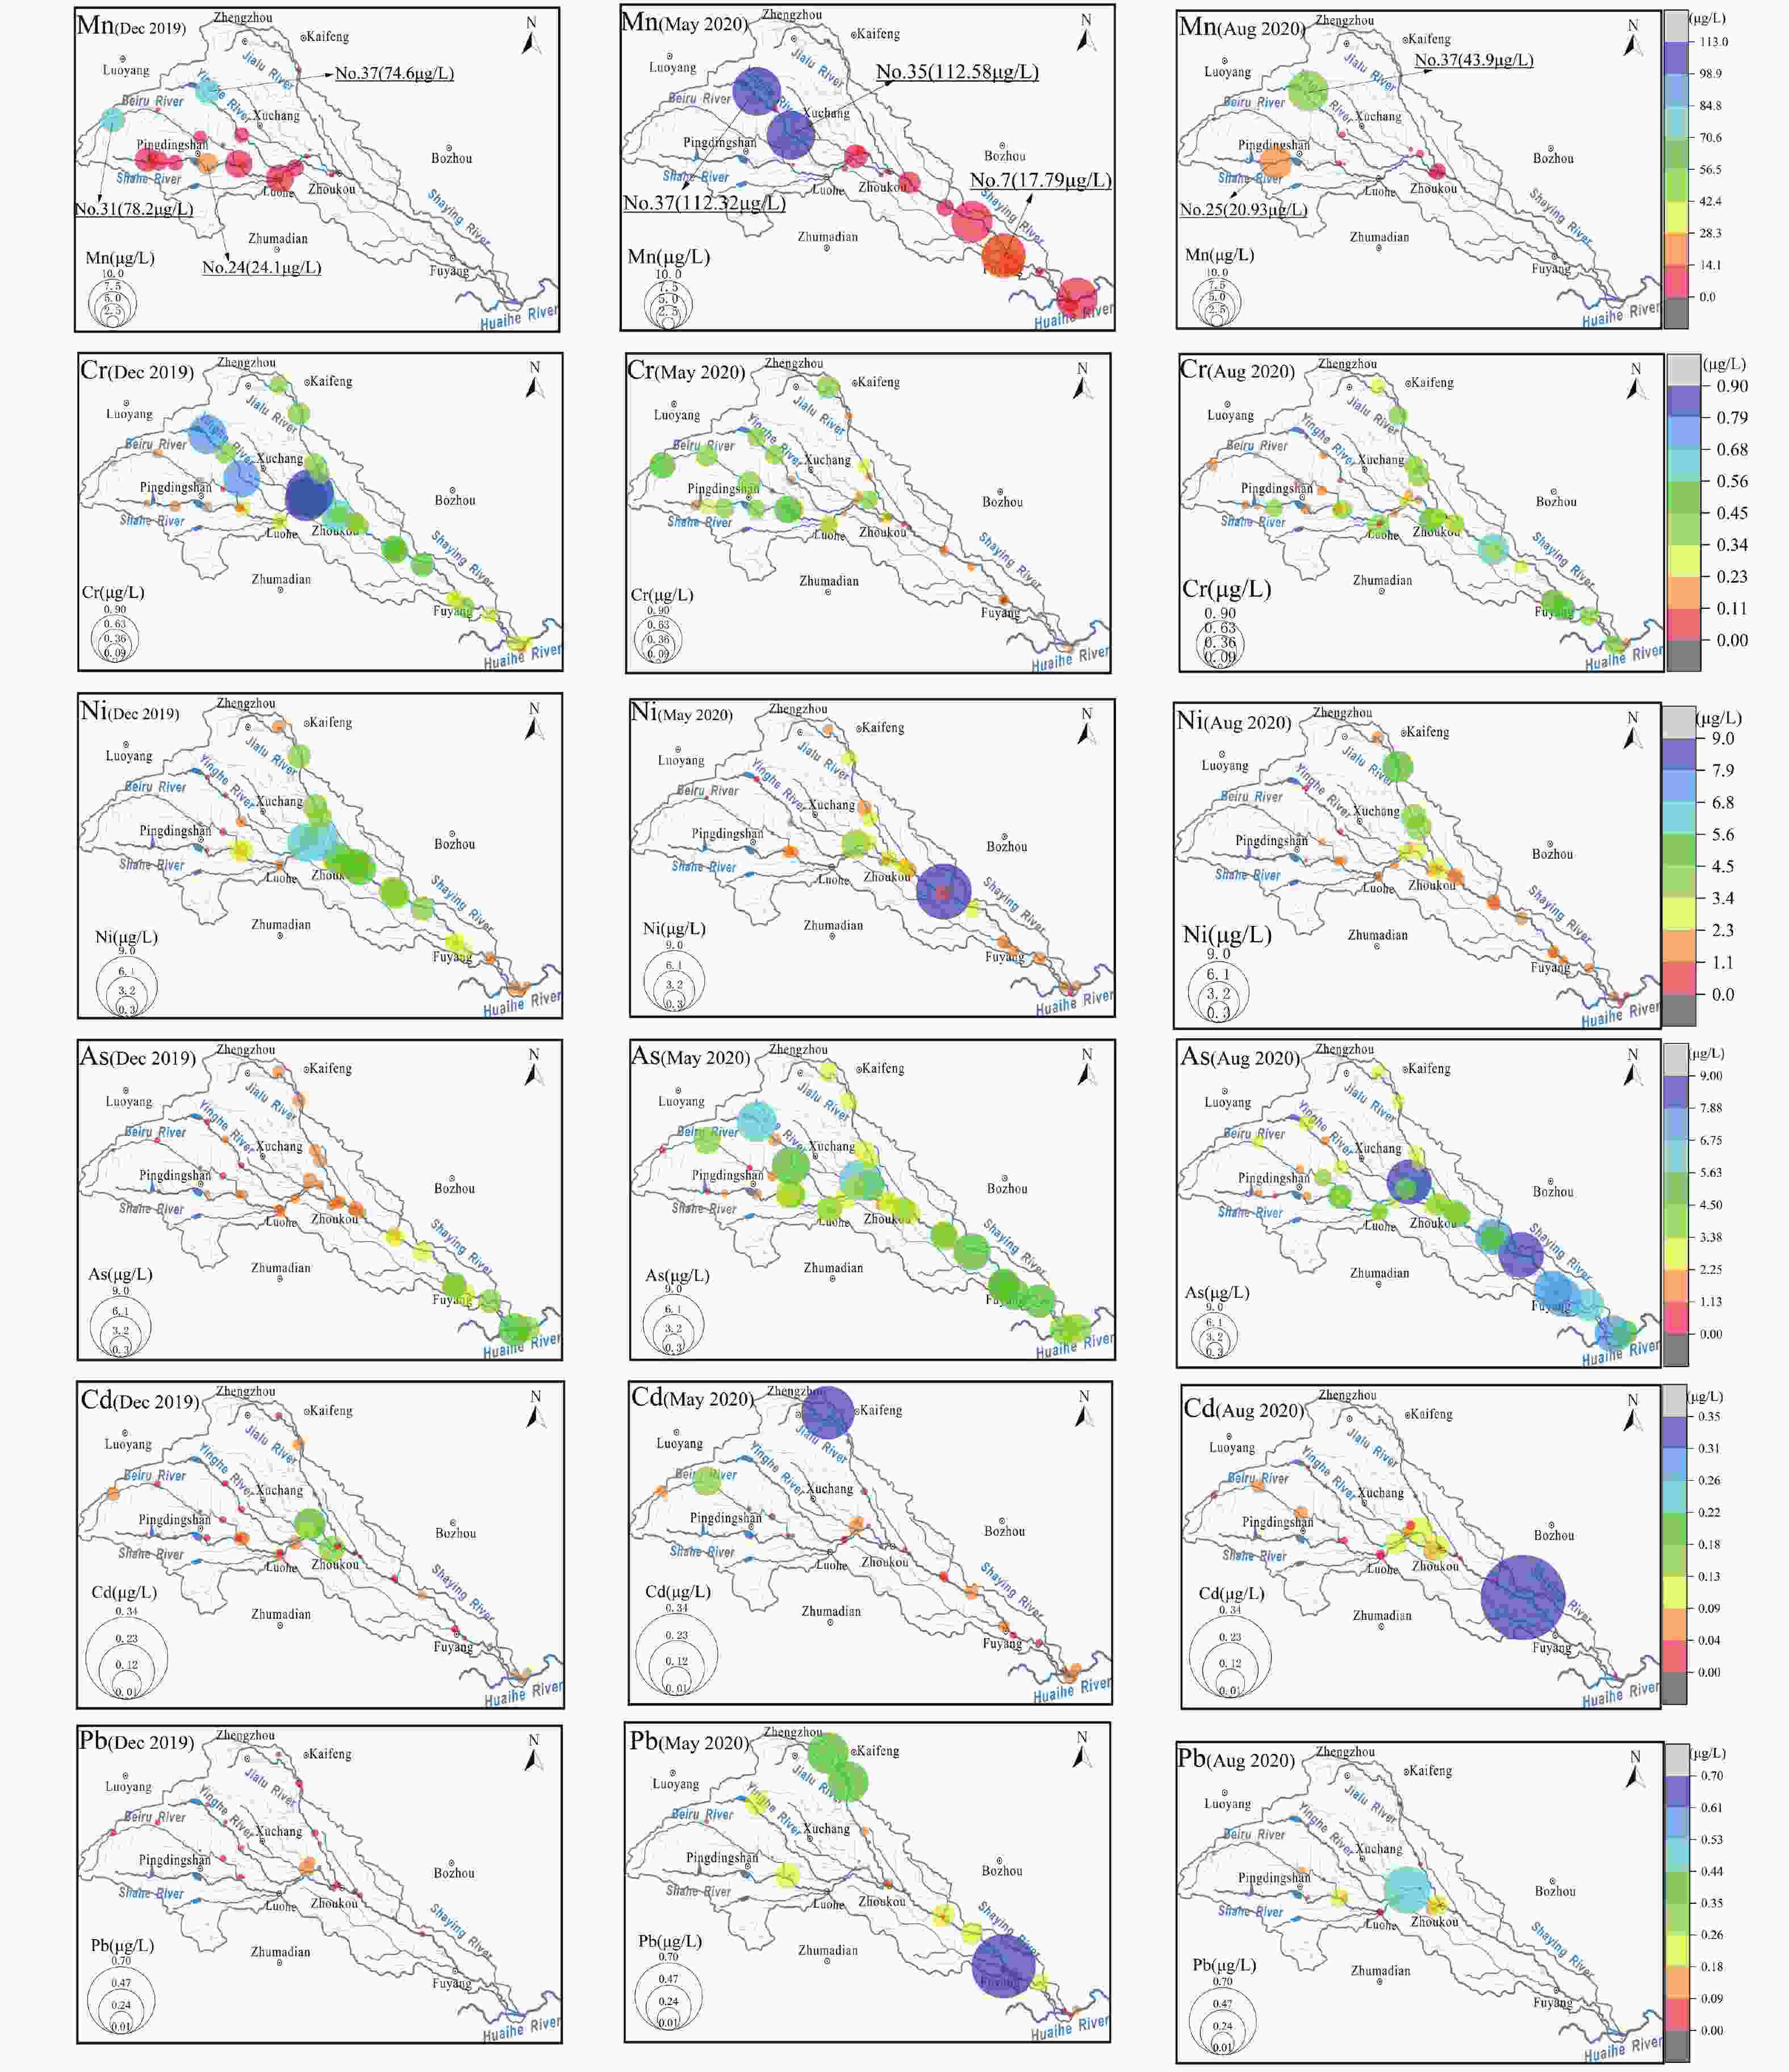
Figure 2. Spatial-temporal distribution of heavy metal concentrations in the Shaying River Basin
Table 1. The average heavy metal concentrations in river water of the Shaying River Basin at different time periods
Date Cr Mn Cd Ni As Pb Data source μg·L−1 The Shaying River Basin December 2018 0.38 56.82 0.14 0.95 2.87 0.96 Chu, 2001 December 2019 0.34 5.58 0.04 2.44 1.83 0.04 this study May 2020 0.23 7.54 0.03 1.62 3.33 0.10 this study August 2020 0.27 2.12 0.04 1.58 3.90 0.05 this study Category III in Environmental Quality Standard for Surface Water 50 100 5 20 50 50 GB 3838—2002  下载: 导出CSV
Table 2. Test results of heavy metal concentration in the Shaying River Basin
Items Normal season (December 2019) Dry season (May 2020) Wet season (August 2020) AVG S.D. MIN MAX AVG S.D. MIN MAX AVG S.D. MIN MAX μg·L−1 River water Cr 0.34 0.19 0.07 0.90 0.23 0.13 0.09 0.52 0.27 0.12 0.09 0.60 Mn 5.58 16.49 0.05 78.21 7.54 24.29 0.13 112.58 2.12 7.43 0.08 43.9 Cd 0.04 0.02 0.01 0.13 0.03 0.04 0.00 0.22 0.04 0.06 0.01 0.35 Ni 2.44 1.57 0.18 5.90 1.62 1.41 0.00 8.24 1.58 0.95 0.30 4.59 As 1.83 1.02 0.01 4.81 3.33 1.43 0.30 6.04 3.90 2.08 0.52 8.84 Pb 0.04 0.03 0.00 0.16 0.10 0.14 0.00 0.66 0.05 0.08 0.00 0.49 Note: AVG: Average; SD: Standard deviation; MIN: Minimum; MAX: Maximum
下载: 导出CSV
Table 3. Concentrations of heavy metals and relevant water environment quality standards in different river basins
Data in relevant water basin Cr Mn Cd Ni As Pb Data sources μg·L−1 Chaohu Lake Basin 0.48 22.89 5.8 2.62 — 1.34 Wu et al. 2018 Taihu Lake Basin — — 0.93 — 9.87 45.88 Wang, 2016 Jiulongjiang River Basin 5.41 — 0.08 3.99 12.39 4.47 Chen et al. 2018 Middle and lower reaches of the Han River in the dry season — 17.35 0.00 — 0.07 0.54 Wang et al. 2019 Middle and lower reaches of the Han River in the wet season — 16.88 0.00 — 2.88 0.35 Wang et al. 2019 The Shaying River Basin 2018 0.38 56.82 0.14 0.95 2.87 0.96 Ding et al. 2019 December 2019 0.34 5.58 0.04 2.44 1.83 0.04 this study May 2020 0.23 7.54 0.03 1.62 3.33 0.10 this study August 2020 0.27 2.12 0.04 1.58 3.90 0.05 this study Category III in Environmental Quality Standard for Surface Water 50 100 5 20 50 50 GB 3838—2002
下载: 导出CSV
Table 4. List of soluble metal concentrations monitored by enterprises in the Shaying River Basin
Rivers Administrative districts Categories of pollutant discharging enterprises Enterprise quantity Enterprise scale The concentration of soluble heavy metal discharge/μg·L−1 Monitoring date Mn Cr Ni As Cd Pb Jialu River Xingyang Pharmacy production 1 Middle scale, Type II 14 31/3/2021-14/3/2022 Printing equipment manufacturing 1 Middle scale, Type II 15-86 26/2/2021-14/3/2022 Wastewater treatment 3 Small scale 4-15 0.05-0.8 0.4-4 1-12 26/1/2021-7/12/2022 Zhengzhou Municipal District Wastewater treatment 8 3 large scale, Type II, 3 middle scale, Type I, 2 small scale 16-80 0.3-1.3 1-2 1-50 1/1/2021-22/12/2022 Zhongmu Wastewater treatment 1 Small scale ND 2-2.1 20-21 15/1/2021-11/12/2022 Automobile parts manufacturing 1 Large scale, Type II 60-230 1/1/2021-31/12/2022 Weishi Wastewater treatment 2 1 large scale, Type II, 1 small scale. 0.24-40 0.4-30 0.05-3.9 0.09-13 14/1/2021-9/12/2022 Tannery 1 Middle scale, type I 0.35-0.4 4/4/2021-5/9/2021 Fugou Wastewater treatment 2 Small scale ND 0.4-1.52 2-6 ND 2/3/2021-1/12/2021 Xihua Tannery 1 Small scale 15-950 19/1/2021-22/4/2022 Ying River Xinmi Electroplating plants 1 Middle scale, Type II 30-190 2/1/2021-31/12/2022 Wastewater treatment 2 1 middle scale, Type I,1 middle scale, Type II 12-24 0.15-0.5 0.25-4 1.25 13/1/2022-7/7/2022 Xinzheng Wastewater treatment 2 1 middle scale, Type I, 1 small scale. ND ND ND ND 14/1/2021-7/12/2022 Coal mining 1 Large scale, Type II ND 3-4 1-8 6/1/2021-5/12/2022 Dengfeng Wastewater treatment 1 Middle scale, Type I 4-30 0.3-1 0.8-30 1-50 2/3/2021-/810/2022 Jian'an Wastewater treatment 2 1 middle scale, Type I, 1 small scale 4-6 0.8-3.7 0.1-0.2 2-8 18/1/2020-8/10/2022 Coal mining and washing 1 Large scale, Type II 15-910 0.5-80 0-5 0-200 21/1/2021-9/10/2022 Yanling Wastewater treatment 1 Middle scale, Type I 3-12 2-52 1-5 3-4 24/9/2021-18/1/2022 Yuzhou Wastewater treatment 3 Small scale 0-18 0-0.3 0-1 0-10 5/1/2021-6/12/2022 Coal mining and washing 1 Large scale, Type II 80-210 50-95 0.3-350 1 0-10 12/1/2021-7/3/2022 Changge Tannery 1 Middle scale, Type II 70-102 13/5/2021-21/12/2022 Wastewater treatment 2 Small scale 4-7 ND 2.3-4.5 0.1-0.2 1-10 31/3/2021-4/11/2022 Linying Wastewater treatment 2 Small scale 0.01-0.03 0.05-0.021 0.5-1 1-13 14/1/2021-1/12/2022 Xihua Wastewater treatment 1 Small scale ND ND ND ND 19/1/2021-20/10/2022 Beiru River Ruyang Wastewater treatment 2 Small scale 38-53 1-6.2 0.1-2.8 1-15.3 1/1/2021-21/12/2022 Ruzhou Wastewater treatment 1 Middle scale, Type I 0.3-30 0-1 0-10 14/3/2021-16/9/2022 Jiaxian Wastewater treatment 2 Small scale 0.4-0.6 0-4 0-7 23/1/2021-8/11/2022 Xiangcheng Wastewater treatment 3 2 small scale 36-51 0.3 1-5 10-20 1/1/2021-29/11/2022 Sha River Lushan Wastewater treatment 3 Middle scale, Type II ND ND ND 5/1/2021-23/12/2022 Yexian Wastewater treatment 1 Small scale ND ND ND 8/1/2021-1/12/2022 Shilong Wastewater treatment 1 Small scale ND ND ND 18/1/2021-2/4/2021 Pingdingshan municipal district Wastewater treatment 4 Middle scale, Type I 0-19 0.7-46.3 0.4-16.2 1-844 8/1/2021-10/10/2022 Luohe municipal district Wastewater treatment 6 1 middle scale, Type I, 4 middle scale, Type II, 1 small scale 4-92 0.1-30 20 0.1-30 0.3-2.5 0.2-90 2/1/2021-24/12/2022 Shangshui Wastewater treatment 2 Middle scale, Type II 20-100 0.3-0.8 0.025-2 30-90 30/1/2021-31/12/2022 Xiangcheng Tannery 5 4 middle scale, Type II, 1 small scale 30-149 20/1/2021-31/12/2022 Wastewater treatment 1 Small scale ND 0-0.4 0-8 40 20/1/2021-9/12/2022 Jieshou Lead processing and recycling 7 39-44 3.8-4.3 7.1-8.9 59-80 Q4 2021 Taihe Metal processing and recycling 4 3.2-25 50-90 1.1-5 0.1-18 3-70 1/7/2020-19/4/2021 Fuyang municipal district Metal processing and recycling 3 3-80 Note: 1) The data is from the enterprise self-monitoring platform of the Ecological Environment Department in Henan Province and Anhui Province;2) ND represents a test indicator not detected.
下载: 导出CSV
-
Bao FQ, Cheng HX, Yong S, et al. 2022. Environmental geochemistry of arsenic and cadmium in cultivated land around Baotou industrial zone. Geology and resources, 31(04): 516−522+507. (in Chinese) DOI: 10.13686/j.cnki.dzyzy.2022.04.008. Bhardwaj R, Gupta A, Garg JK. 2017. Evaluation of heavy metal contamination using environmetrics and indexing approach for River Yamuna, Delhi stretch, India. Water Science, 31(1): 52−66. DOI: 10.1016/j.wsj.2017.02.002. Bhupal RG, Chandni P, Surendra B, et al. 2014. Heavy metal contamination in soil, water, fodder, paddy and some popular vegetables due to polluted Musi River irrigation around Hyderabad City in Telangana State of India. International Scientific Academy of Engineering and Technology (ISAET) Conference Proceeding. International Institute of Science Engineering and Management, International Scientific Academy of Engineering and Technology: International Scientific Academy of Engineering and Technology. Chen H, Zuo QT, Dou M. et al. 2014. Research progress and prospects of heavy metal pollution in river sediment. Yellow River, 36(5): 71-75. (in Chinese) Chen NW, Wang DL, Lu T, et al. 2018. Manganese pollution in the Jiulong River watershed: Sources and transformation. Acta Scientiae Circumstantiae, 38(08): 2955−2964. (in Chinese) DOI: 10.13671/j.hjkxxb.2018.0232. Christian O, Jens H, Nina Z. 2015. Heavy metal concentrations in pores and surface waters during the emptying of a small reservoir. Journal of Geoscience and Environment Protection, 3: 66-72. Chu JT. 2001. Effect of Shaying River flow and water quality on Huaihe River pollution. Water Resources Protection, (03): 4-7 + 59. (in Chinese) Dai B, Lv JS, Zhan JC. et al. 2015. Assessment of sources, spatial distribution and ecological risk of heavy metals in soils in a typical industry-based city of Shandong Province, Eastern China. Environmental Science, 36(02): 507−515. (in Chinese) DOI: 10.13227/j.hjkx.2015.02.018. Ding TT, Li Q, Du SL, et al. 2019. Characteristics of heavy metal pollution and ecological risk assessment in the water environment of Shaying River Basin. Environmental Chemistry, 38(10): 2386−2401. (in Chinese) Feng CT, Zhao AJ, Li SJ. 2012. Determination of copper, zinc, lead, and cadmium concentration in Shaying River water. Henan Chemical Industry, 29(Z2): 49−52. (in Chinese) DOI: 10.14173/j.cnki.hnhg.2012.z2.006. Gómez-Alvarez A, Meza-Figueroa D, Valenzuela-García JL. et al. 2014. Behavior of metals under different seasonal conditions: Effects on the quality of a Mexico-USA Border River. Water, Air, & Soil Pollution, 225: 2138−2150. DOI: 10.1007/s11270-014-2138-z. He WL, Gui HR, Yuan ZH, et al. 2009. Removal of lead, cadmium, iron and manganese from mine water by potassium permanganate. Industrial Water Treatment, 29(10): 83-86. (in Chinese) Terrazas-Salvatierra J, Munoz-Vásquez G, Romero-Jaldin A. 2020. Migration of total chromium and chloride anion in the Rocha River used for estimating degradation of agricultural soil quality at the Thiu Rancho zone. Journal of Groundwater Science and Engineering, 8(03): 223−229. DOI: 10.19637/j.cnki.2305-7068.2020.03.003. Li MY, Xu JR, Shi ZW. 2009. Spatiotemporal differentiation characteristics of heavy metals in Künes River in Xinjiang. Environmental Chemistry, 28(05): 716−720. (in Chinese) Liu T, Zhou GS, Tan KY, et al. 2016. Research progress of winter wheat irrigation system and its environmental effects in North China. Journal of Ecology, 5979−5986. (in Chinese) Ross CL, Sensel-Gunke K, Wilken V, et al. 2016. Heavy metal distribution in soil and crops after agricultural application of Biowaste-Based Digestates. Health and Environmental Research Online, 1405−1410. Sundaray SK, Nayak BB, Kanungo TK, et al. 2012. Dynamics and quantification of dissolved heavy metals in the Mahanadi river estuarine system, India. Environ Monit Assess, 184: 1157-1179. Varol M, Gökot B, Bekleyen A. 2013. Dissolved heavy metals in the Tigris River (Turkey): Spatial and temporal variations. Environmental Science Pollution Research, 20: 6096−6108. DOI: 10.1007/s11356-013-1627-8. Wang MM. 2016. Risk assessment and source apportionment of heavy metals in typical rivers of Taihu Lake Basin. Nanjing: Nanjing University. (in Chinese) Wang YP. 2012. Characteristics of water quality and heavy metals in Guangdong section of the Pearl River Basin. Guangzhou: South China University of Technology. (in Chinese) Wang Z, Liu M, Lin L, et al. 2019. Spatio-temporal distribution and pollution assessment of heavy metals in the Middle and Lower Reaches of Hanjiang River. Journal of Yangtze River Scientific Research Institute, 38(09): 40−47. (in Chinese) Wu L, Liu GJ, Zhou CC, et al. 2018. Temporal-spatial distribution and pollution assessment of soluble heavy metals in Chaohu Lake. Environmental Science, 39(02): 738−747. DOI: 10.13227/j.hjkx.201703099. Wu YY, Liu YT, Zhang D, et al. 2021. The effect of anthropogenic input on the hydrochemical composition of water bodies in the Shaying River Basin. Chinese Journal of Ecology, 40(02): 427−441. (in Chinese) DOI: 10.13292/j.1000-4890.202102.004. Yu Y, Lv YN, Wang WJ, et al. 2020. Spatio-Temporal distribution and risk assessment of heavy metals in Middle and Lower Reaches of Le'an River. Environmental Science, 41(02): 691−701. (in Chinese) DOI: 10.13227/j.hjkx.201905026. Zamora-Ledezma C, Negrete-Bolagay D, Figueroa F, et al. 2021. Heavy metal water pollution: A fresh look about hazards, novel and conventional remediation methods. Environmental Technology & Innovation, 22. Zhang D, Yang JM, Huang XY, et al. 2019. Source of dissolved heavy metals in the Yiluo River Basin based on sulfur isotopes of sulfate. China Environmental Science, 39(06): 2549−2559. (in Chinese) DOI: 10.19674/j.cnki.issn1000-6923.2019.0304. Zhang WJ, Xin CL, Yu S, et al. 2021. Spatial-temporal distribution and pollution evaluation of dissolved heavy metals in the Liujiang River Basin. Environmental Science: 1-22. (in Chinese) Zhang Y, Li FD, Ouyang Z, et al. 2013. Distribution and health risk assessment of heavy metals of groundwater in the irrigation district of the Lower Reaches of Yellow River. Environmental Science, 34(01): 121−128. (in Chinese) DOI: 10.13227/j.hjkx.2013.01.028. -


 点击查看大图
计量
- 文章访问数: 727
- HTML全文浏览量: 345
- PDF下载量: 122
- 被引次数: 0


