
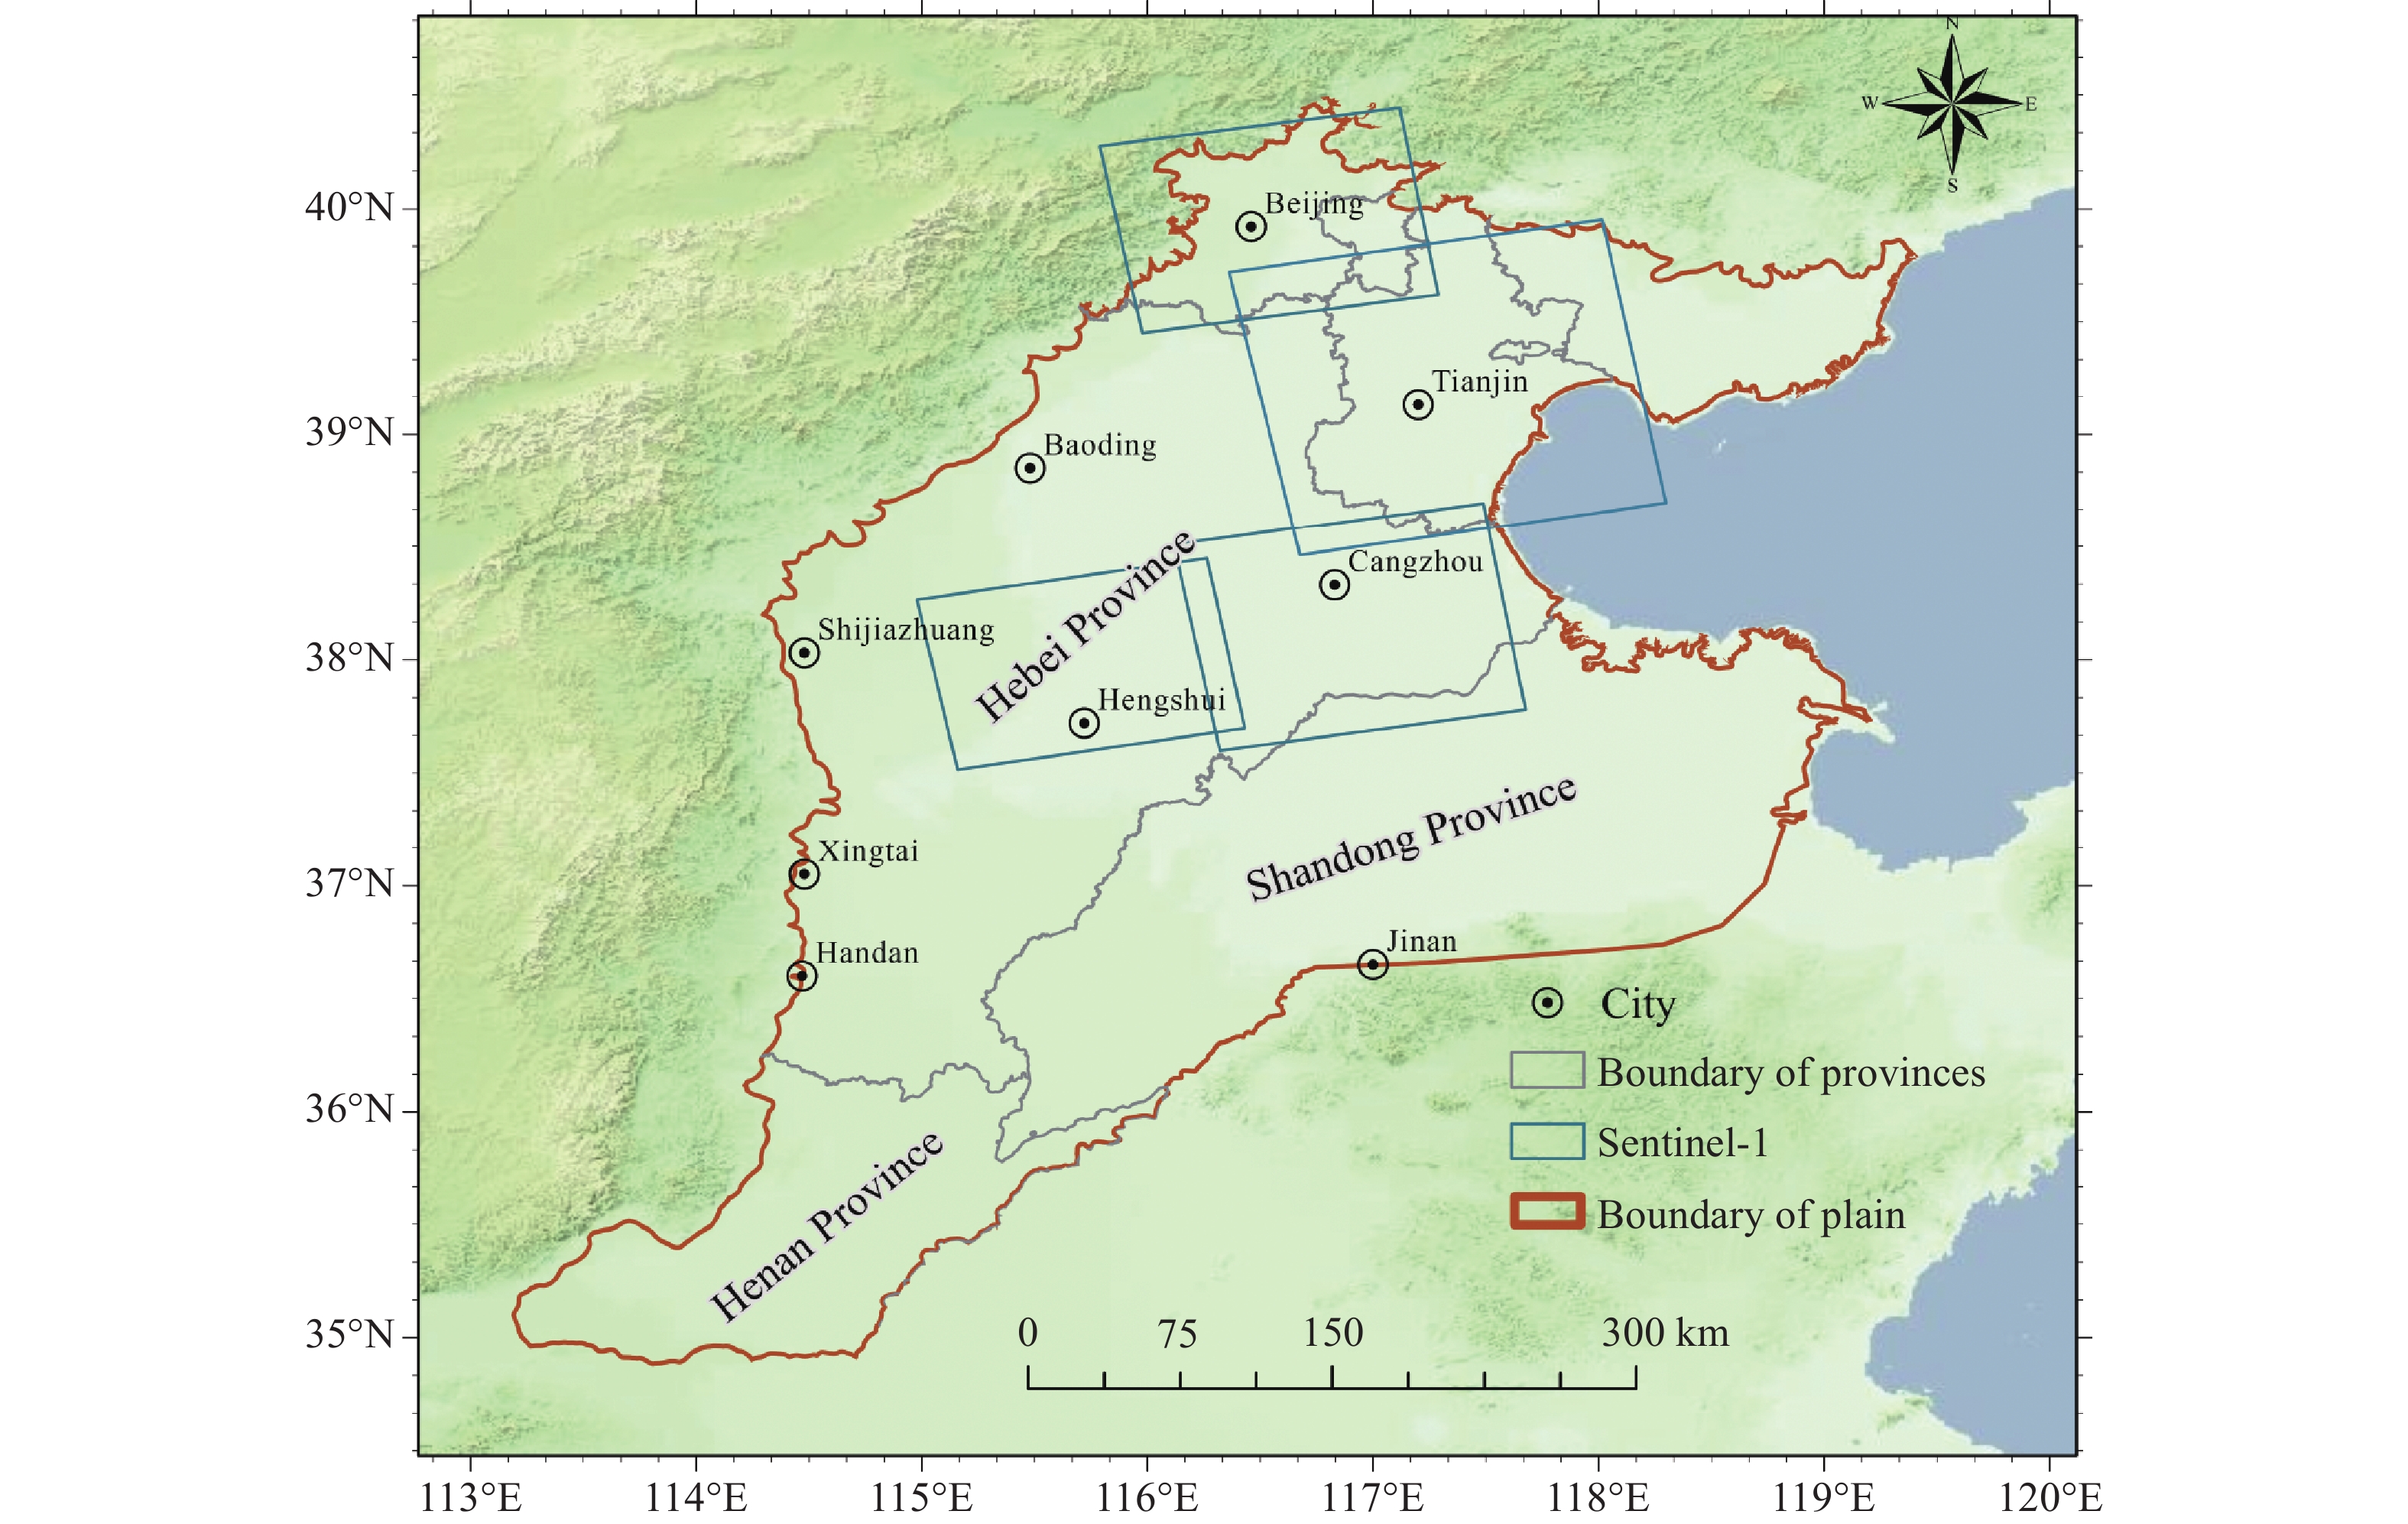
Citation: | Huang ZH, Huo ZB, Wang W, et al. 2025. Analysis of driving factors for land subsidence in typical cities of the North China Plain based on geodetector technology. Journal of Groundwater Science and Engineering, 13(1): 74-89 doi: 10.26599/JGSE.2025.9280040 |
The North China Plain is one of the fastest-growing economic regions in China, with the highest population density, and it serves as an important grain production base. However, its water resources account for only about 1% of the national total (Li et al. 2018). In recent years, rapid socio-economic development has led to a significant water resource shortage, resulting in severe groundwater over-extraction, making it the world's largest groundwater depression area. Groundwater depletion has caused serious regional environmental and geological problems, such as land subsidence (Lei et al. 2016; Yu et al. 2021). Therefore, a comprehensive understanding of the relationship between groundwater consumption and land subsidence in the North China Plain is essential.
Traditional field methods for observing groundwater and land subsidence are labour-intensive, resource-demanding, and costly, making large-scale monitoring in complex hydrogeological environments difficult. Remote sensing technologies, however, offer the capability to assess large areas across multiple spatial and temporal scales, greatly enhancing our ability to study environmental phenomena. Synthetic Aperture Radar (SAR) satellites, with their all-weather capability, wide monitoring range, and high precision, have made time-series InSAR (Interferometric Synthetic Aperture Radar) technology widely used for real-time land deformation monitoring (Xu et al. 2015). For example, Cao et al. (2024) used time-series InSAR to monitor land subsidence in Beijing, analysing its spatiotemporal patterns, which showed that the subsidence primarily occurred in plain areas and identified several large-scale subsidence centres.
The advent of GRACE (Gravity Recovery and Climate Experiment) gravity satellites has enabled the monitoring large-scale changes in water storage, including terrestrial water storage components such as snow and ice, vegetation canopy water, surface water, soil water, and groundwater. By combining GRACE-derived terrestrial water storage data with other datasets, groundwater storage Anomalies can be estimated. This approach has been widely applied in countries such as China and India, playing a significant role in remote sensing hydrology (Pan et al. 2017; Singh and Saravanan, 2020). For instance, Su et al. (2020) analysed the spatiotemporal variations in groundwater storage in the Huang-Huai-Hai Plain from 2003 to 2015 using GRACE data, showing a declining trend of −1.14 ± 0.89 cm/a. Similarly, Khorrami and Gunduz (2021) used GRACE to monitor groundwater storage decline in 2003–2016 in Turkey, finding that monthly Groundwater Storage Anomalies (GWSA) were highly correlated with precipitation and temperature, with a two-month lag.
Excessive groundwater extraction leads to soil layer compression, resulting in land subsidence. To understand the relationship between the land deformation and groundwater storage, numerous studies have studied groundwater level and land subsidence data from monitoring points. On larger spatial scales, studies combining GRACE and InSAR technologies have emerged (Sorkhabi and Asgari, 2023; An et al. 2024). Yu et al. (2021) analyzed the relationship between groundwater storage Anomalies and land subsidence in the Beijing-Tianjin-Hebei region using GRACE and MT-InSAR (multi-temporal InSAR) technologies, revealing that subsidence volume accounted for 59.46% of groundwater storage Anomalies. They also observed a strong correlation between the long-term declining trends of GWSA (−14.221 mm/a) and cumulative subsidence (−17.382 mm/a).
However, the coarse spatial resolution of GRACE data poses challenges in analysing the spatial relationship between groundwater storage and land subsidence. Researchers have used downscaling techniques such as machine learning, least squares regression, and weighted regression to improve spatial resolution alignment (Agarwal et al. 2023; Xue et al. 2024). For instance, Liu et al. (2024) investigated the relationship between groundwater storage and land subsidence across different landscape types in the Loess Plateau using downscaled GRACE and InSAR data, showing that elastic land deformation followed the temporal variations of groundwater storage and that pumping activities caused a lag of 1–2 months in groundwater storage deformation.
Several studies have examined the correlation between groundwater storage and land subsidence in the North China Plain (Huang et al. 2015; Gong et al. 2018; Li et al. 2018). However, previous research has mainly focused on describing long-term trends of groundwater depletion and land subsidence. Although the correlation between land deformation and groundwater is significant, challenges remain in analysing their spatiotemporal patterns. Furthermore, the spatial driving relationships between groundwater storage Anomalies and land subsidence require further investigation.
This study utilizes time-series InSAR and downscaled GRACE technologies to analyse groundwater storage Anomalies and land subsidence in four cities of the North China Plain: Beijing, Tianjin, Cangzhou, and Hengshui. It investigates the spatiotemporal evolution of land subsidence and groundwater storage Anomalies and explores the relationship between GWSA and cumulative subsidence in these cities. By combining downscaled GRACE groundwater storage Anomalies with factors such as climate, topography, and human activities, this study applies geodetector analysis to identify the driving factors behind land subsidence.
The North China Plain is characterized by flat terrain (Fig. 1) with elevations generally below 100 meters. Based on its origin and morphological features, the region is divided into three zones: The piedmont alluvial plain, the central-eastern alluvial plain, and the coastal alluvial-marine plain. The plain is primarily covered by Quaternary sediments, with thicknesses ranging from 150 m to 600 m. The region experiences a temperate monsoon climate, characterized by significant seasonal variation. During summer, oceanic moisture brings heavy rainfall, while winter is dominated by cold, dry air masses from inland areas. Evaporation increases with rising temperatures, and both precipitation and evaporation are unevenly distributed across space and time.
From the 1960s to the 1980s, the North China Plain underwent accelerated land subsidence due to rapid socio-economic development and extensive groundwater extraction. Prolonged over-extraction created multiple groundwater depression cones, leading to severe land subsidence. The areas with the greatest cumulative subsidence closely correspond to the distribution of deep groundwater depression cones. Currently, a contiguous subsidence region has formed across Tianjin, Cangzhou, Hengshui, and Dezhou, while in the Beijing plain, two distinct subsidence zones have developed in the southern and northern areas (Guo et al. 2021).
The development of land subsidence is influenced by complex factors, leading to significant spatial and temporal variability in its progression and affected areas. Overall, land subsidence in the North China Plain remains in a phase of rapid development.
A total of 342 images were acquired from satellite Sentinel-1 SLC, captured between June 2018 and June 2022. Elevation data were sourced from the Shuttle Radar Topography Mission (SRTM) Digital Elevation Model (DEM) with a resolution of 30 m. Precise Orbit Determination (POD) data were retrieved from the official Sentinel-1 website.
GRACE CSR Mascon RL06 Level 3 data, spanning from April 2002 to August 2022, were utilized with a spatial resolution of 0.25° × 0.25°. These data, derived using a point mass model using RL06 spherical harmonic coefficients, effectively reduce noise and address mass leakage issues. Missing data between June 2017 and October 2018 were supplemented using precipitation-based reconstructed terrestrial water storage change datasets (Zhong et al. 2020).
Snow water equivalent, soil moisture (0–2 m depth), and groundwater runoff data were obtained from the NOAH model within the FLDAS (Famine Early Warning Systems Network Land Data Assimilation System) at a resolution of 0.1°. Canopy water and surface water data were sourced from the GLDAS (Global Land Data Assimilation System) Noah submodule with a spatial resolution of 0.25°. To align with GRACE data, datasets from April 2002 to August 2022 were interpolated using cubic spline interpolation to achieve a resolution of 0.01°. Precipitation data were derived from GPM IMERG Final Precipitation L3 monthly datasets with a spatial resolution of 0.1° × 0.1°, covering the period from April 2002 to August 2022.
SBAS InSAR (Small Baseline Subset InSAR) technology, first proposed by Berardino et al. (2002), is a small baseline subset InSAR method primarily aimed at obtaining low-resolution, large-scale land deformation. The basic principle is as follows:
Assume that within a given time period, N Synthetic Aperture Radar (SAR) images covering the region are obtained. By applying a spatiotemporal baseline threshold, these N images are interferometrically combined to form M interferogram pairs. M and N must satisfy the following relationship:
N+12≤M≤N(N+1)2 |
(1) |
An external DEM is used to simulate and remove the topographic phase. The resulting differential interferograms are filtered and unwrapped to resolve phase ambiguities. Coherence is calculated for all pairs, producing an average coherence image. High-coherence points are extracted based on a set threshold. For any high-coherence pixel in the ith unwrapped image, the phase consists of deformation phase, atmospheric delay phase, and noise phase. Ignoring the atmospheric delay and noise phases, and the deformation phase can be represented as the Line-of-Sight (LOS) deformation phase, expressed as:
δ∅i(x,r)=∅B(x,r)−∅A(x,r)≈4πλ[d(tB,x,r)−d(tA,x,r)] |
(2) |
Where: tB and tA are acquisition times of the interferogram pair, and d(tB,x,r) and d(tA,x,r) are the cumulative LOS deformation at these times.
To derive time-series deformation data, the differential phase of adjacent time-series pairs is expressed as the product of the average phase velocity and the time interval between acquisitions:
Vi=∅i−∅i−1ti−ti−1 |
(3) |
The differential interferogram phase of the ith pair can then be written as the integral of the velocity over the time interval between acquisitions:
δ∅i(x,r)=tB,i∑k=tA,i+1(tk−tk−1)vk |
(4) |
Where: vk represents the average phase velocity during a certain time period. By combining the above equations, the differential interferogram phase values for the M small baseline pairs can be represented in matrix form:
δϕ=Bv |
(5) |
Where: B is the coefficient matrix, and each row corresponds to one differential interferogram pair.
The SBAS algorithm employs multiple master images. For the small baseline subset, when M≥N, the least squares method can be used to solve the matrix equation. When M<N between subsets, the matrix B may have a rank deficiency. In such cases, Singular Value Decomposition (SVD) is applied to obtain the minimum-norm solution for the velocity.
This method has been successfully applied to the downscaling of precipitation products (Peng et al. 2019; Peng et al. 2018), and previous studies have validated its accuracy in downscaling GRACE data (Liu et al. 2022). The downscaling process primarily uses FLDAS and GLDAS data, which have spatial resolutions of 0.01° and 0.25°, respectively. These datasets provide inputs for the 0.01° downscaling model, which includes snowmelt water, vegetation canopy water, surface water, soil moisture (0 m to 2 m deep), and groundwater—all of which contribute to terrestrial water storage. For the GRACE CSR RL06 Mascon Level 3 product, initially at a spatial resolution of 0.25°, is enhanced through this process.
Land water storage changes from GRACE and FLDAS for the period from April 2002 to August 2022 are used to calculate the monthly averages for each year as the baseline data.
TG025_layerm=Mean(2022∑y=2002TG025y,m) |
(6) |
TF001_layerm=Mean(2022∑y=2002TF001y,m) |
(7) |
Where: TG025_layermand TF001_layerm represent the baseline data for land water storage changes in specific months for the GRACE 0.25° and FLDAS 0.01° models, respectively. TG025y,m and TF001y,m refer to the land water storage changes for GRACE and FLDAS models in given a specific year (y) and month (m).
The monthly deviations of GRACE data relative to the GRACE monthly baseline are calculated as follows:
E025y,m=TG025y,m−TG025_layerm |
(8) |
Where: E025y,m represents the deviation of the GRACE data for a specific month in a given year relative to the baseline month. The monthly deviation data of GRACE are then interpolated to a 0.01° resolution, and combined with the 12-month baseline data from FLDAS to produce the final downscaled land water storage data at the target resolution.
TD001y,m=TF001_layerm+f(E025y,m) |
(9) |
Where: TD001y,m represents the downscaled groundwater storage Anomalies at a 0.01° resolution, and f(E025y,m) denotes the spatially interpolated GRACE monthly deviation results at the same resolution.
The Terrestrial Water Storage Anomalies (TWSA) obtained through GRACE downscaling primarily encompass changes in snow water equivalent, vegetation canopy water storage, soil moisture, groundwater storage, and biomass. Among these, the impact of biomass changes is minimal and can be neglected. Based on the principle of water balance, Groundwater Storage Anomalies (GWSA) can be calculated by subtracting Surface Water Storage Anomalies (SWSA), which include changes in snow water equivalent, canopy water storage and soil moisture, from the terrestrial water storage anomalies (TWSA). This relationship is expressed as follows (Lin et al. 2019):
ΔGWSA=ΔTWSA−ΔSMSA−ΔSWEA−ΔCWA |
(10) |
Where: GWSA represents groundwater storage Anomalies. TWSA, SMSA, SWEA, and CWA represent terrestrial water storage anomalies, soil moisture changes, snow water equivalent changes, and canopy water changes, respectively.
Geodetector is a statistical tool designed to analyse spatial heterogeneity and identify the driving forces behind it (Wang and Xu, 2017). It has been widely applied in evaluating risk factors associated with geological hazards (Zhang et al. 2023; Lin et al. 2021; Zhang et al. 2022). The geodetector comprises several components: Differentiation and factor detectors, interaction detectors, risk zone detectors, and ecological detectors. This study primarily employs the differentiation and factor detectors, as well as interaction detectors.
Differentiation and factor detectors: These are used to detect the spatial differentiation of geographic factors and the degree to which independent variables explain the spatial differentiation of dependent variables. The explanatory power is measured using the q-value, calculated as:
q=1−L∑h=1Nhσ2hNσ2 |
(11) |
Where: q represents the explanatory power, with a range of [0, 1], a larger q value indicates a better interpretation; h represents the number of strata for the independent or dependent variable, in which h=1, 2, ···, L; N is the number of units; σ2h and σ2 are the variances of the dependent variable for stratum h and the entire region, respectively.
Interaction detectors: These assess whether the interaction between influence factors enhances or weakens the explanatory power of the dependent variable Y. The types of interactions include nonlinear weakening, single factor nonlinear weakening, double factor enhancement, independence, and nonlinear enhancement.
Using data from the Haihe River Basin Water Resources Bulletin and the Beijing Water Resources Bulletin, annual changes in shallow groundwater storage in the Haihe River Basin plain and average groundwater depth at the end of the year in the Beijing plain area were obtained. Groundwater storage anomalies in the Haihe River Basin were processed and compared with the downscaled GRACE-derived groundwater storage anomalies (GWSA). Correlation analysis revealed that the correlation coefficients between the changes in groundwater storage in the Haihe River Basin and groundwater depth in the Beijing plain area, as compared to the downscaled GRACE GWSA, were 0.91 (Fig. 2a) and 0.67 (Fig. 2b), respectively. The downscaled GRACE GWSA closely follows the trend of the GWSA from the Haihe River Basin Water Resources Bulletin (Fig. 2c), demonstrating the reliability of the GWSA results obtained through the weighted downscaling method using GRACE data.
The spatial distribution of the annual GWSA rate in the North China Plain from 2002 to 2022 is shown in Fig. 3. The downscaled groundwater storage Anomalies better reflect detailed characteristics. Overall, groundwater storage shows a decreasing trend, with the magnitude of the decrease weakening from southwest to northeast. The GWSA changes range from −37.29 mm/a to 1.22 mm/a. Significant groundwater depletion is observed in the piedmont and central plains, with the most severe depletion occurring at the junction of Hebei, Shanxi, and Henan provinces, and gradually diminishing toward the northeast.
Fig. 4 presents the average Terrestrial Water Storage (TWSA) and Groundwater Storage Anomalies (GWSA) changes in the North China Plain over the past 20 years, derived from GRACE data. Both TWSA and GWSA exhibit significant declining trends, with rates of −16.46 mm/a and −18.69 mm/a, respectively. These findings indicate that the reduction in terrestrial water storage in the North China Plain over the past 20 years is primarily due to decreases in groundwater storage, while no significant trend is observed in Surface Water Storage (SWSA).
Since 2021, as precipitation has gradually increased, TWSA, SWSA, and GWSA have all shown upward trends. TWSA, SWSA, and GWSA also exhibit distinct seasonal variations: SWSA increases mainly in summer (June to August) and consistently decreases from August to the following June, while the seasonal trends of TWSA and GWSA are more closely aligned.
The GWSA trends in different cities within the North China Plain were further analyzed (Fig. 5). The results are as follows:
Tianjin: Groundwater depletion rate of −7.85 mm/a;
Beijing and Cangzhou: Severe depletion rates of −11.49 mm/a and −12.85 mm/a, respectively;
Hengshui: the highest depletion rate, reaching −19.86 mm/a.
All four cities exhibit significant seasonal variations in groundwater storage, reflecting the impact of precipitation and water use patterns.
Land subsidence is notably significant in the four representative cities of the North China Plain. Positive values indicate land uplift, while negative ones indicate subsidence. Severe subsidence is concentrated in the areas surrounding the central urban districts, where the subsidence rates are relatively lower. The overall spatial distribution pattern (Fig. 6) is consistent with the findings of Yu et al. (2021) based on Radarsat-2 data to study land subsidence in the Beijing-Tianjin-Hebei region from 2012 to 2016.
Beijing: Subsidence rates range from −124.62 mm/a to 20 mm/a, with prominent uneven spatial distribution. Subsidence areas are mainly located in northern Haidian, southern Changping, and the junction of Chaoyang and Tongzhou districts. Subsidence funnels tend to connect, aligning with the Beijing depression (Fig. 6a). Statistical analysis shows that 93% of monitoring points have a standard deviation of less than 6 mm/a (Fig. 6a1).
Tianjin: Subsidence rates range from −127 mm/a to 30 mm/a, with subsidence concentrated in the western and southern parts of the city, as well as along the northern bank of the Yongding New River estuary (Fig. 6b). Approximately 89% of monitoring points have a standard deviation of less than 6 mm/a (Fig. 6b1).
Cangzhou and Hengshui: Severe subsidence areas are distributed in large patches (Figs. 6c, 6d), mainly at the junction of Shenzhou, Xinji, and Jizhou, as well as southern Hengshui and southern Cangzhou. Most areas exhibit subsidence rates of less than −30 mm/a, with 94% and 96% of monitoring points having an annual average standard deviation of less than 6 mm/a, respectively (Figs. 6c1, 6d1).
The results indicate significant spatial differences in land subsidence within the study area, with high monitoring accuracy achieved using time-series InSAR technology.
Fig. 7 illustrates the relationship between the GWSA and surface cumulative deformation in Beijing, Tianjin, Cangzhou, and Hengshui in the period from June 2018 to June 2022. The groundwater storage and land deformation in Beijing, Cangzhou, and Hengshui exhibited a trend of decreasing followed by increasing from June 2018 to June 2022. In 2021 and 2022, due to increased rainfall, groundwater storage in these cities showed varying degrees of recovery. Groundwater storage exhibited significant seasonal changes, with the highest consumption occurring in summer. From August to January of the following year, groundwater storage gradually increased, reaching its peak in January. From March to May, groundwater rapidly decreased due to winter wheat irrigation, and during the summer irrigation period, groundwater storage continuously declined, with the greatest seasonal consumption occurring around August each year.
The trend of ground subsidence in Beijing largely mirrored the GWSA trend (Fig. 7a). However, anomalies were observed in 2018 and 2021. In 2021, during a period of continuous groundwater decline, the subsidence rate slowed in the first half of the year but accelerated in the second half. The seasonal variations in land deformation closely mirrored the changes in groundwater storage, and the strong correlation between the two suggests that groundwater fluctuations are the primary cause of land deformation.
In Tianjin (Fig. 7b), while there was no significant trend in groundwater storage from June 2018 to June 2022, land subsidence continued throughout the period. Groundwater storage and land subsidence showed seasonal correlations, with surface uplift occurring when groundwater storage increased from August to February of the following year. However, after February, as groundwater storage fluctuated, surface cumulative deformation continued to decrease.
In Cangzhou and Hengshui (Figs. 7c and 7d), the land subsidence trends were highly consistent with GWSA. In 2019 and 2020, both land land deformation and groundwater storage showed a decreasing trend, while in 2021 and 2022, with increased rainfall in North China Plain, land subsidence gradually slowed. Hengshui even experienced a slight uplift, exceeding the peak average values of the previous three years, suggesting that increased rainfall can alleviate land subsidence. The seasonal changes in land subsidence closely followed changes in groundwater storage. However, there was a delay in the response of land subsidence to GWSA, with a delay of approximately one month in Cangzhou and two months in Hengshui. Both cities are primarily located in the eastern and central plains, where deep groundwater from the third aquifer has been over-extracted. These areas have thick, horizontally continuous, and low-permeability layers, which cause a delayed subsidence response due to groundwater extraction (Guo et al. 2017).
The land subsidence in the four cities exhibited some correlation with changes in groundwater storage. The North China Plain's front ranges mainly experience the over-extraction of shallow groundwater, while areas in the central and eastern plains, such as Hengshui and Cangzhou, suffer from over-extraction of deep groundwater, which leads to delayed subsidence in these regions. Despite the preliminary success of the South-to-North Water Diversion Project and groundwater over-extraction management in recent years, the situation remains severe, particularly in agricultural areas where excessive irrigation is prevalent.
Previous studies have shown that land deformation is influenced by a combination of natural and anthropogenic factors (Bagheri-Gavkosh et al. 2021). This study selected natural factors such as topography and climate change, along with anthropogenic factors such as groundwater storage Anomalies and urbanization, as driving indicators for analyzing the causes of land subsidence in the study area. The specific indicators and their spatial distributions are shown in Table 1 and Fig. 8. Geological factors such as the thickness of Quaternary deposits and aquifer types were excluded, as the focus was on the relationship between natural geography, human activities, and land subsidence.
Data name | Data description | Data source |
North China Plain GRACE GWSA spatial distribution | Using GRACE downscaled results, the GWSA change rate for the North China Plain from 2002 to 2022 was obtained. Spatial resolution: 1 km. | —— |
Fault scale index | Based on fault line data, the length of fault lines within a 1 km grid is calculated. Spatial resolution: 1 km. | —— |
Annual rainfall spatial distribution | The 2019 monthly precipitation data is accumulated annually. Spatial resolution: 1 km. | National Earth System Science Data Center |
Evapotranspiration spatial distribution | Based on the 2019 GLASS and MODIS products, inversion results are used. Spatial resolution: 1 km. | Spatio-Temporal Environment Big Data Platform |
NDVI spatial distribution | Inversion based on 2019 SPOT data. Spatial resolution: 1 km. | National Earth System Science Data Center |
DEM spatial distribution | SRTM3 DEM data, spatial resolution: 90 m. | Geospatial Data Cloud |
Building density spatial distribution | Based on the 2019 land use data for the North China Plain, building land area within a 1 km grid is calculated. Spatial resolution: 1 km. | Zenodo |
Population spatial distribution | 2019 population spatial distribution data for China, in 1 km grid. Spatial resolution: 1 km. | Resource and Environment Science |
GDP spatial distribution | 2019 GDP spatial distribution data for China, in 1 km grid. Spatial resolution: 1 km. | Resource and Environment Science |
To minimize the influence of short-term groundwater storage anomalies on land subsidence, the GWSA rate from 2003 to 2022 in the North China Plain was used as a key factor (Fig. 3). Rainfall in the region in 2019 gradually decreased from southeast to northwest, ranging from 360 mm/a to 773 mm/a (Fig. 8a). Based on the distribution of active faults, fault lengths were statistically analysed on a 1 km × 1 km grid scale, resulting in a fault scale index (Fig. 8b). The fault scale index is primarily concentrated along the NE-trending faults of the Taihang piedmont and Tangshan-Cixian areas, as well as the NW-trending faults in Wuji-Hengshui. The scale index decreases with distance from fault lines, and with denser fault distributions in Beijing and Tianjin. The highest values appear in Beijing, Tangshan, and Tianjin.
Annual evapotranspiration (Fig. 8c) in the North China Plain shows high-value areas in the southeastern Yellow River irrigation zone and the piedmont plains of Baoding and Shijiazhuang, with lower values near Bohai Bay. Elevation decreases from the Taihang Mountains toward the coastal areas (Fig. 8d). The average NDVI (Normalized Difference Vegetation Index) for the North China Plain is 0.72, with uneven spatial distribution (Fig. 8e). NDVI values are lower in Beijing, Tianjin, and coastal areas. Urban land use data were used to calculate building density (Fig. 8f), and population and GDP distributions (Figs. 8g, 8h) form localized high-value zones in Beijing, Tianjin, Shijiazhuang, and other major cities.
This study used the annual land deformation rate of each city as the dependent variable and applied the natural breakpoint method to classify each influencing factor. By maximizing the differences between classes based on data similarity, breakpoints were identified at locations with significant ariations. Each factor was classified into 20 levels for detailed investigation. To avoid classification errors caused by variations in the number of subsidence point samples, the average annual deformation thresholds of −20 mm/a, −15 mm/a, and −10 mm/a were tested. The optimal q-value was obtained at the −15 mm/a threshold. Thus, a deformation rate of −15 mm/a was selected as the subsidence threshold, with sample ratios of 1:2, 1:1, and 1:0.5 for subsidence and non-subsidence points to examine the effect of sample size differences on the geographic detector's explanatory power. The results (Fig. 9) show that as the sample size increases, the q-value also increases. However, the ranking of each factor's impact on ground subsidence remains largely consistent. Based on these findings, the study selected a subsidence-to-non-subsidence sample ratio of 1:0.5 for factor detection analysis.
Using the geodetector techniques, q-values for the explanatory power of each factor were calculated (Fig. 10), with all factors passing the 95% confidence level test. The influence of each factor on the spatial distribution pattern of ground subsidence in the study area varied, with the factors ranked as follows: GWSA > DEM > evapotranspiration > precipitation > fracture zone density > building density > NDVI > GDP > population. Among these, GWSA had the greatest influence on ground subsidence, with a q-value of 0.387, making it the most significant driving factor for ground subsidence. DEM, evapotranspiration, and precipitation emerged as primary driving factors, while fracture zone density, building density, and NDVI were secondary drivers. GDP and population showed relatively low explanatory power.
The interaction detection results of the driving factors (Fig. 11) reveal that the factors are interdependent, with interactions contributing more to ground subsidence than individual factors. The results indicate a nonlinear enhancement or dual-factor enhancement effect, showing that ground subsidence in the study area is influenced by multiple interacting factors. For instance, when GWSA interacts with precipitation, fracture zone density, building density, evapotranspiration, or NDVI, or when precipitation interacts with evapotranspiration or fracture zone density, the combined explanatory power exceeds 60%. This suggests that these seven factors are the primary contributors to ground subsidence in the study area. Notably, the interaction between GWSA and precipitation has the greatest influence, yielding an interaction q-value of 0.72.
The geodetector results highlight that the spatial variability of ground subsidence is primarily driven by groundwater fluctuations. Excessive groundwater extraction, rather than replenishment, is the main cause of groundwater depletion. Data from the Haihe River Water Conservancy Committee show that from 2005 to 2022, the average annual water supply volume was 37.3 billion cubic meters, which is 1.2 times the total water resources and 1.5 times the groundwater resources. Statistical data from 2019–2020 indicate average groundwater level declines of 0.6 m in shallow aquifers and 1.0 m in deep aquifers, primarily in agricultural irrigation areas (Guo et al. 2021). Interaction with other factors significantly amplifies the explanatory power of GWSA, particularly with precipitation, fracture zone density, building density, evapotranspiration, NDVI, and DEM. This underscores that excessive groundwater extraction has led to significant depletion of the water resource in the North China Plain, and the combined effects of other factors exacerbate ground subsidence.
Climate change indirectly contributes to ground subsidence by affecting groundwater dynamics. Reduced rainfall and increased evapotranspiration diminish groundwater recharge. During dry periods, increased groundwater extraction to meet water supply demand intensifies land subsidence. Conversely, increased rainfall can mitigate the subsidence. In geologically active areas, variations in Quaternary strata depth create depression zones where excessive groundwater extraction accelerates subsidence. Urbanization adds another layer of complexity, as the load from buildings exacerbates subsidence, particularly in areas with poor hydrogeological conditions and extensive groundwater development, posing risks to residents and infrastructure. Vegetation growth in ecological environments also increases water consumption, contributing to groundwater depletion. Although the direct impacts of population and GDP on ground subsidence are relatively minor, their interaction with GWSA significantly amplifies their influence. This suggests that urban population growth and associated water demand accelerate groundwater depletion, further driving subsidence.
This study integrates multi-source satellite data to monitor the changes in groundwater storage and ground subsidence, while conducting a coupling analysis. From the perspective of geographic statistics, it explores the factors influencing the spatial distribution of ground subsidence, strengthening the study of the spatial relationship between groundwater storage fluctuations and ground subsidence. The key conclusions are as follows:
(1) Groundwater storage decrease and land subsidence trends: Over the past 20 years, groundwater storage in the North China Plain has gradually decreased due to factors such as agricultural irrigation and urban expansion, with an average decline rate of 18.69 mm/a. While the South-to-North Water Diversion Project and groundwater over-extraction management efforts have effectively mitigated ground subsidence in major urban areas, subsidence remains severe in the surrounding regions.
(2) Seasonal fluctuations and subsidence: Seasonal fluctuations in both ground subsidence and groundwater storage are generally aligned across the cities studied. Beijing, which primarily over-exploits shallow groundwater, exhibits the shortest response time to seasonal changes in groundwater storage, with no noticeable lag. In contrast, cities in the central and eastern North China Plain (e.g. Cangzhou, Hengshui) experience delayed subsidence responses due to the over-extraction of deep groundwater.
(3) Spatial distribution of ground subsidence: The spatial distribution of ground subsidence in the North China Plain is influenced by a combination of multiple factors. groundwater storage Anomalies serve as the primary driver, while Digital Elevation Model (DEM), evapotranspiration, and precipitation are secondary factors. Long-term excessive groundwater extraction, compounded by poor recharge conditions, is the main cause of ground subsidence, resulting in soil compaction and deformation. Additionally, the interactions between various factors significantly amplify their impact on ground subsidence, with the interaction between groundwater storage Anomalies and precipitation having the most pronounced effect on ground subsidence in the study area.
Acknowledgements: This research was supported by the Fundamental Research Funds for Central Public Welfare Research Institutes, CAGS (Project No. KY202302), China Geological Survey Project (DD20230719), and China Geological Survey Project (DD20230427)
Agarwal V, Akyilmaz O, Shum CK, et al. 2023. Machine learning based downscaling of GRACE-estimated groundwater in Central Valley, California. Science of the total Environment, 865: 161138. DOI: 10.1016/j.scitotenv.2022.161138.
|
An Y, Yang F, Xu J, et al. 2024. Surface deformation analysis and prediction of groundwater changes from joint sar-grace satellite data. IEEE Access, 12: 33671−33686, DOI: 10.1109/ACCESS.2024.3368423.
|
Bagheri-Gavkosh M, Hosseini SM, Ataie-Ashtiani B, et al. 2021. Land subsidence: A global challenge. Science of the Total Environment, 778(6): 146193. DOI: 10.1016/j.scitotenv.2021.146193.
|
Berardino P, Fornaro G, Lanari R, et al. 2002. A new algorithm for surface deformation monitoring based on small baseline differential SAR interferograms. IEEE Transactions on Geoscience and Remote Sensing, 40(11): 2375−2383. DOI: 10.1109/TGRS.2002.803792.
|
Cao Q, Zhang Y, Yang L, et al. 2024. Unveiling the driving factors of urban land subsidence in Beijing, China. Science of the Total Environment, 916: 170134. DOI: 10.1016/j.scitotenv.2024.170134.
|
Huang ZY, Pan Y, Gong HL, et al. 2015. Subregional‐scale groundwater depletion detected by GRACE for both shallow and deep aquifers in North China Plain. Geophysical Research Letters, 42(6): 1791−1799. DOI: 10.1002/2014GL062498.
|
Gong HL, Pan Y, Zheng LQ, et al. 2018. Long-term groundwater storage changes and land subsidence development in the North China Plain (1971–2015). Hydrogeology Journal, 26(5): 1417−1427. DOI: 10.1007/s10040-018-1768-4.
|
Guo HP, Bai JB, Zhang YQ, et al. 2017. The evolution characteristics and mechanism of the land subsidence in typical areas of the North China Plain. Geology in China, 44(6): 1115−1127. (in Chinese) DOI: 10.12029/gc20170606.
|
Guo HP, Li WP, Wang LY, et al. 2021. Present situation and research prospects of the land subsidence driven by groundwater levels in the North China Plain. Hydrogeology & Engineering Geology, 48(3): 162−171. (in Chinese) DOI: 10.16030/j.cnki.issn.1000-3665.202012037.
|
Khorrami B, Gunduz O. 2021. Evaluation of the temporal variations of groundwater storage and its interactions with climatic variables using GRACE data and hydrological models: A study from Turkey. Hydrological Processes, 35(3): e14076. DOI: 10.1002/hyp.14076.
|
Lei KC, Luo Y, Chen BB, et al. 2016. Distribution characteristics and influence factors ofland subsidence in Beijing area. Geology in China, 43(6): 2216−2228. (in Chinese) DOI: 10.12029/gc20160628.
|
Li X, Ye SY, Song F, et al. 2018. Quantitative identification of major factors affecting groundwater change in Beijing-Tianjin-Hebei Plain. Journal of China Hydrology, 38(01): 21−27. (in Chinese) DOI: 10.3969/j.issn.1000-0852.2018.01.004.
|
Lin JH, Chen WH, Qi XH, et al. 2021. Risk assessment and its influencing factors analysis of geological hazards in typical mountain environment. Journal of Cleaner Production, 309: 127077. DOI: 10.1016/j.jclepro.2021.127077.
|
Lin M, Biswas A, Bennett EM. 2019. Spatio-temporal dynamics of groundwater storage changes in the Yellow River Basin. Journal of Environmental Management, 235: 84−95. DOI: 10.1016/j.jenvman.2019.01.016.
|
Liu HL, Zhang GQ, Zhang DS, et al. 2022. Improving the spatial resolution of GRACE satellites based on high-resolution hydrological simulations. Bulletin of Surveying and Mapping, 0(8): 41−47. (in Chinese) DOI: 10.13474/j.cnki.11-2246.2022.0230.
|
Liu ZQ, Zhang SW, Fan WJ, et al. 2024. Associations between surface deformation and groundwater storage in different landscape areas of the Loess Plateau, China. Land, 13(2): 184. DOI: 10.3390/land13020184.
|
Pan Y, Zhang C, Gong HL, et al. 2017. Detection of human-induced evapotranspiration using GRACE satellite observations in the Haihe River basin of China. Geophysical Research Letters, 44(1): 190−199. DOI: 10.1002/2016GL071287.
|
Peng SZ, Ding YX, Liu WZ, et al. 2019. 1 km monthly temperature and precipitation dataset for China from 1901 to 2017. Earth System Science Data, 11(4): 1931−1946. DOI: 10.5194/essd-11-1931-2019,2019.
|
Peng SZ, Gang CC, Cao Y, et al. 2018. Assessment of climate change trends over the Loess Plateau in China from 1901 to 2100. International Journal of Climatology, 38(5): 2250−2264. DOI: 10.1002/joc.5331.
|
Singh L, Saravanan S. 2020. Satellite-derived GRACE groundwater storage variation in complex aquifer system in India. Sustainable Water Resources Management, 6(3): 43. DOI: 10.1007/s40899-020-00399-3.
|
Sorkhabi OM, Asgari J. 2023. Multi-sensor observations for monitoring groundwater depletion and land subsidence. Journal of Hydrology: Regional Studies, 50: 101529. DOI: 10.1016/j.ejrh.2023.101529.
|
Su YZ, Guo B, Zhou ZT, et al. 2020. Spatio-temporal variations in groundwater revealed by GRACE and its driving factors in the Huang-Huai-Hai Plain, China. Sensors, 20(3): 922. DOI: 10.3390/s20030922.
|
Wang JF, Xu CD. 2017. Geodetector: Principle and prospective. Acta Geographica Sinica, 72(1): 116−134. (in Chinese) DOI: 10.11821/dlxb201701010.
|
Xu CJ, He P, Wen YM, et al. 2015. Recent advances InSAR interferometry and its applications. Journal of Geomatics, 40(2): 1−9. (in Chinese) DOI: 10.14188/j.2095-6045.2015.02.001.
|
Xue DP, Gui DW, Ci MT, et al. 2024. Spatial and temporal downscaling schemes to reconstruct high-resolution GRACE data: A case study in the Tarim River Basin, Northwest China. Science of the Total Environment, 907: 167908. DOI: 10.1016/j.scitotenv.2023.167908.
|
Yu W, Gong HL , Chen BB, et al. 2021. Combined GRACE and MT-InSAR to assess the relationship between groundwater storage cchange and land subsidence in the BeijZing-Tianjin-Hebei Region. Remote Sensing, 13(18): 3773. DOI: 10.3390/rs13183773.
|
Zhang XY, Ruan YC, Xuan WH, et al. 2023. Risk assessment and spatial regulation on urban ground collapse based on geo-detector: A case study of Hangzhou urban area. NaturalHazards, 118: 525−543. DOI: 10.1007/s11069-023-06016-8.
|
Zhang Y, Liu YF, Liu Y, et al. 2022. Spatial-temproal variation characteristics and geographic detection mechanism of land subsidence in wuhan city from 2007 to 2019. Geomatics and Information Science of Wuhan University, 47(9): 1486−1497. (in Chinese) DOI: 10.13203/j.whugis20210143.
|
Zhong YL, Feng W, Zhong M, et al. 2020. Dataset of reconstructed terrestrial water storage in China based on precipitation (2002–2019). A Big Earth Data Platform for ThreePoles. CSTR: 18406.11.Hydro.tpdc.270990. DOI: 10.11888/Hydro.tpdc.270990.
|
2305-7068/© 2025 Journal of Groundwater Science and Engineering Editorial Office. This is an open access article under the CC BY-NC-ND license (http://creativecommons.org/licenses/by-nc-nd/4.0)
[1] | Mobin Eftekhari, Abbas Khashei-Siuki, 2025: Evaluating machine learning methods for predicting groundwater fluctuations using GRACE satellite in arid and semi-arid regions, Journal of Groundwater Science and Engineering, 13, 5-21. doi: 10.26599/JGSE.2025.9280035 |
[2] | Yan-pei Cheng, Fa-wang Zhang, Hua Dong, Xue-ru Wen, 2024: Groundwater and environmental challenges in Asia, Journal of Groundwater Science and Engineering, 12, 223-236. doi: 10.26599/JGSE.2024.9280017 |
[3] | Ghulam Zakir-Hassan, Jehangir F Punthakey, Ghulam Shabir, Faiz Raza Hassan, 2024: Assessing the potential of underground storage of flood water: A case study from Southern Punjab Region in Pakistan, Journal of Groundwater Science and Engineering, 12, 387-396. doi: 10.26599/JGSE.2024.9280029 |
[4] | Ying-nan Zhang, Yan-guang Liu, Kai Bian, Guo-qiang Zhou, Xin Wang, Mei-hua Wei, 2024: Development status and prospect of underground thermal energy storage technology, Journal of Groundwater Science and Engineering, 12, 92-108. doi: 10.26599/JGSE.2024.9280008 |
[5] | Hui-Meng Su, Fa-Wang Zhang, Jing-Yu Hu, Jin-Feng Lei, Wei Zuo, Bo Yang, Yu-Hua Liu, 2024: Identified the hydrochemical and the sulfur cycle process in subsidence area of Pingyu mining area using multi-isotopes combined with hydrochemistry methods, Journal of Groundwater Science and Engineering, 12, 62-77. doi: 10.26599/JGSE.2024.9280006 |
[6] | Feng Liu, Wei Zhang, Gui-ling Wang, Shuai-chao Wei, Chen Yue, Guang-zheng Jiang, Yu-zhong Liao, 2023: Geothermal anomalies in the Xianshuihe area: Implications for tunnel construction along the Sichuan-Tibet Railway, China, Journal of Groundwater Science and Engineering, 11, 237-248. doi: 10.26599/JGSE.2023.9280020 |
[7] | Xin Ma, Dong-guang Wen, Guo-dong Yang, Xu-feng Li, Yu-jie Diao, Hai-hai Dong, Wei Cao, Shu-guo Yin, Yan-mei Zhang, 2021: Potential assessment of CO2 geological storage based on injection scenario simulation: A case study in eastern Junggar Basin, Journal of Groundwater Science and Engineering, 9, 279-291. doi: 10.19637/j.cnki.2305-7068.2021.04.002 |
[8] | Ruo-xi Yuan, Gui-ling Wang, Feng Liu, Wei Zhang, Wan-li Wang, Sheng-wei Cao, 2021: Evaluation of shallow geothermal energy resources in the Beijing-Tianjin-Hebei Plain based on land use, Journal of Groundwater Science and Engineering, 9, 129-139. doi: 10.19637/j.cnki.2305-7068.2021.02.005 |
[9] | Afraz Mehdi, Eftekhari Mobin, Akbari Mohammad, Ali Haji Elyasi, Noghani Zahra, 2021: Application assessment of GRACE and CHIRPS data in the Google Earth Engine to investigate their relation with groundwater resource changes (Northwestern region of Iran), Journal of Groundwater Science and Engineering, 9, 102-113. doi: 10.19637/j.cnki.2305-7068.2021.02.002 |
[10] | ZHAO Yue-wen, WANG Xiu-yan, LIU Chang-li, LI Bing-yan, 2020: Finite-difference model of land subsidence caused by cluster loads in Zhengzhou, China, Journal of Groundwater Science and Engineering, 8, 43-56. doi: 10.19637/j.cnki.2305-7068.2020.01.005 |
[11] | Nouayti Abderrahime, Khattach Driss, Hilali Mohamed, Nouayti Nordine, 2019: Mapping potential areas for groundwater storage in the High Guir Basin (Morocco):Contribution of remote sensing and geographic information system, Journal of Groundwater Science and Engineering, 7, 309-322. doi: DOI: 10.19637/j.cnki.2305-7068.2019.04.002 |
[12] | LI Wen-yon, FU Li, ZHU Zheng-feng, 2019: Numerical simulation and land subsidence control for deep foundation pit dewatering of Longyang Road Station on Shanghai Metro Line 18, Journal of Groundwater Science and Engineering, 7, 133-144. doi: 10.19637/j.cnki.2305-7068.2019.02.004 |
[13] | GUO Li-jun, YAN Ya-ya, GUO Li-na, MA Jin-long, LV Ming-yu, 2016: GIS-based spatial and temporal changes of land occupation caused by mining activities-a study in eastern part of Hubei Province, Journal of Groundwater Science and Engineering, 4, 60-68. |
[14] | GUO Long-zhu, 2016: Study on ecological and economic effects of land and water resources allocation in Sanjiang Plain, Journal of Groundwater Science and Engineering, 4, 110-119. |
[15] | LI Duo, WEI Ai-hua, 2016: Analysis of influence of the power plant ash storage yard on groundwater environment, Journal of Groundwater Science and Engineering, 4, 35-40. |
[16] | CHENG Yan-pei, DONG Hua, 2015: Groundwater system division and compilation of Groundwater Resources Map of Asia, Journal of Groundwater Science and Engineering, 3, 127-135. |
[17] | ZHANG Wei, 2014: Establishment of an assessment method for site-scale suitability of CO2 geological storage, Journal of Groundwater Science and Engineering, 2, 19-25. |
[18] | Zong-jun Gao, Yong-gui Liu, 2013: Groundwater Flow Driven by Heat, Journal of Groundwater Science and Engineering, 1, 22-27. |
[19] | Aizhong Ding, Lirong Cheng, Steve Thornton, Wei Huang, David Lerner, 2013: Groundwater quality Management in China, Journal of Groundwater Science and Engineering, 1, 54-59. |
[20] | Jiankang Zhang, Yanpei Cheng, Hua Dong, Qingshi Guo, Kun Liu, Fawang Zhang, 2013: Study on Ecological Environment and Sustainable Land Use Based on Satellite Remote Sensing, Journal of Groundwater Science and Engineering, 1, 89-96. |
JGSE-ScholarOne Manuscript Launched on June 1, 2024.
Data name | Data description | Data source |
North China Plain GRACE GWSA spatial distribution | Using GRACE downscaled results, the GWSA change rate for the North China Plain from 2002 to 2022 was obtained. Spatial resolution: 1 km. | —— |
Fault scale index | Based on fault line data, the length of fault lines within a 1 km grid is calculated. Spatial resolution: 1 km. | —— |
Annual rainfall spatial distribution | The 2019 monthly precipitation data is accumulated annually. Spatial resolution: 1 km. | National Earth System Science Data Center |
Evapotranspiration spatial distribution | Based on the 2019 GLASS and MODIS products, inversion results are used. Spatial resolution: 1 km. | Spatio-Temporal Environment Big Data Platform |
NDVI spatial distribution | Inversion based on 2019 SPOT data. Spatial resolution: 1 km. | National Earth System Science Data Center |
DEM spatial distribution | SRTM3 DEM data, spatial resolution: 90 m. | Geospatial Data Cloud |
Building density spatial distribution | Based on the 2019 land use data for the North China Plain, building land area within a 1 km grid is calculated. Spatial resolution: 1 km. | Zenodo |
Population spatial distribution | 2019 population spatial distribution data for China, in 1 km grid. Spatial resolution: 1 km. | Resource and Environment Science |
GDP spatial distribution | 2019 GDP spatial distribution data for China, in 1 km grid. Spatial resolution: 1 km. | Resource and Environment Science |