 E-mail alert
 Rss
Rss

Temporal variations of reference evapotranspiration and controlling factors: Implications for climatic drought in karst areas
-
Abstract: Variations in reference evapotranspiration (ET0) and drought characteristics play a key role in the effect of climate change on water cycle and associated ecohydrological patterns. The accurate estimation of ET0 is still a challenge due to the lack of meteorological data and the heterogeneity of hydrological system. Although there is an increasing trend in extreme drought events with global climate change, the relationship between ET0 and aridity index in karst areas has been poorly studied. In this study, we used the Penman–Monteith method based on a long time series of meteorological data from 1951 to 2015 to calculate ET0 in a typical karst area, Guilin, Southwest China. The temporal variations in climate variables, ET0 and aridity index (AI) were analyzed with the Mann–Kendall trend test and linear regression to determine the climatic characteristics, associated controlling factors of ET0 variations, and further to estimate the relationship between ET0 and AI. We found that the mean, maximum and minimum temperatures had increased significantly during the 65-year study period, while sunshine duration, wind speed and relative humidity exhibited significant decreasing trends. The annual ET0 showed a significant decreasing trend at the rate of −8.02 mm/10a. However, significant increase in air temperature should have contributed to the enhancement of ET0, indicating an “evaporation paradox”. In comparison, AI showed a slightly declining trend of −0.0005/a during 1951–2015. The change in sunshine duration was the major factor causing the decrease in ET0, followed by wind speed. AI had a higher correlation with precipitation amount, indicating that the variations of AI was more dependent on precipitation, but not substantially dependent on the ET0. Although AI was not directly related to ET0, ET0 had a major contribution to seasonal AI changes. The seasonal variations of ET0 played a critical role in dryness/wetness changes to regulate water and energy supply, which can lead to seasonal droughts or water shortages in karst areas. Overall, these findings provide an important reference for the management of agricultural production and water resources, and have an important implication for drought in karst regions of China.
-
Key words:
- Reference evapotranspiration /
- Aridity index /
- Penman–Monteith method /
- Sunshine duration /
- Guilin
-
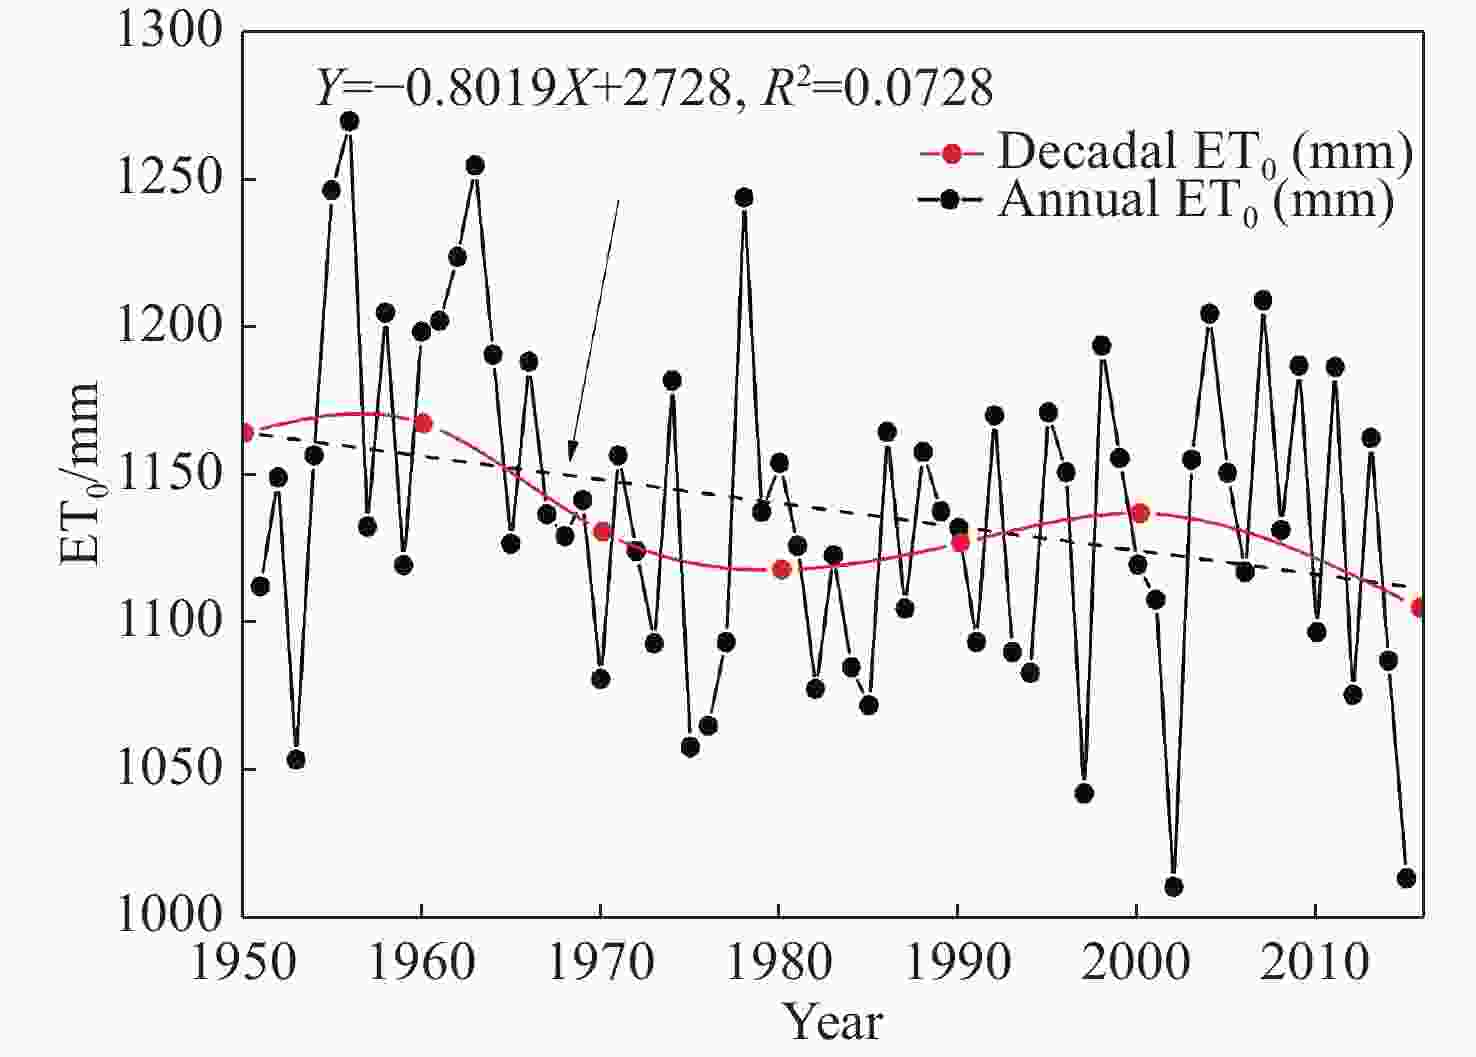
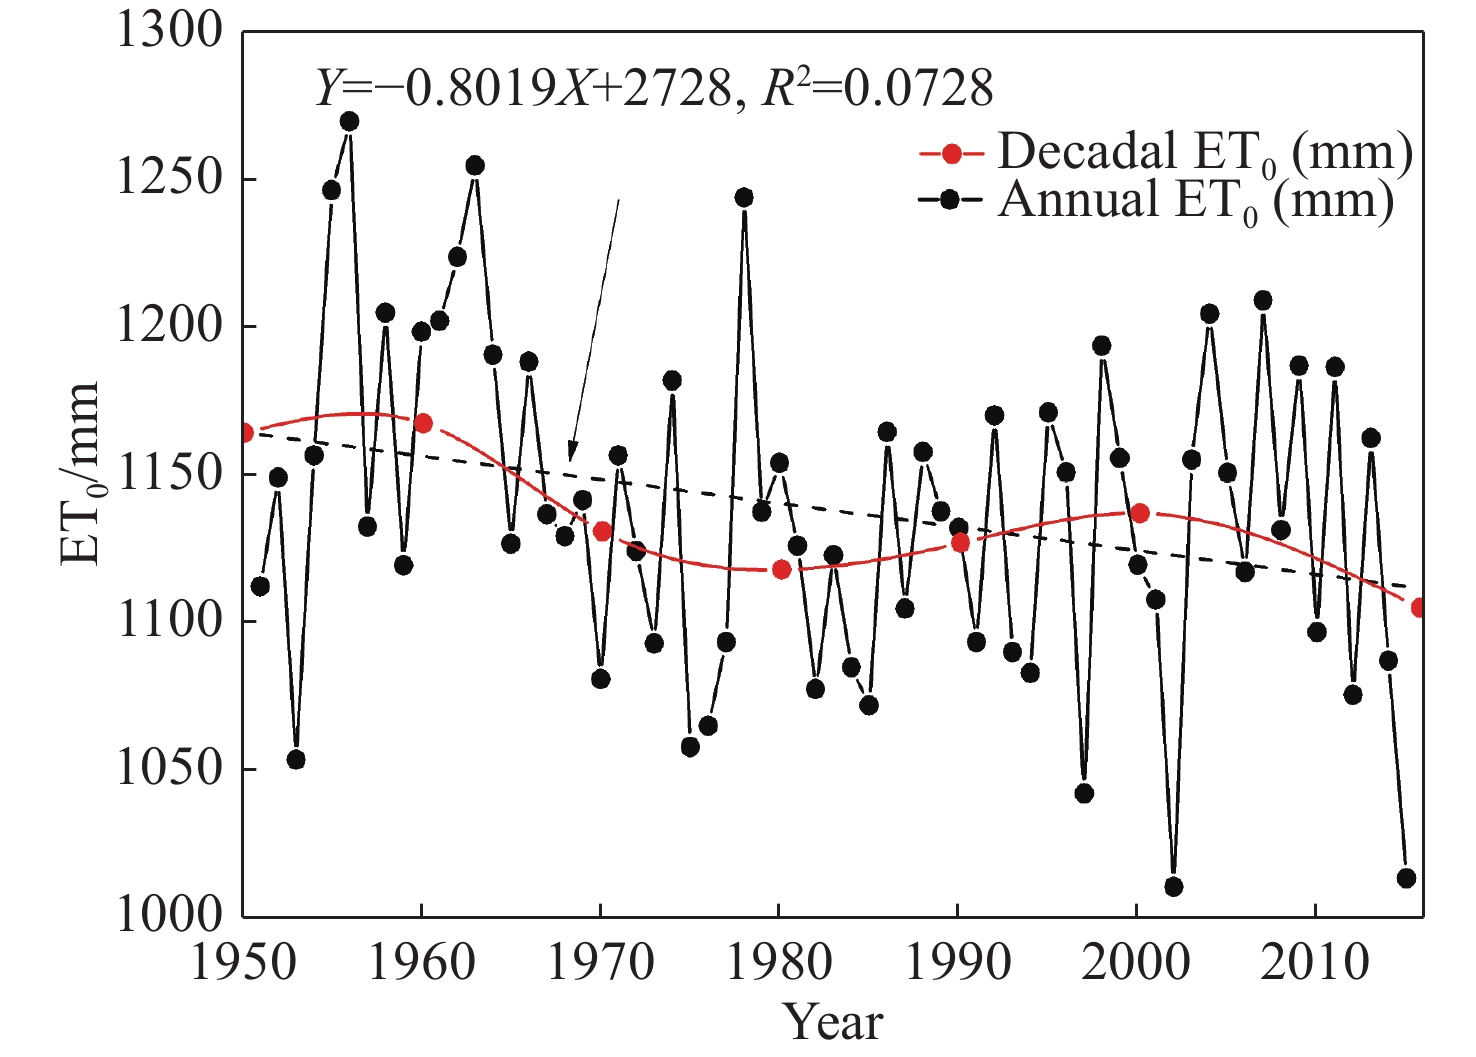
Figure 1. Annual and inter-annual variations of ET0 for Guilin, China from 1951 to 2015
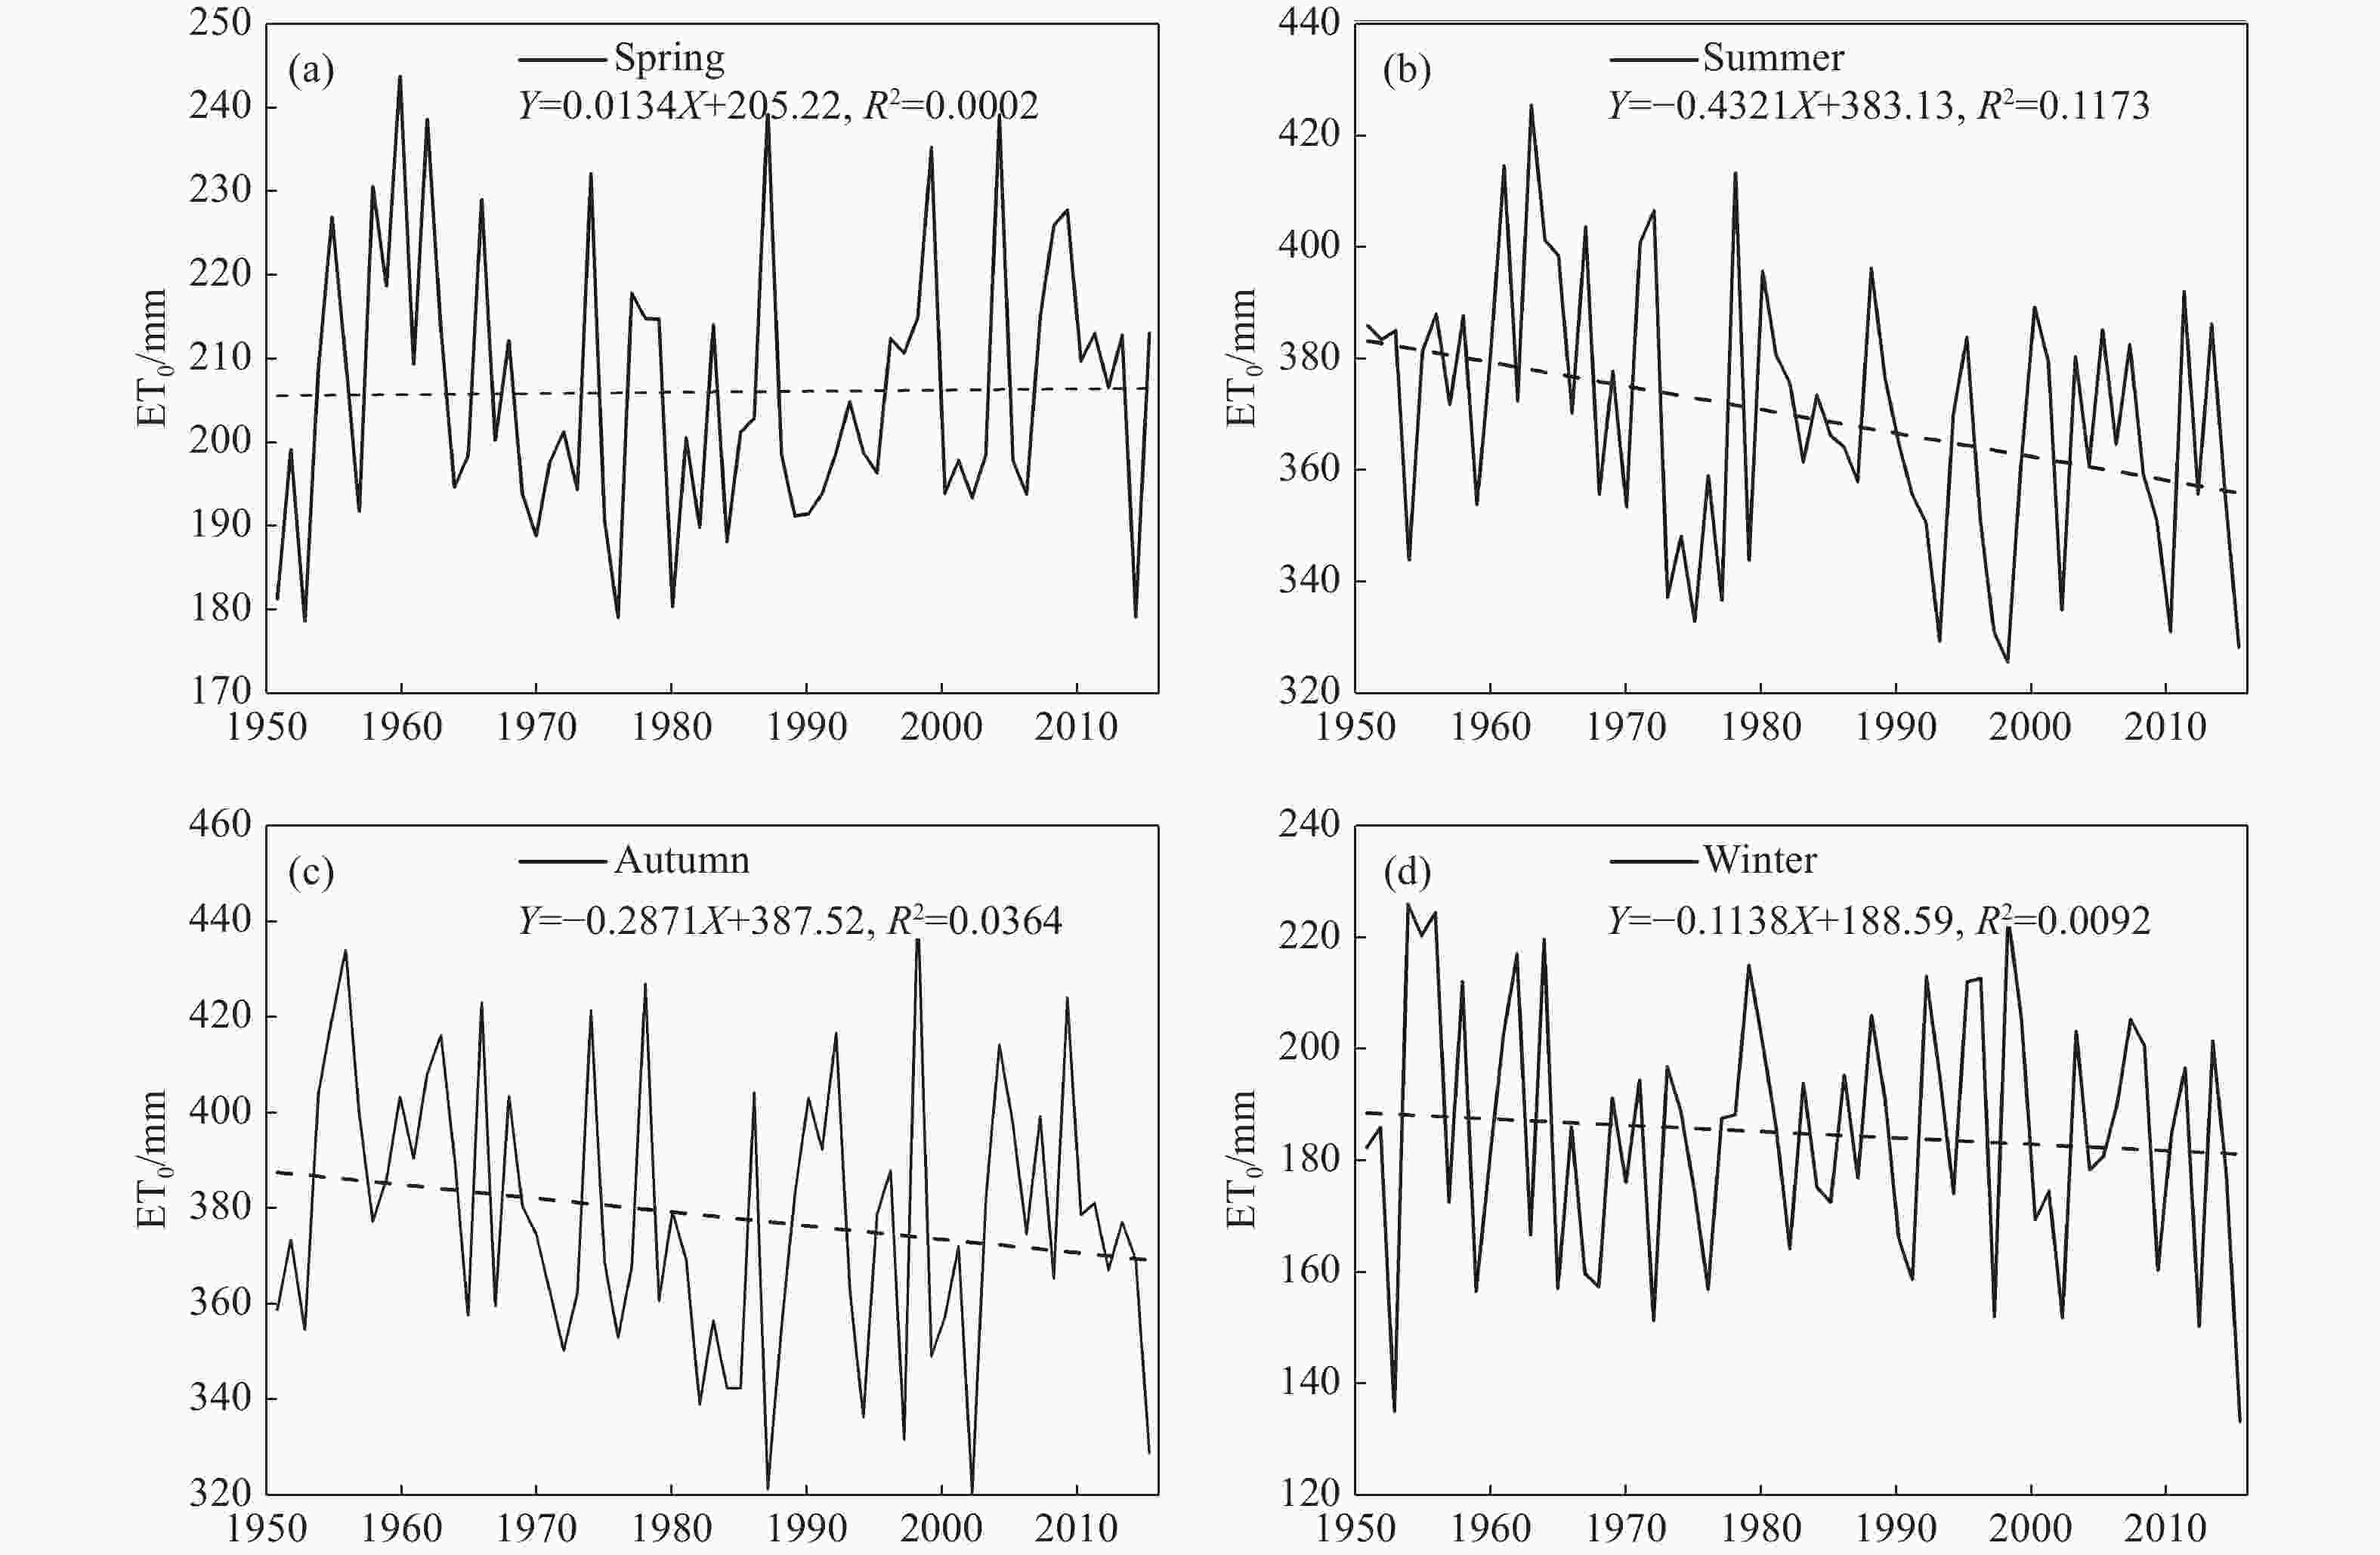
Figure 3. Seasonal variations of ET0 during (a) spring, (b) summer, (c) autumn, and (d) winter in Guilin, China from 1951 to 2015
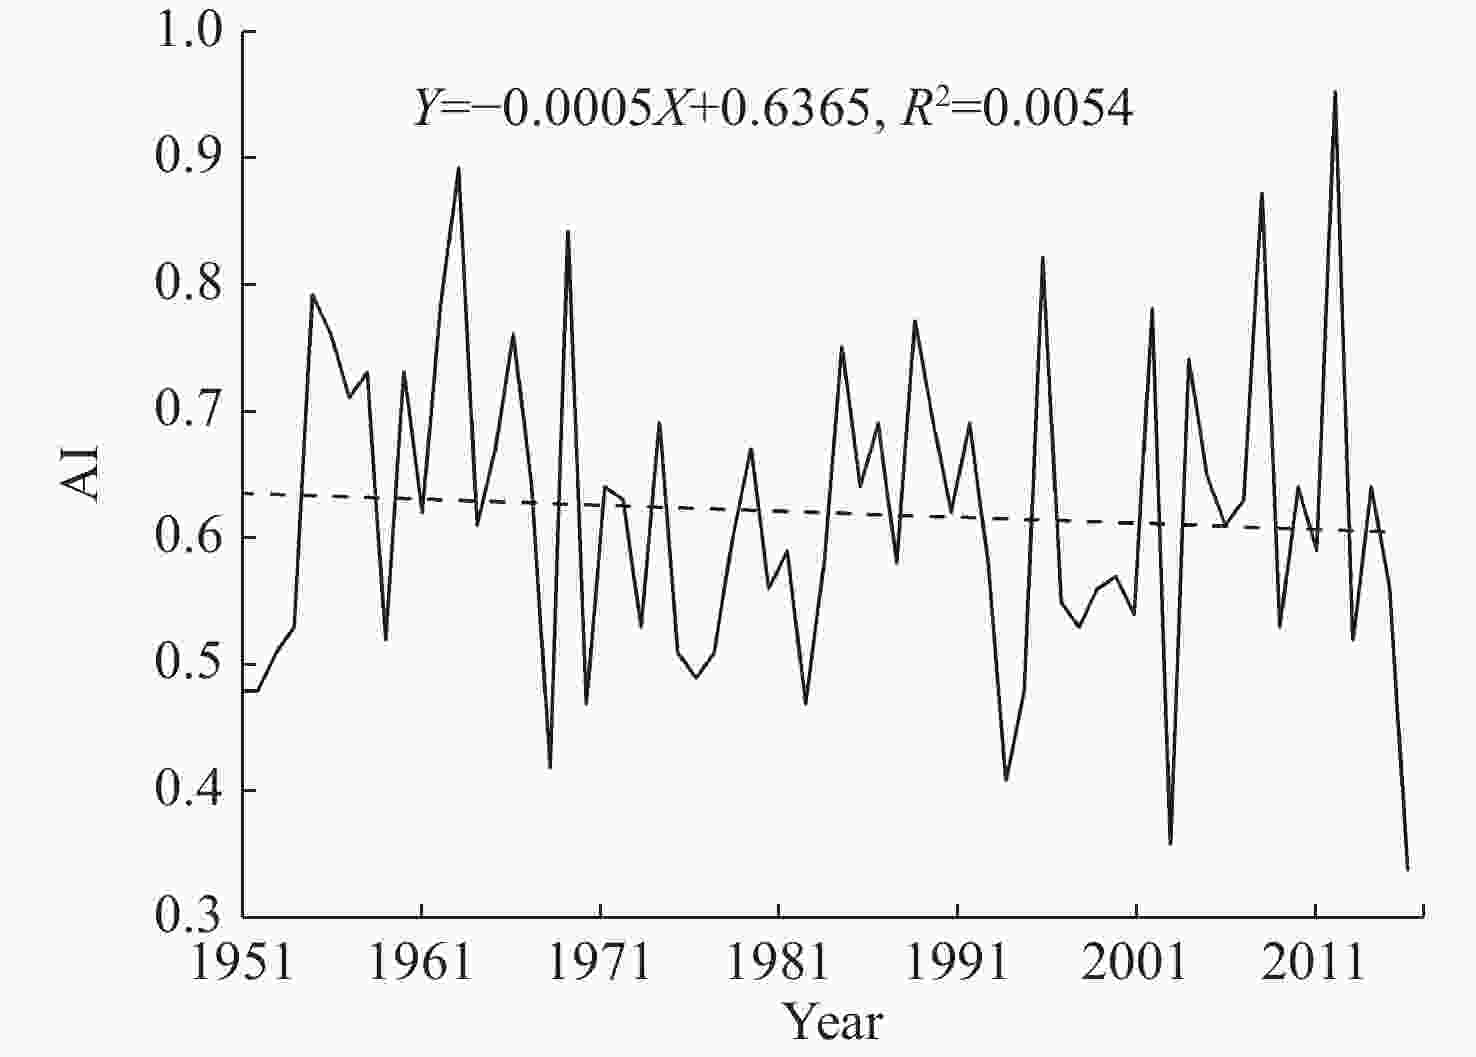
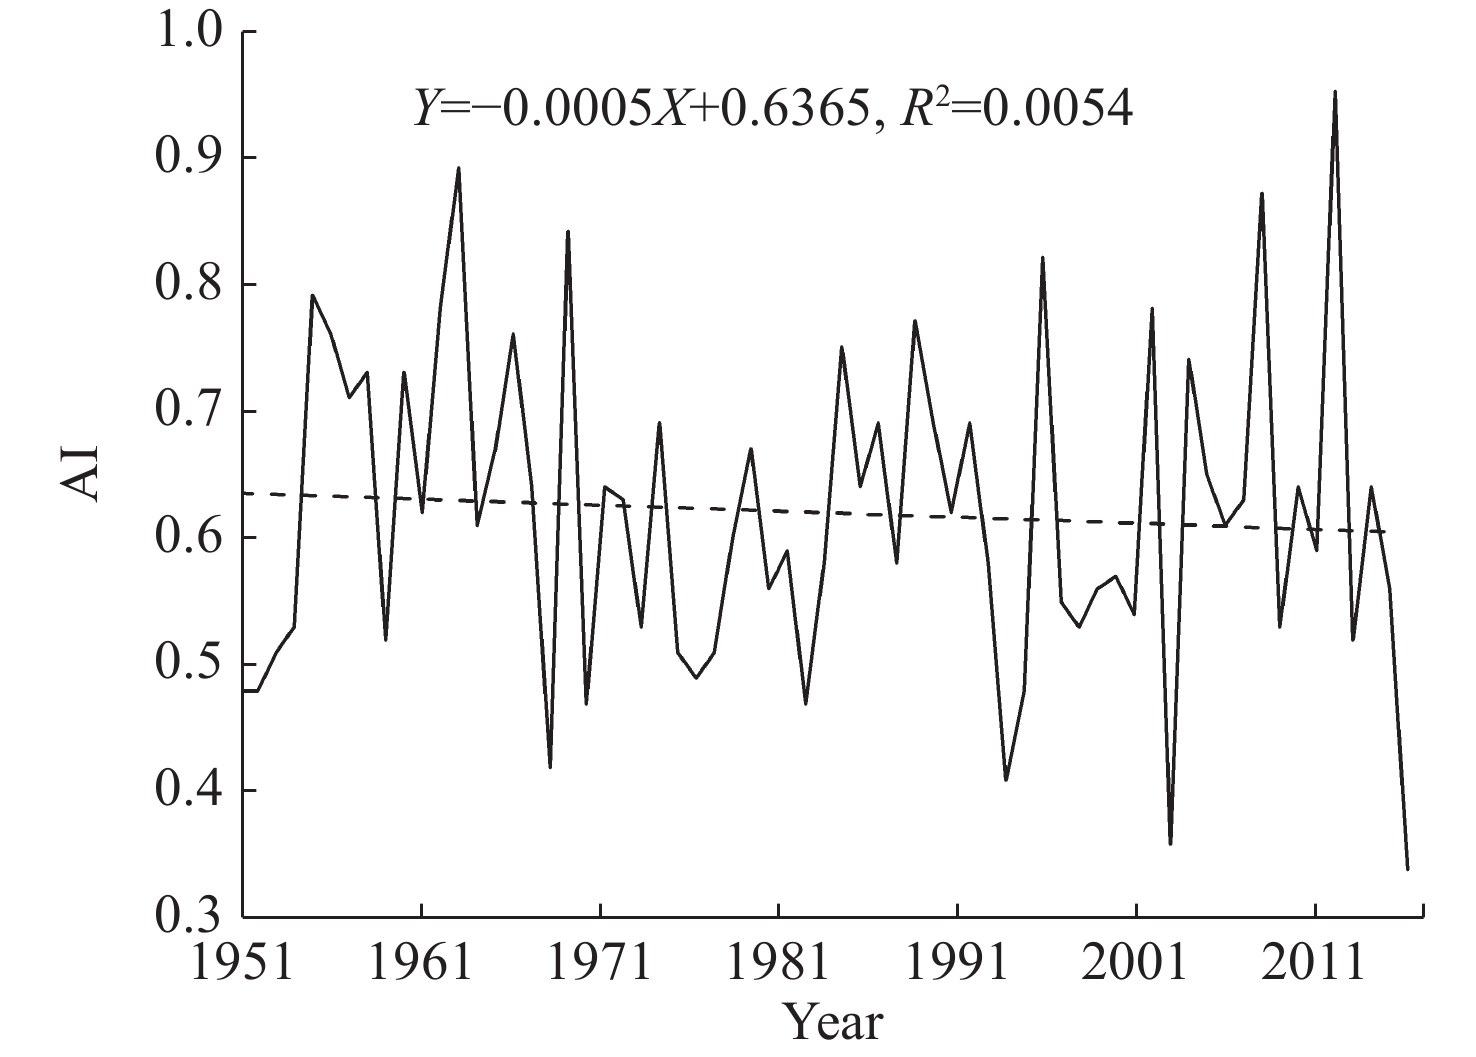
Figure 4. Trend in the annual aridity index (AI) for Guilin, China during 1951–2015. Dotted line represents the linear fitting line.

Figure 5. Seasonal variations in the aridity index in (a) spring, (b) summer, (c) autumn, and (d) winter for Guilin, China from 1951 to 2015. Dotted line is the linear trend.

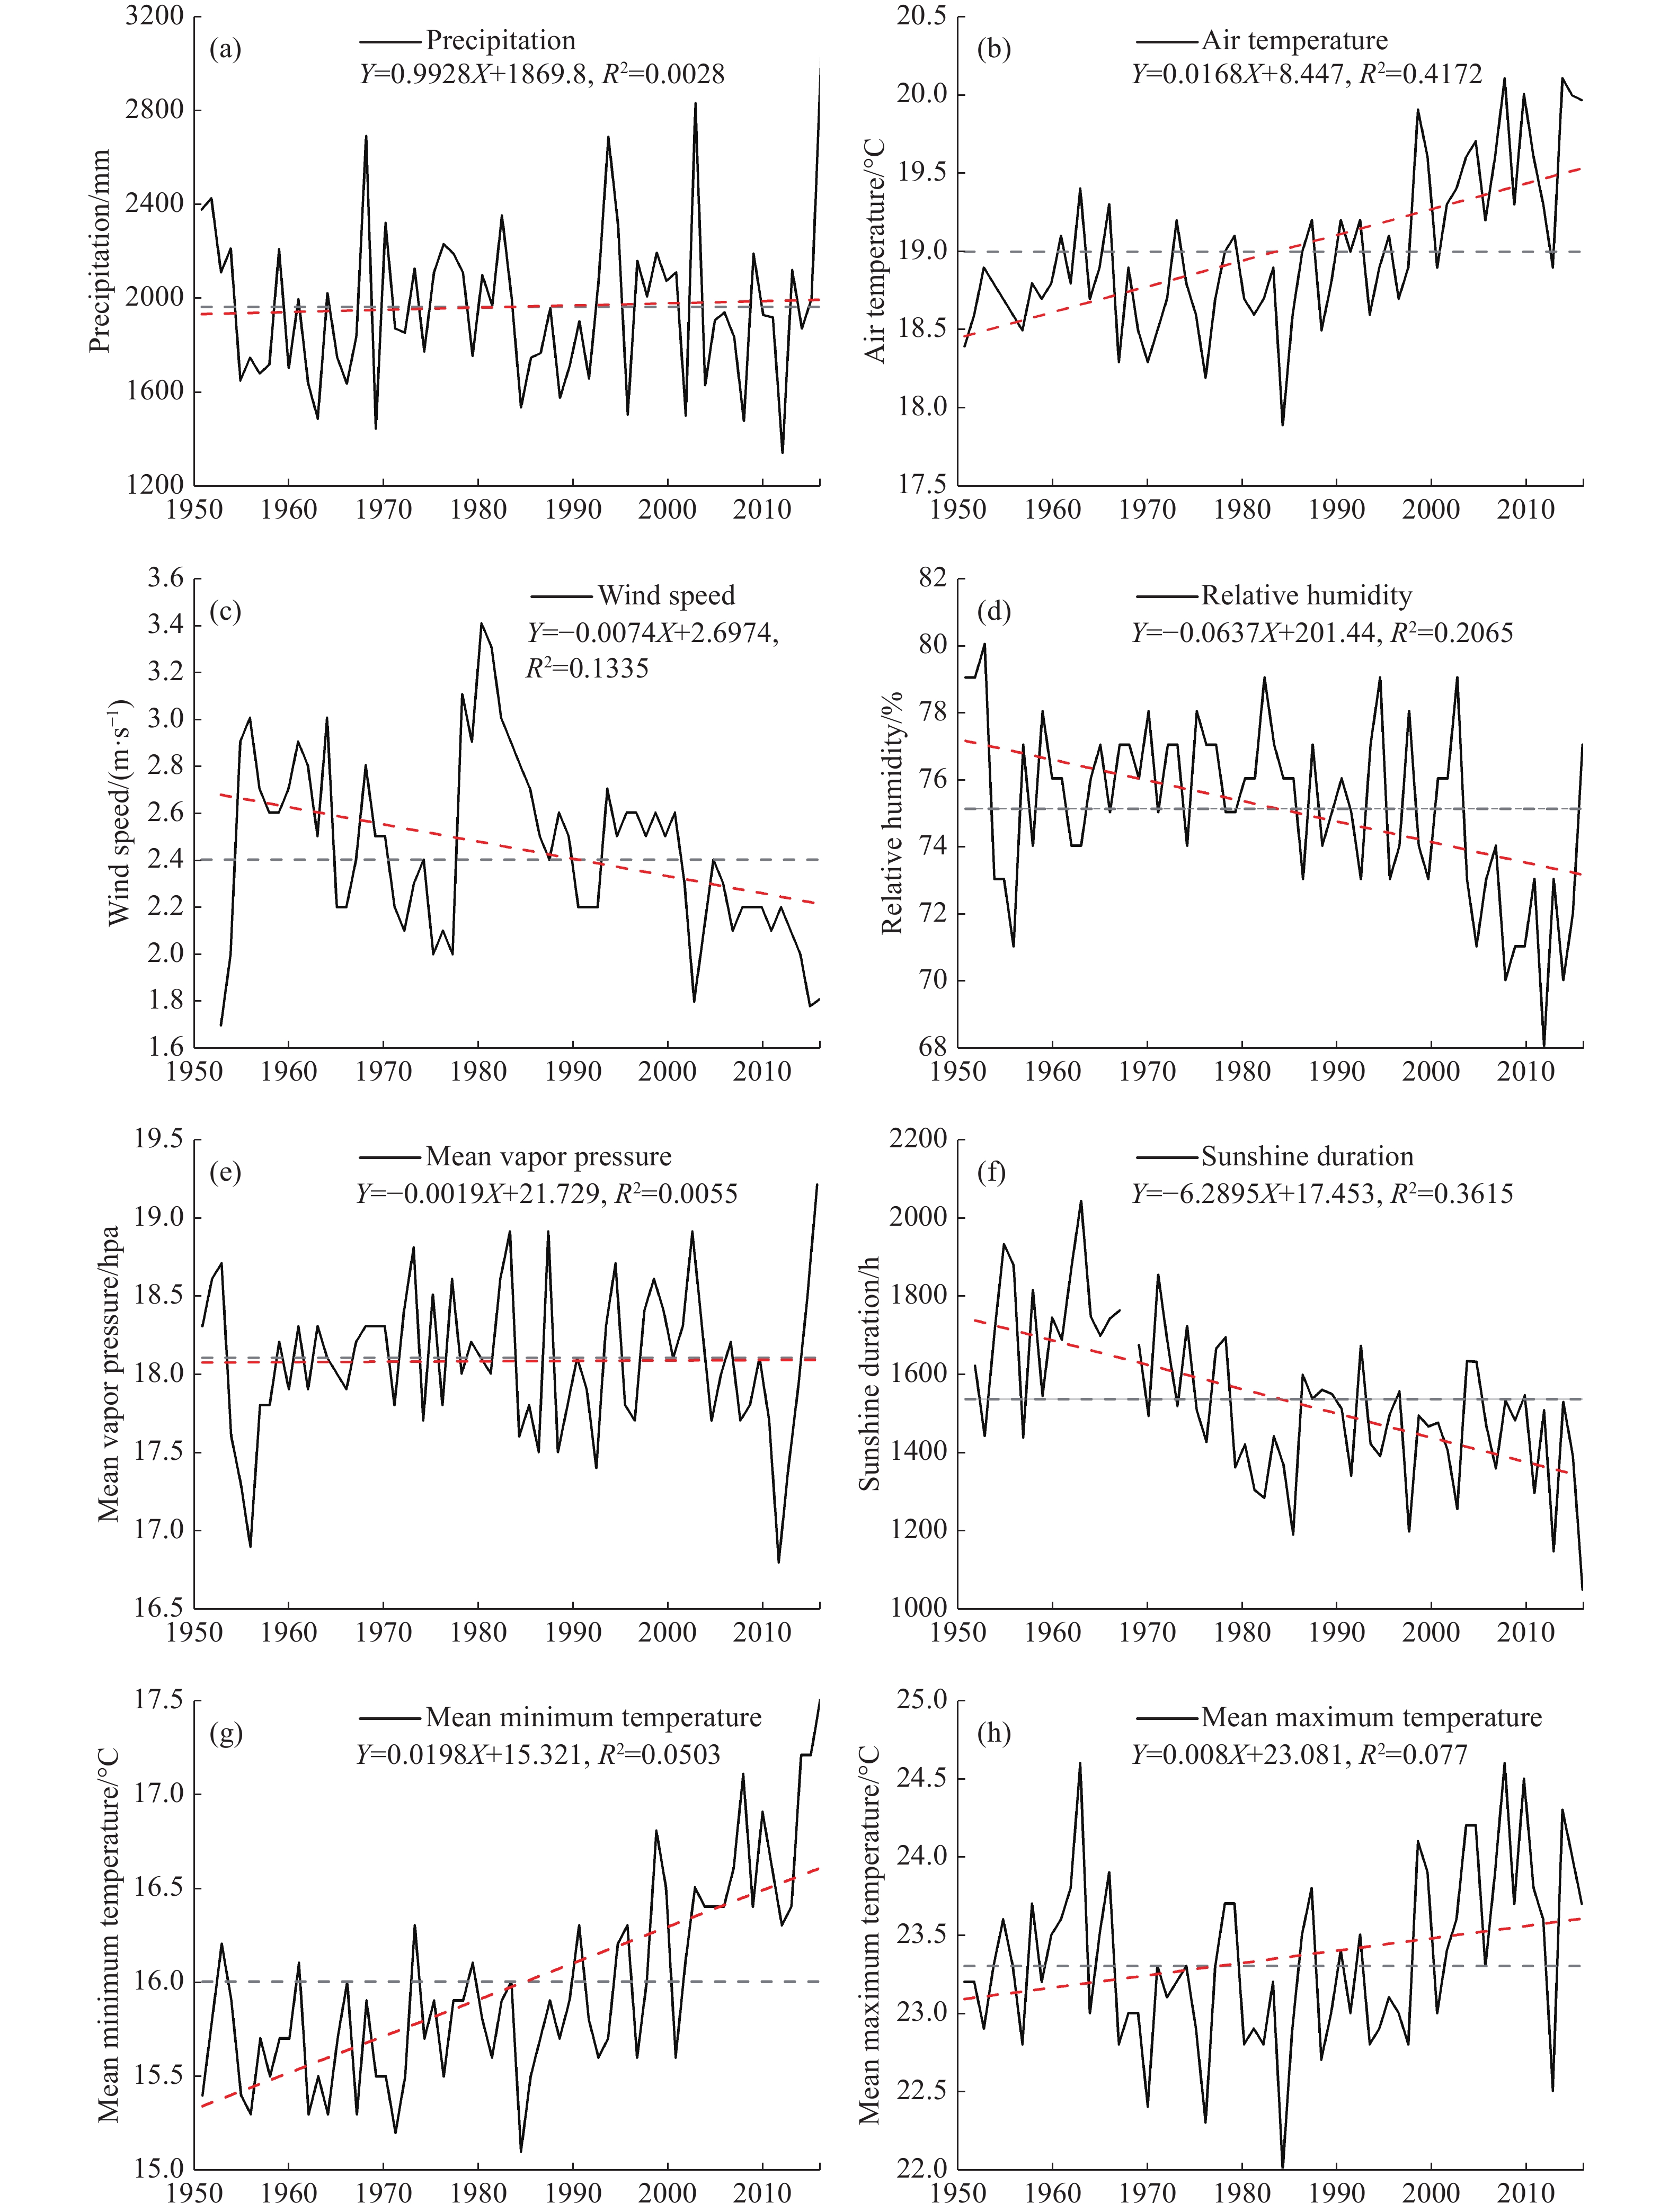
Figure 6. Annual variability trends of meteorological factors during 1951–2015. (a) precipitation, (b) air temperature, (c) wind speed, (d) relative humidity, (e) mean vapor pressure, (f) sunshine duration, (g) minimum temperature, and (h) maximum temperature. Red dotted line represents linear regression of different meteorological variables, and gray dotted line represents 65-year average value.
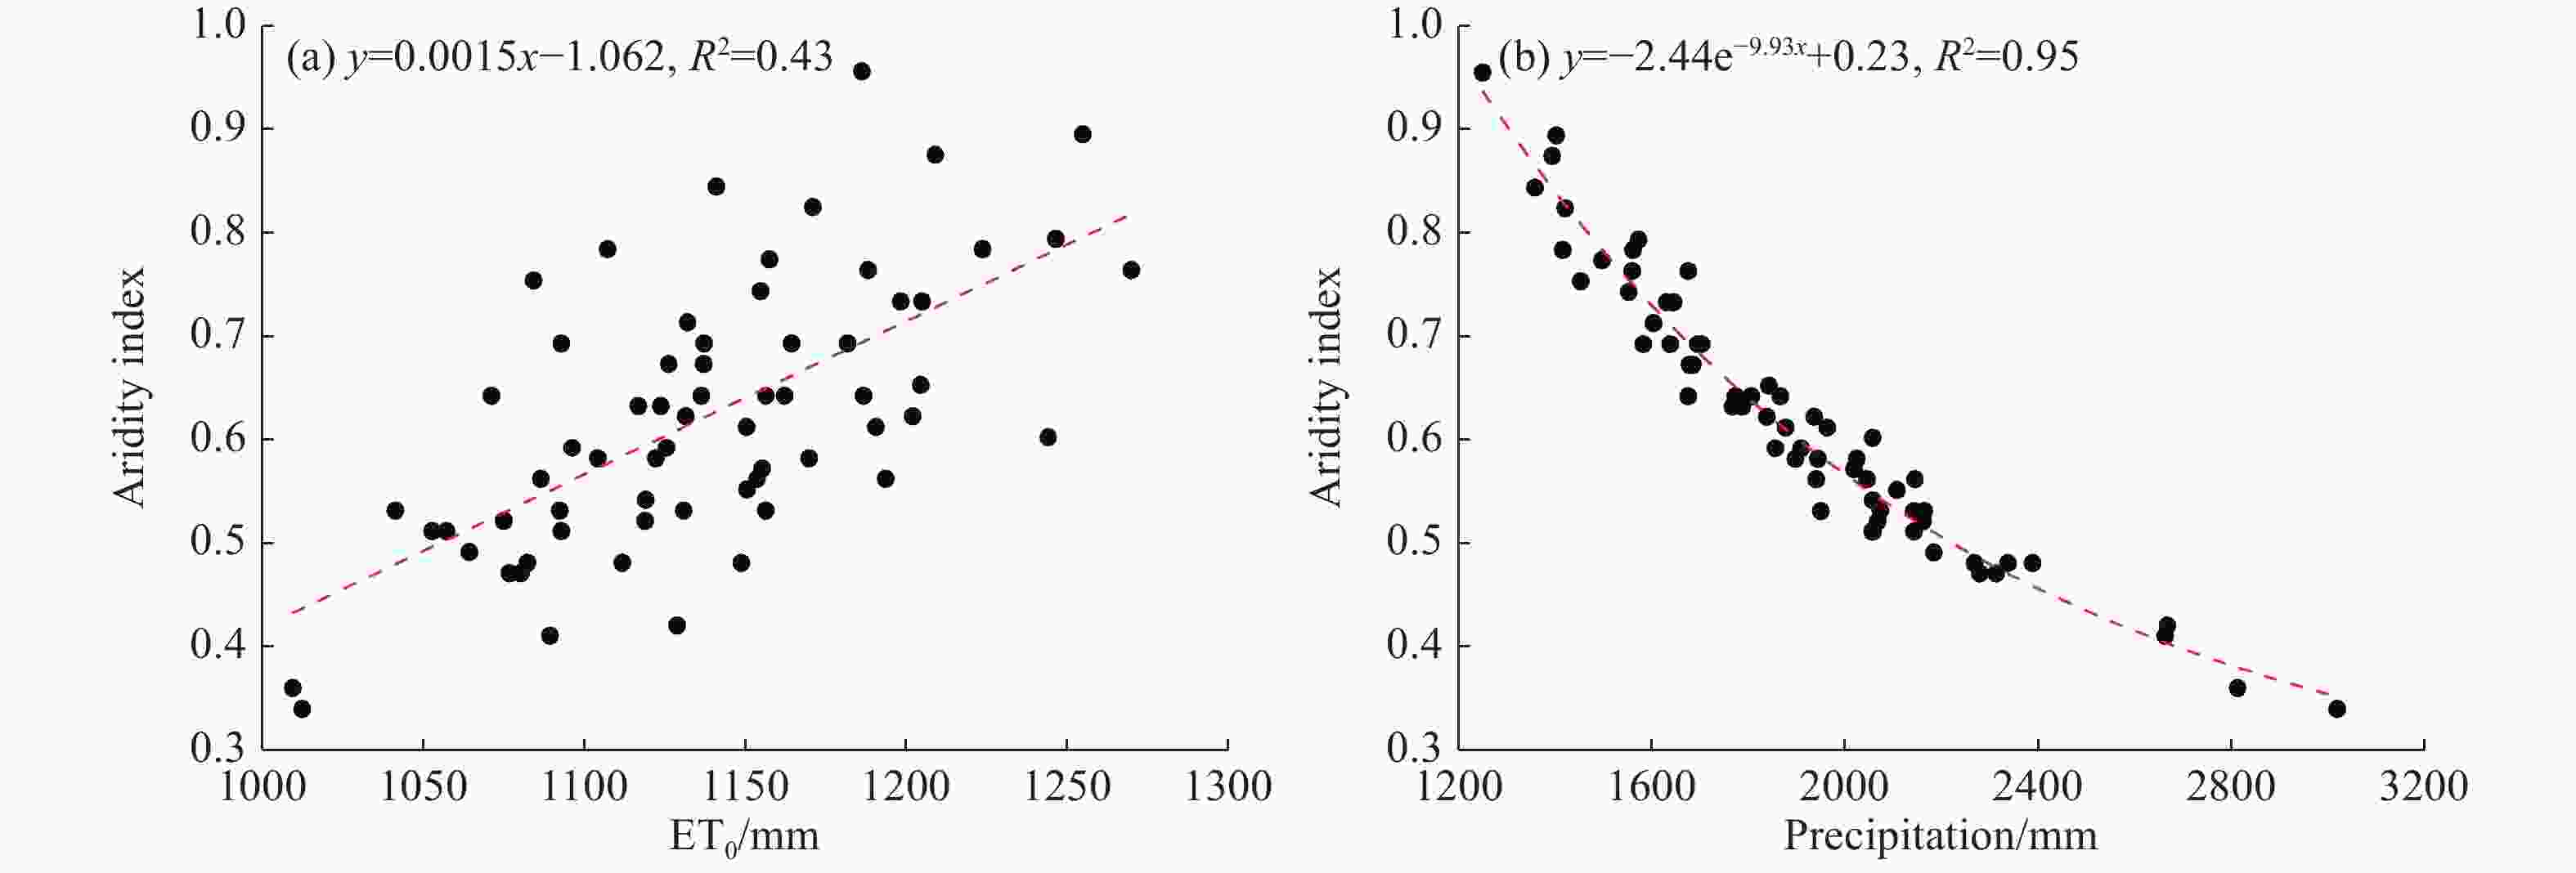
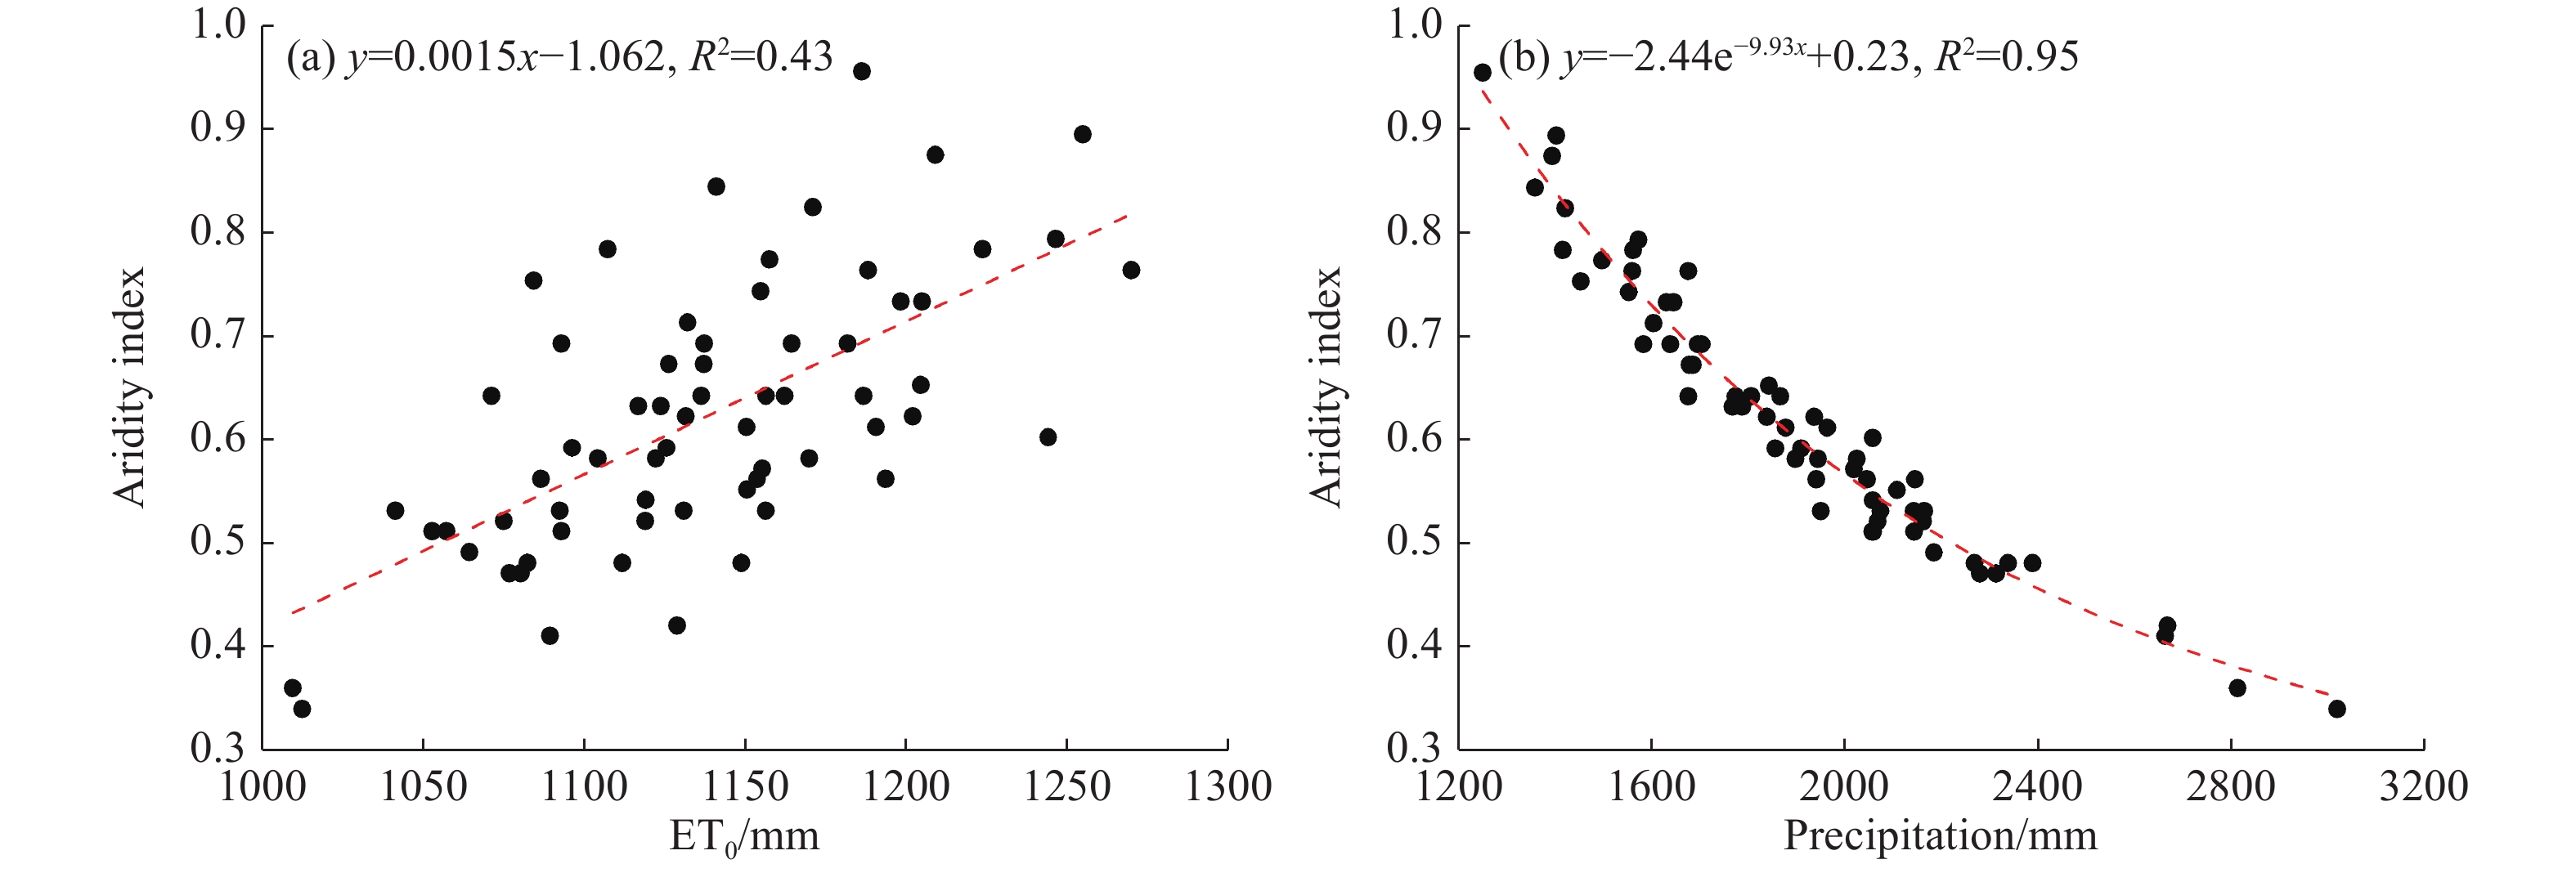
Figure 7. Scatter plots of the (a) relationship between ET0 and aridity index (ET0/P) and (b) precipitation and aridity index for Guilin, China during 1951–2015. Red dashed line is the fitted line.
Table 1. Meteorological station site and mean meteorological variables of Guilin, China
Station Longitude
(°E)Latitude
(°N)Altitude
(m)Tmean RH
(%)U10
(m s−1)Sunshine
duration (h)Vapor pressure
(hpa)Precipitation
(mm a−1)Guilin 110.30 25.32 164.40 19.0 75.1 2.4 1533.1 18.1 1902.6 Note: RH represents relative humidity; Tmean is the mean air temperature; U10 is the wind speed at the height of 10 m.  下载: 导出CSV
Table 2. Interdecadal variation in the annual and seasonal reference evapotranspiration (ET0) in Guilin, China
Annual
ET0 (mm)Magnitude
(%)Spring
ET0 (mm)Magnitude
(%)Summer ET0 (mm) Magnitude
(%)Autumn ET0 (mm) Magnitude
(%)Winter
ET0 (mm)Magnitude
(%)1950s 1164.17 − 208.57 − 375.74 − 390.75 − 189.5 − 1960s 1167.32 0.3 207.49 −0.5 386.8 2.9 390.08 −0.2 183.32 −3.3 1970s 1130.66 −3.1 201.95 −2.7 367.04 −5.1 375 −3.9 185.46 1.2 1980s 1117.85 −1.1 201.44 −0.3 371.35 1.2 361.37 −3.6 182.7 −1.5 1990s 1126.85 0.8 205.62 2.1 354.46 −4.5 375.46 3.9 191.49 4.8 2000s 1136.89 0.9 209.48 1.9 362.59 2.3 382.44 1.9 182.99 −4.4 2010–2015 1104.9 −2.8 204.56 −2.3 363.2 0.2 364.44 −4.7 171.9 −6.1 Mean 1135.52 −0.9 205.59 −0.3 368.74 −0.5 377.08 −1.1 183.91 −1.6
下载: 导出CSV
Table 3. Mean, maximum and minimum annual and seasonal ET0 (Unit: mm)
Values Annual Spring Summer Autumn Winter Mean 1137.9 205.7 369.2 378.0 184.8 Maxmium 1269.5 243.1 424.7 444.2 225.6 Minimum 1010.4 178.5 325.5 320.3 133.7 Ratio (%) - 18.1 32.4 33.2 16.2
下载: 导出CSV
Table 4. Annual, seasonal changing rates of reference evaporation (ET0) and climate factors in Guilin, China
Time ET0
(mm 10a−1)Precipitation
(mm 10a−1)Mean temperature
(°C 10a−1)Wind
speed
(m s−1 10a−1)Relative humidity
(% 10a−1)Vapor pressure (hpa 10a−1) Sunshine duration
(h 10a−1)Minimum
temperature
(°C 10a−1)Maximum temperature (°C 10a−1) Annual −8.02* 9.93 0.17* −0.074* −0.64* −0.02 −62.90* 0.20* 0.08* Spring 0.134 −14.39 0.253* −0.114* −0.58* 0.086 −84.45 0.279* 0.214* Summer −4.231* 28.81 0.102* −0.023 −0.358* 0.016 −14.62* 0.097* 0.043 Autumn −2.871 −11.872 0.153* −0.026 −0.78* −0.065 −18.27* 0.184* 0.046 Winter −1.138 7.715 0.154* −0.143* −0.727* −0.026* −14.695 0.239* 0.017 * indicate significant at the level of 0.05.
下载: 导出CSV
Table 5. Correlation coefficients between annual and seasonal climate factors and potential evapotranspiration in Guilin, China during 1951–2015
Precipitation Mean temperature Wind speed Relative humidity Vapor pressure Sunshine duration Maximum temperature Minimum temperature Annual −0.517** 0.129 0.414** −0.584** −0.525** 0.784** 0.489** −0.187 Spring −0.300* 0.555** −0.01 −0.658** 0.194 0.767** 0.728** 0.349** Summer −0.571** 0.451** 0.24 −0.569** −0.146 0.833** 0.690** 0.046 Autumn −0.693** 0.510** 0.366** −0.730** −0.508** 0.812** 0.718** 0.191 Winter −0.664** 0.275* 0.470** −0.836** −0.640** 0.761** 0.638** −0.13 ** significant correlation at the 99% confidence level (two−tailed); * significant correlation at the 95% confidence level (two−tailed). Noting that the maximum correlation coefficients in each season are shown in bold.
下载: 导出CSV
Table 6. Summary of previously estimated ET0 or pan evaporation (ETp) trends in China, and the primary causes of the trend
Location ET0 or ETp trend
(mm/10a)Study period Cause Source China −3.0, ↓ 1955−2000 Solar irradiance Liu et al. 2004b China −8.56, ↓ 1961−2008 Wind speed
Sunshine durationYin et al. 2010 China −6.02, ↓ 1960−2007 − Liu et al. 2012 China −3.45, ↓ 1956−2015 Wind speed Fan et al. 2016 China −6.84, ↓ 1961−2013 Wind speed
Sunlight durationWang et al. 2017 China < −6.0, ↓ 1960−2012 Wind speed Chai et al. 2018 Yangtze River basin −12.4, ↓ 1960−2000 Net radiation
Wind speedXu et al. 2006 Yangtze River basin −3.26, ↓
ETp: −2.98, ↓1961−2000 Wind speed
Net radiationWang et al. 2007 Yangtze River Delta (Eastern China) 22.51, ↑ 1957−2014 Relative humidity
Wind speedXu et al. 2017 Yellow River Basin 0.02, ↑ 1961−2006 Air temperature
Relative humidityLiu et al. 2010 Yellow River Basin −12.9, ↓ 1961−2012 Sunshine hours Zhang et al. 2015 Yellow River Basin −4.689, ↓ 1960−2012 Wind speed
Solar radiationShe et al. 2017 Heihe River Basin 2.01, ↑ 1961−2014 Relative humidity Du et al. 2016 Songhua River Basin 4.90, ↑ 1961−2010 Mean air temperature Wen et al. 2014 Wei River Basin − 1959−2008 Relative humidity
Air temperatureZuo et al. 2012 The North China Plain ETp: −7.09, ↓ 1981−2013 Radiation
Wind speedMo et al. 2017 Loess Plateau Region −10.30, ↓ 1961−2012 Wind speed Zhao et al. 2014 Tibetan Plateau −9.6, ↓ 1960−2012 − Wang et al. 2014 Qinghai−Tibetan Plateau −24.0, ↓ 1970−2011 Net radiation
Wind speedZhang et al. 2018b Northwest China −30.0, ↓ 1955−2008 Wind speed Huo et al. 2013 Shenzhen City − 1954−2012 Sunshine hours
Vapor pressure deficitLiu et al. 2015 Yunnan province −6.50, ↓ 1961−2004 Sunshine duration Fan and Thomas 2013 Guizhou province −4.476, ↓ 1959−2011 Sunshine duration Gao et al. 2016 Southwest China −4.34, ↓ 1960−2013 Sunshine duration
Wind speedZhao et al. 2018 Southwest China −5.13, ↓ 1961−2012 Net radiation Sun et al. 2016 Note: The symbol “↑” and “↓” represent increasing and decreasing trends, respectively. The symbol “−” indicates that ET0 trend was not estimated. Noting that ETp specified in the table refers to pan evaporation, and the others represent ET0 estimated by the FAO56 Penman–Monteith method.
下载: 导出CSV
-
Allen RG, Pereira LS, Rass D, et al. 1998. Corp evapotranspiration guidelines for computing crop water requirements-FAO irrigation and drainage paper 56. Food and Agriculture Origanization of the United Nation: Rome. Breña-Naranjo JA, Laverde-Barajas MÁ, Pedrozo-Acuña A. 2017. Changes in pan evaporation in Mexico from 1961-2010. International Journal of Climatology, 37: 204−213. doi: 10.1002/joc.4698 Burn DH, Hesch NM. 2007. Trends in evaporation for Canadian Prairies. Journal of Hydrology, 336: 61−73. Cao JH, Wu X, Huang F, et al. 2018. Global significance of the carbon cycle in the karst dynamic system: Evidence from geological and ecological processes. China Geology, 1: 17−27. Chattopadhyay N, Hulme M. 1997. Evaporation and potential evapotranspiration in India under conditions of recent and future climate change. Agricultural and Forest Meteorology, 87: 55−73. Chai RF, Sun SL, Chen HS, et al. 2018. Changes in reference evapotranspiration over China during 1960-2012: Attributions and relationships with atmospheric circulation. Hydrological Processes, 32: 3032−3048. Chen XZ, Liu XD, Zhou GY, et al. 2015. 50-year evapotranspiration declining and potential causations in subtropical Guangdong province, southern China. Catena, 128: 185−194. Chen X, Buchberger SG. 2018. Exploring the relationships between warm-season precipitation, potential evaporation, and “apparent” potential evaporation at site scale. Hydrology and Earth System Sciences, 22: 4535−4545. Dadaser-Celik F, Cengiz E, Guzel O. 2016. Trends in reference evapotranspiration in Turkey: 1975-2006. International Journal of Climatology, 36: 1733−1743. Du CY, Yu JJ, Wang P, et al. 2016. Reference evapotranspiration changes: Sensitivities to and contributions of meteorological factors in the Heihe River Basin of Northwestern China (1961-2014). Advances in Meteorology: 1−17. Deng SL, Chen T, Yang N, et al. 2018. Spatial and temporal distribution of rainfall and drought characteristics across the Pearl River Basin. Science of the Total Environment, 619-620: 28−41. Fan ZX, Thomas A. 2013. Spatiotemporal variability of reference evapotranspiration and its contributing climatic factors in Yunnan Province, SW China, 1961-2004. Climatic Change, 116: 309−325. doi: 10.1007/s10584-012-0479-4 Fan JL, Wu LF, Zhang FC, et al. 2016. Climate change effects on reference crop evapotranspiration across different climatic zones of China during 1956-2015. Journal of Hydrology, 542: 923−937. doi: 10.1016/j.jhydrol.2016.09.060 Fan ZX, Thomas A. 2018. Decadal changes of reference crop evapotranspiration attribution: Spatial and temporal variability over China 1960-2011. Journal of Hydrology, 560: 461−470. Feng Y, Cui NB, Wei XP, et al. 2014. Temporal-spatial distribution characteristics and causes analysis of reference crop evapotranspiration in hilly area of central Sichuan. Transactions of the Chinese Society of Agricultural Engineering, 30(14): 78−86. Feng Y, Cui NB, Zhao L, et al. 2017. Spatiotemporal variation of reference evapotranspiration during 1954−2013 in Southwest China. Quaternary International, 441: 129−139. doi: 10.1016/j.quaint.2017.01.023 Fisher JB, Melton F, Middleton E, et al. 2017. The future of evapotranspiration: Global requirements for ecosystem functioning, carbon and climate feedbacks, agricultural management, and water resources. Water resources research, 53(4): 2618−2626. Fu GB, Charles SP, Yu JJ. 2009. A critical overview of pan evaporation trends over the last 50 years. Climatic Change, 97: 193−214. doi: 10.1007/s10584-009-9579-1 Fu GB, Yu JJ, Zhang YC, et al. 2011. Temporal variation of wind speed in China for 1961-2007. Theor Appl Climatol, 104: 313−324. Gao XL, Peng SZ, Wang WG, et al. 2016. Spatial and temporal distribution characteristics of reference evapotranspiration trends in Karst area: A case study in Guizhou Province, China. Meteorol Atmos Phys, 128: 677−688. Gao ZD, He JS, Dong KB, et al. 2017. Trends in reference evapotranspiration and their causative factors in the West Liao River Basin, China. Agricultural and Forest Meteorology, 232: 106−117. doi: 10.1016/j.agrformet.2016.08.006 Gong CC, Wang WK, Zhang ZY, et al. 2020. Comparison of field methods for estimating evaporation from bare soil using lysimeters in a semi-arid area. Journal of Hydrology, 590: 125334. Guo XJ, Jiang GH, Gong XP, et al. 2015. Recharge processes on typical karst slopes implied by isotopic and hydrochemical indexes in Xiaoyan Cave, Guilin, China. Journal of Hydrology, 530: 612−622. Huo ZL, Dai XQ, Feng SY, et al. 2013. Effect of climate change on reference evapotranspiration and aridity index in arid region of China. Journal of Hydrology, 492: 24−34. Irmak S, Kabenge I, Skaggs KE, et al. 2012. Trend and magnitude of changes in climate variables and reference evapotranspiration over 116-yr period in the Platte River Basin, central Nebraska-USA. Journal of Hydrology, 420-421: 228−244. Jiang Y, Luo Y, Zhao ZC, et al. 2010. Changes in wind speed over China during 1956-2004. Theoretical Appllied Climatology, 99: 421−430. Jung M, Reichstein MCP, Seneviratne SI, et al. 2010. Recent decline in the global land evapotranspiration trend due to limited moisture supply. Nature, 467: 951−954. Kendall MG. 1975. Rank Correlation Methods. Charles Griffin: London. Li ZX, He YQ, An WL, et al. 2011. Climate and glacier change in southwestern China during the past several decades. Environmental Research Letters, 6: 045404. Liu BH, Xu M, Henderson M, et al. 2004. A spatial analysis of pan evaporation trends in China, 1955-2000. Journal of Geophysical Research Atmospheres, 109: D15102. doi: 10.1029/2004JD004511 Liu CM, Zeng Y. 2004. Changes of pan evaporation in the recent 40 years in the Yellow River basin. Water International, 29 (4): 510−516. Liu CM, Zhang D, Liu XM, et al. 2012. Spatial and temporal change in the potential evapotranspiration sensitivity to meteorological factors in China (1960-2007). Journal of Geographical Sciences, 22(1): 3−14. Liu HJ, Li Y, Josef T, et al. 2014. Quantitative estimation of climate change effects on potential evapotranspiration in Beijing during 1951-2010. Journal of Geographical Sciences, 24(1): 93−112. Liu MX, Xu XL, Sun AY, et al. 2017. Decreasing spatial variability of drought in southwest China during 1959-2013. International Journal of Climatology. 37(13). Liu Q, Yang ZF, Cui BS, et al. 2010. The temporal trends of reference evapotranspiration and its sensitivity to key meteorological variables in the Yellow River Basin, China. Hydrological Processes, 24: 2171−2181. Liu TG, Li LG, Lai JB, et al. 2016. Reference evapotranspiration change and its sensitivity to climate variables in southwest China. Theor Appl Climatol, 125: 499−508. Liu XM, Zhang D, Luo YZ, et al. 2013. Spatial and temporal changes in aridity index in northwest China: 1960 to 2010. Theoretical Applied Climatolpgy, 112: 307−316. Luo KS, Tao FL, Deng XZ, et al. 2017. Changes in potential evapotranspiration and surface runoff in 1981-2010 and the driving factors in Upper Heihe River Basin in Northwest China. Hydrological processes, 31: 90−103. Mann HB. 1945. Non-parametric tests against trend. Econometrica, 13: 245−259. McVicar TR, Roderick ML, Donohue RJ, et al. 2012. Global review and synthesis of trends in observed terrestrial near-surface wind speeds: Implications for evaporation. Journal of Hydrology, 416-147: 182−205. Mitchell JM, Dzerdzeevskii B, Flohn H, et al. 1966. Climatic Change. WMO Technical Note No. 79. World Meteorological Organization: 79. Mo XG, Chen XJ, Hu S, et al. 2017. Attributing regional trends of evapotranspiration and gross primary productivity with remote sensing: A case study in the North China Plain. Hydrology and Earth System Sciences, 21: 295−310. Nouri M, Bannayan M. 2018. Spatiotemporal changes in aridity index and reference evapotranspiration over semi-arid and humid regions of Iran: Trend, cause, and sensitivity analyses. Theoretical and Applied Climatology, 136: 1073−1084. Onyutha C. 2016. Statistical analyses of potential evapotranspiration changes over the period 1930-2012 in the Nile River riparian countries. Agricultural and Forest Meteorology, 226-227: 80−95. Peterson TC, Golubev VS, Groisman PY. 1995. Evaporation losing its strength. Nature, 377: 687−688. Qian WH, Shan XL, Zhu YF. 2011. Ranking regional drought events in China for 1960-2009. Advances in Atmospheric Sciences, 28: 310−321. Roderick ML, Farquhar GD. 2002. The cause of decreased pan evaporation over the past 50 years. Science, 298: 1410−1411. Roderick ML, Farquhar GD. 2004. Changes in Australian pan evaporation from 1970 to 2002. International Journal of Climatology, 24: 1077−1090. Roderick ML, Farquhar GD. 2005. Changes in New Zealand pan evaporation since the 1970s. International Journal of Climatology, 25: 2013−2039. Rotstayn LD, Roderick ML, Farquhar GD. 2006. A simple pan-evaporation model for analysis of climate simulations: Evaluation over Australia. Geophysical Research Letters, 33: L17715. She DX, Xia J, Zhang YY. 2017. Changes in reference evapotranspiration and its driving factors in the middle reaches of Yellow River Basin, China. Science of the Total Environment, 607-608: 1151−1162. Su XL, Singh VP, Niu JP, et al. 2015. Spatiotemporal trends of aridity index in Shiyang River basin of northwest China. Stochastic Environmental Research Risk Assessment, 29: 1571−1582. Sun SL, Chen HS, Wang GJ, et al. 2016. Shift in potential evapotranspiration and its implications for dryness/wetness over Southwest China. Journal of Geophysical Research Atmospheres, 121(6): 9342−9355. Sun SL, Chen HS, Ju WM, et al. 2017. On the coupling between precipitation and potential evapotranspiration: Contributions to decadal drought anomalies in the Southwest China. Climate Dynamic, 48: 3779−3797. Tabari H, Aghajanloo M-B. 2013. Temporal pattern of aridity index in Iran with considering precipitation and evapotranspiration trends. International Journal of Climatology, 33: 396−409. Tebakari T, Yoshitani J, Suvanpimol C. 2005. Time-space trend analysis in pan evaporation over Kingdom of Thailand. Journal of Hydrologic Engineering, 10(3): 205−215. Wang LZ, Cao LG, Deng XJ, et al. 2014. Changes in aridity index and reference evapotranspiration over the central and eastern Tibetan Plateau in China during 1960−2012. Quaternary International, 349: 280−286. Wang P, Yamanaka T, Qiu GY. 2012b. Causes of decreased reference evapotranspiration and pan evaporation in the Jinghe River catchment, northern China. Environmentalist, 32: 1−10. Wang WG, Shao QX, Peng SZ, et al. 2012a. Reference evapotranspiration change and the causes across the Yellow River Basin during 1957-2008 and their spatial and seasonal differences. Water resources research, 48: W05530. Wang Y, Jiang T, Bothe O, et al. 2007. Changes of pan evaporation and reference evapotranspiration in the Yangtze River basin. Theoretical and Applied Climatology, 90: 13−23. Wang ZL, Xie PW, Lai CG, et al. 2017. Spatiotemporal variability of reference evapotranspiration and contributing climatic factors in China during 1961−2013. Journal of Hydrology, 544: 97−108. Wen SS, Jiang T, Li XC, et al. 2014. Changes of actual evapotranspiration over the Songhua River Basin from 1961 to 2010. Progressus Inquisitiones de Mutatione Climatis, 10(2): 79−86. Wen M, Cheng DD, Song JX, et al. 2018. Impacts of climate change on aridity index and its spatiotemporal variation in the Loess Plateau of China, from 1961 to 2014. Environmental Earth Sciences, 77: 137. doi: 10.1007/s1265-018-7304-y Xu CY, Gong LB, Jiang T, et al. 2006. Analysis of spatial distribution and temporal trend of reference evapotranspiration and pan evaporation in Changjiang (Yangtze River) catchment. Journal of Hydrology, 327: 81−93. Xu Y, Xu YP, Wang YF, et al. 2017. Spatial and temporal trends of reference crop evapotranspiration and its influential variables in Yangtze River Delta, eastern China. Theoretical Appllied Climatology, 130: 945−958. Yang XM, Li ZX, Feng Q, et al. 2012. The decreasing wind speed in southwestern China during 1969-2009, and possible causes. Quaternary International, 263: 71−84. Yin YH, Wu SH, Chen G, et al. 2010. Attribution analyses of potential evapotranspiration changes in China since the 1960s. Theoretical Appllied Climatology, 101: 19−28. Yonge CJ, Ford DC, Gray J, et al. 1985. Stable isotope studies of cave seepage water. Chemical Geology, 58: 97−105. You GY, Zhang YP, Liu YH, et al. 2013. On the attribution of changing pan evaporation in a nature reserve in SW China. Hydrological Processes, 27: 2676−2682. Yuan DX. 1991. Karst of China. Beijing: Geological Publishing House. Zhao YF, Zou XQ, Zhang JX, et al. 2014. Spatio-temporal variation of reference evapotranspiration and aridity index in the Loess Plateau Region of China, during 1961−2012. Quaternary International, 349: 196−206. Zhao YF, Zou XQ, Cao LG, et al. 2018. Spatiotemporal variations of potential evapotranspiration and aridity index in relation to influencing factors over Southwest China during 1960−2013. Theoretical Appllied Climatology, 133: 711−726. Zhang CG, Liu FG, Shen YJ. 2018b. Attribution analysis of changing pan evaporation in the Qinghai-Tibetan Plateau, China. International Journal of Climatology. Zhang D, Zhang Q, Qiu JM, et al. 2018a. Intensification of hydrological drought due to human activity in the middle reaches of the Yangtze River, China. Science of the Total Environment, 637-638: 1432−1442. Zhang KX, Pan SM, Zhang W, et al. 2015. Influence of climate change on reference evapotranspiration and aridity index and their temporal-spatial variations in the Yellow River Basin, China, from 1961 to 2012. Quaternary International, 380-381: 75−82. Zhang LX, Zhou TJ. 2015. Drought over East Asia: A review. Journal of Climate, 28: 3375−3399. Zhang Q, Xu CY, Chen XH. 2011. Reference evapotranspiration changes in China: Natural processes or human influences? Theor Appl Climatol, 103: 479-488. Zhang ZY, Wang WK, Wang ZF, et al. 2018. Evaporation from bare ground with different water-table depths based on an in-situ experiment in Ordos Plateau, China. Hydrogeology Journal. 26: 1683-1691. Zheng CL, Wang Q. 2015. Spatiotemporal pattern of the global sensitivity of the reference evapotranspiration to climatic variables in recent five decades over China. Stoch Environ Res Risk Assess, 29: 1937−1947. Zuo DP, Xu ZX, Yang H, et al. 2012. Spatiotemporal variations and abrupt changes of potential evapotranspiration and its sensitivity to key meteorological variables in the Wei River basin, China. Hydrological Processes, 26: 1149−1160. -


 点击查看大图
计量
- 文章访问数: 2802
- HTML全文浏览量: 1310
- PDF下载量: 44
- 被引次数: 0


