 E-mail alert
 Rss




Unraveling the drivers of fecal indicator bacteria dynamics in karst spring hyporheic zones: The role of external loading, hydrodynamics, and environmental forcing
-
Abstract: Fecal Indicator Bacteria (FIB) are widely used to assess microbial safety in drinking water sources; however, their dynamics in karst springs hydraulically connected to rivers remain insufficiently understood due to strong hydrodynamic disturbances. This study investigated a large karst spring and its confluent river in South China to examine FIB contamination and the controls on FIB spatiotemporal patterns in the spring outlet hyporheic zone. Most hyporheic-zone and aquifer samples exceeded the relevant limits for Total Coliforms (TC) specified in the Chinese Standard for Groundwater Quality (GB/T 14848–2017) and Standards for Drinking Water Quality (GB 5749–2006), and Fecal Coliforms (FC) were detected in nearly half of the samples. During non-backflow periods, FIB abundances were significantly higher in summer and autumn than in spring and winter. Spatially, FIB generally increased downstream within the hyporheic zone, with high levels confined downstream at low water levels but extending upstream at medium and high water levels. Potential contamination sources included river backflow, aquifer discharge, sewage leakage, and rainfall-induced runoff. FIB were not clearly related to most physicochemical parameters, but were associated with organic matter and water temperature. River backflow strongly influenced FIB dynamics by altering water exchange and the physicochemical environment. During the two observed river backflow events, strong backflow mainly caused sharp FIB increases in the hyporheic zone and aquifer through intensified hydrodynamic transport and particle-associated migration, whereas weak backflow, despite not reaching the aquifer, still increased FIB within the hyporheic zone under reduced dilution and favorable nutritional and microecological conditions. High FIB concentrations and detection frequencies, together with elevated chemical indicators, indicate poorer microbial and chemical water quality in the hyporheic zone. These findings clarify the factors and processes shaping FIB dynamics in karst spring hyporheic zones and support drinking water source protection and microbial water quality management in vulnerable karst regions.
-
Key words:
- Hyporheic zone /
- Fecal indicator bacteria /
- Hydrodynamics /
- Drinking water safety /
- Water environment
-
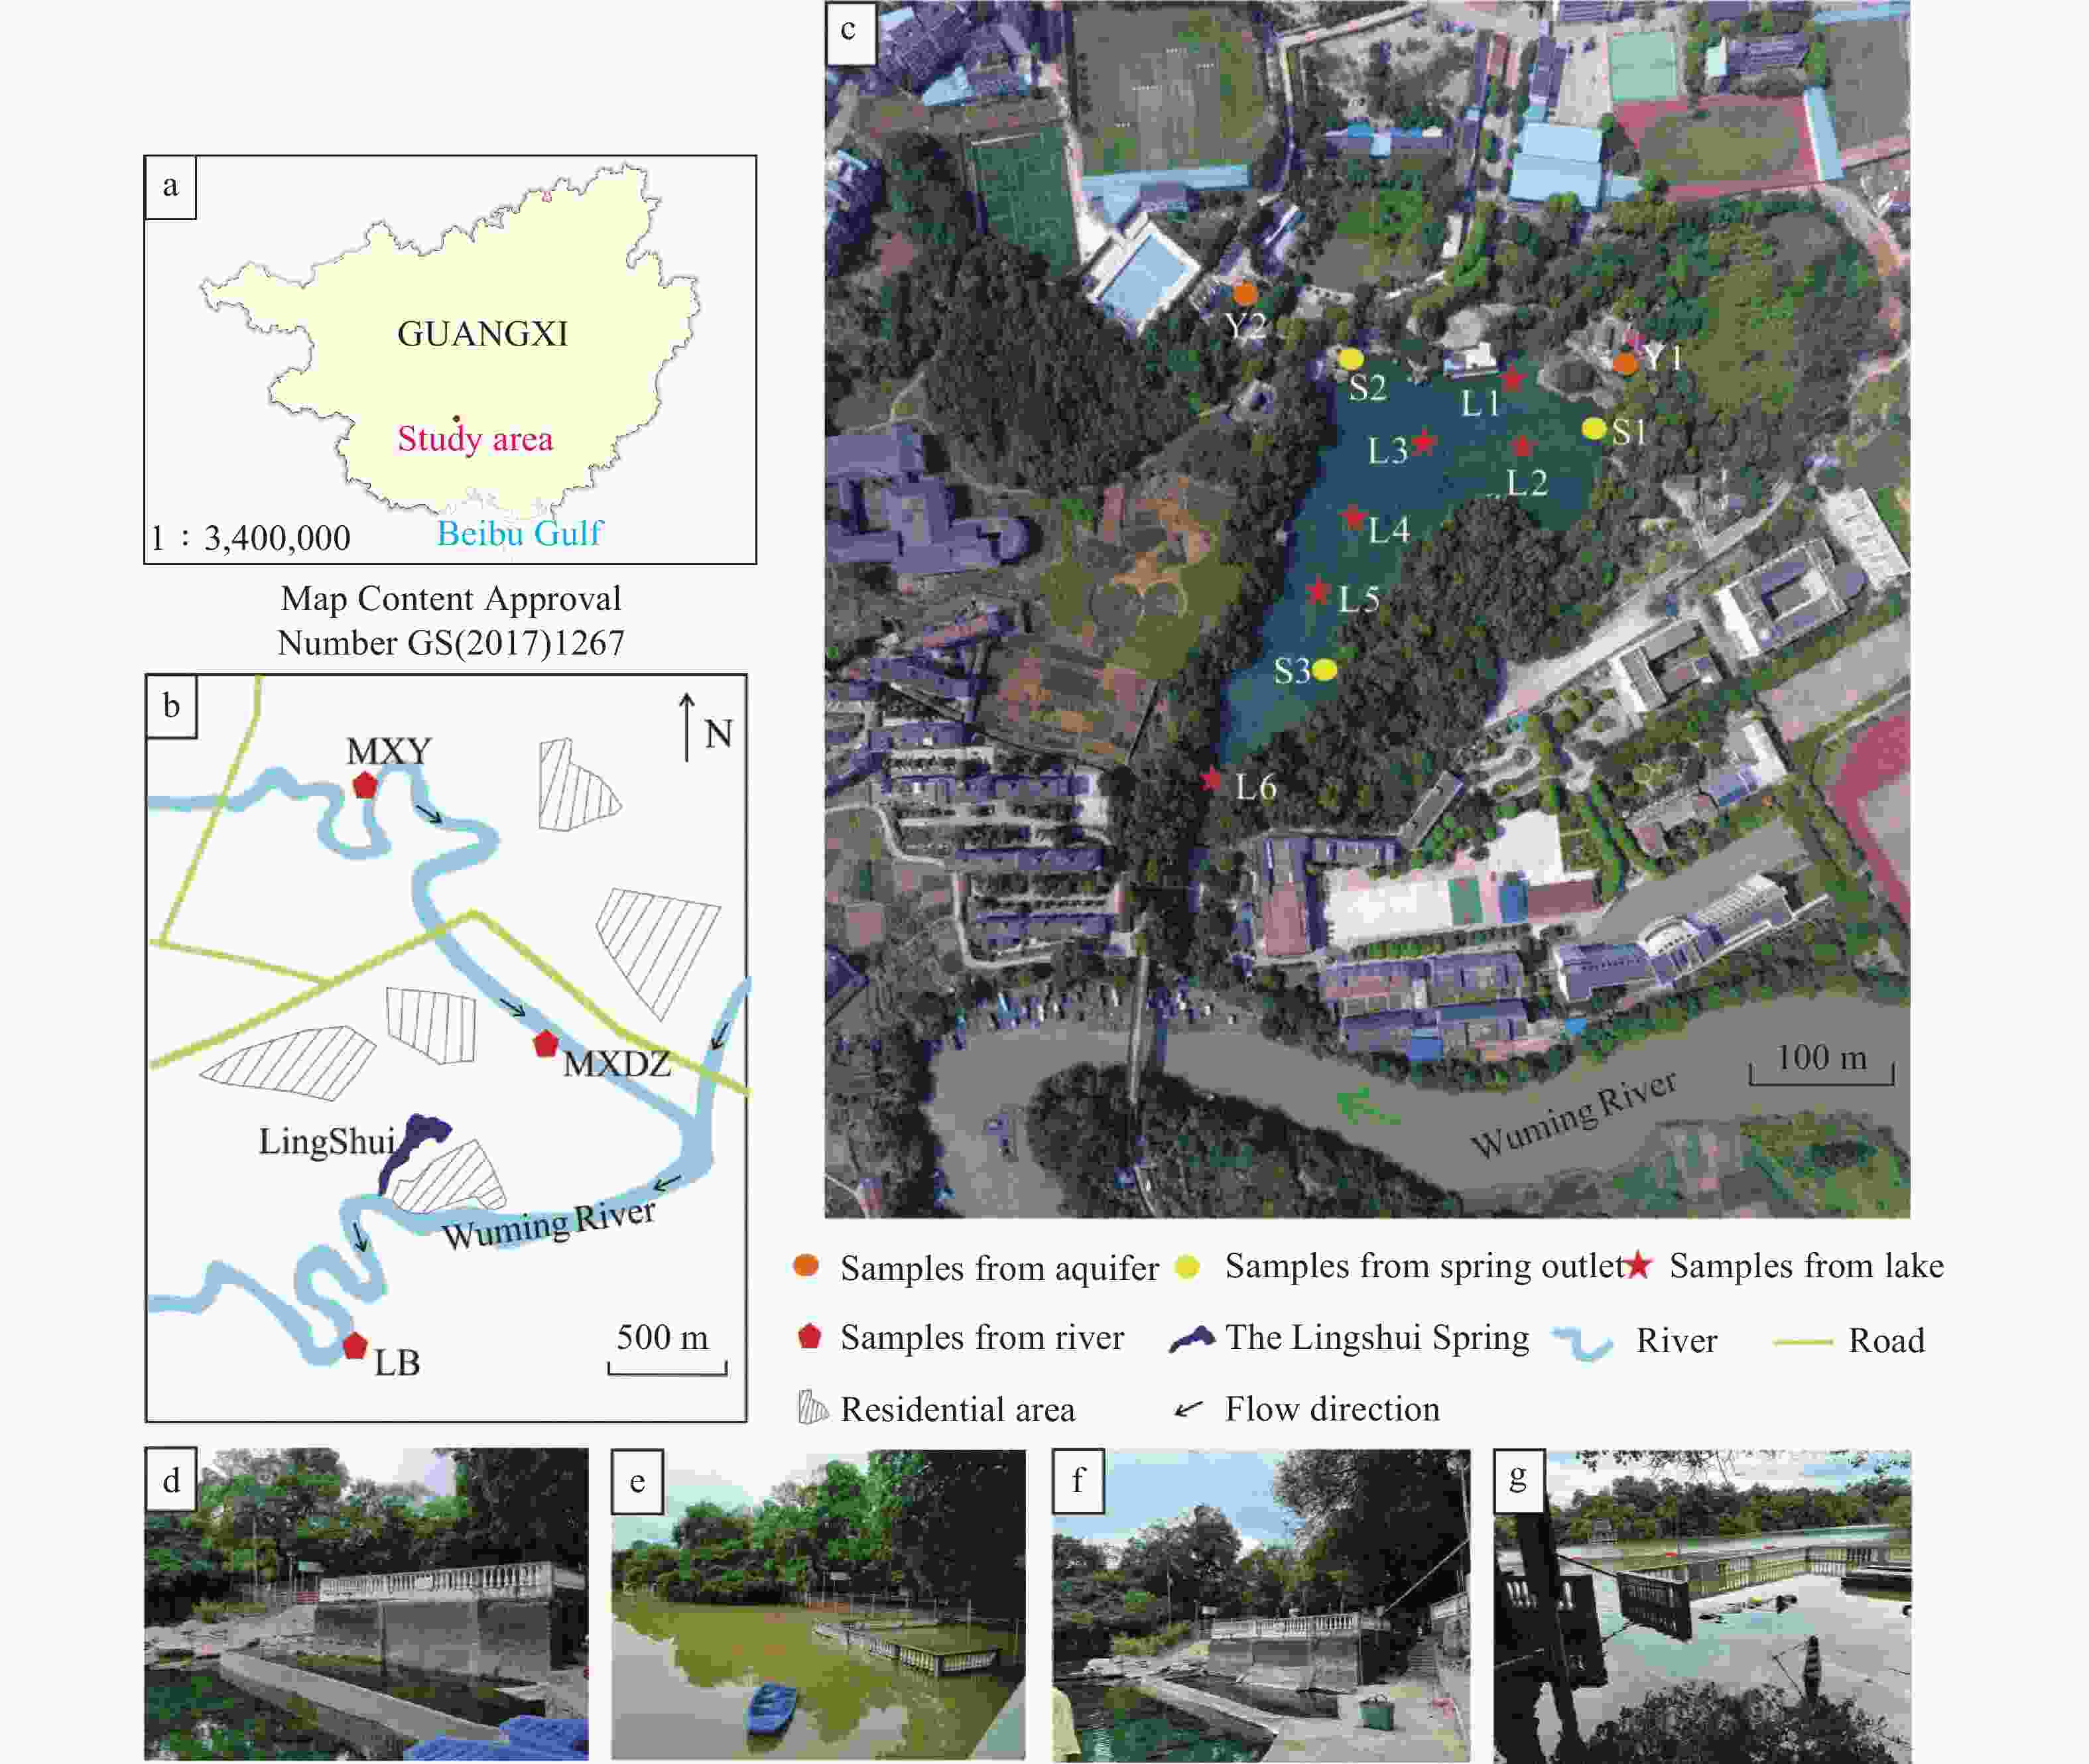
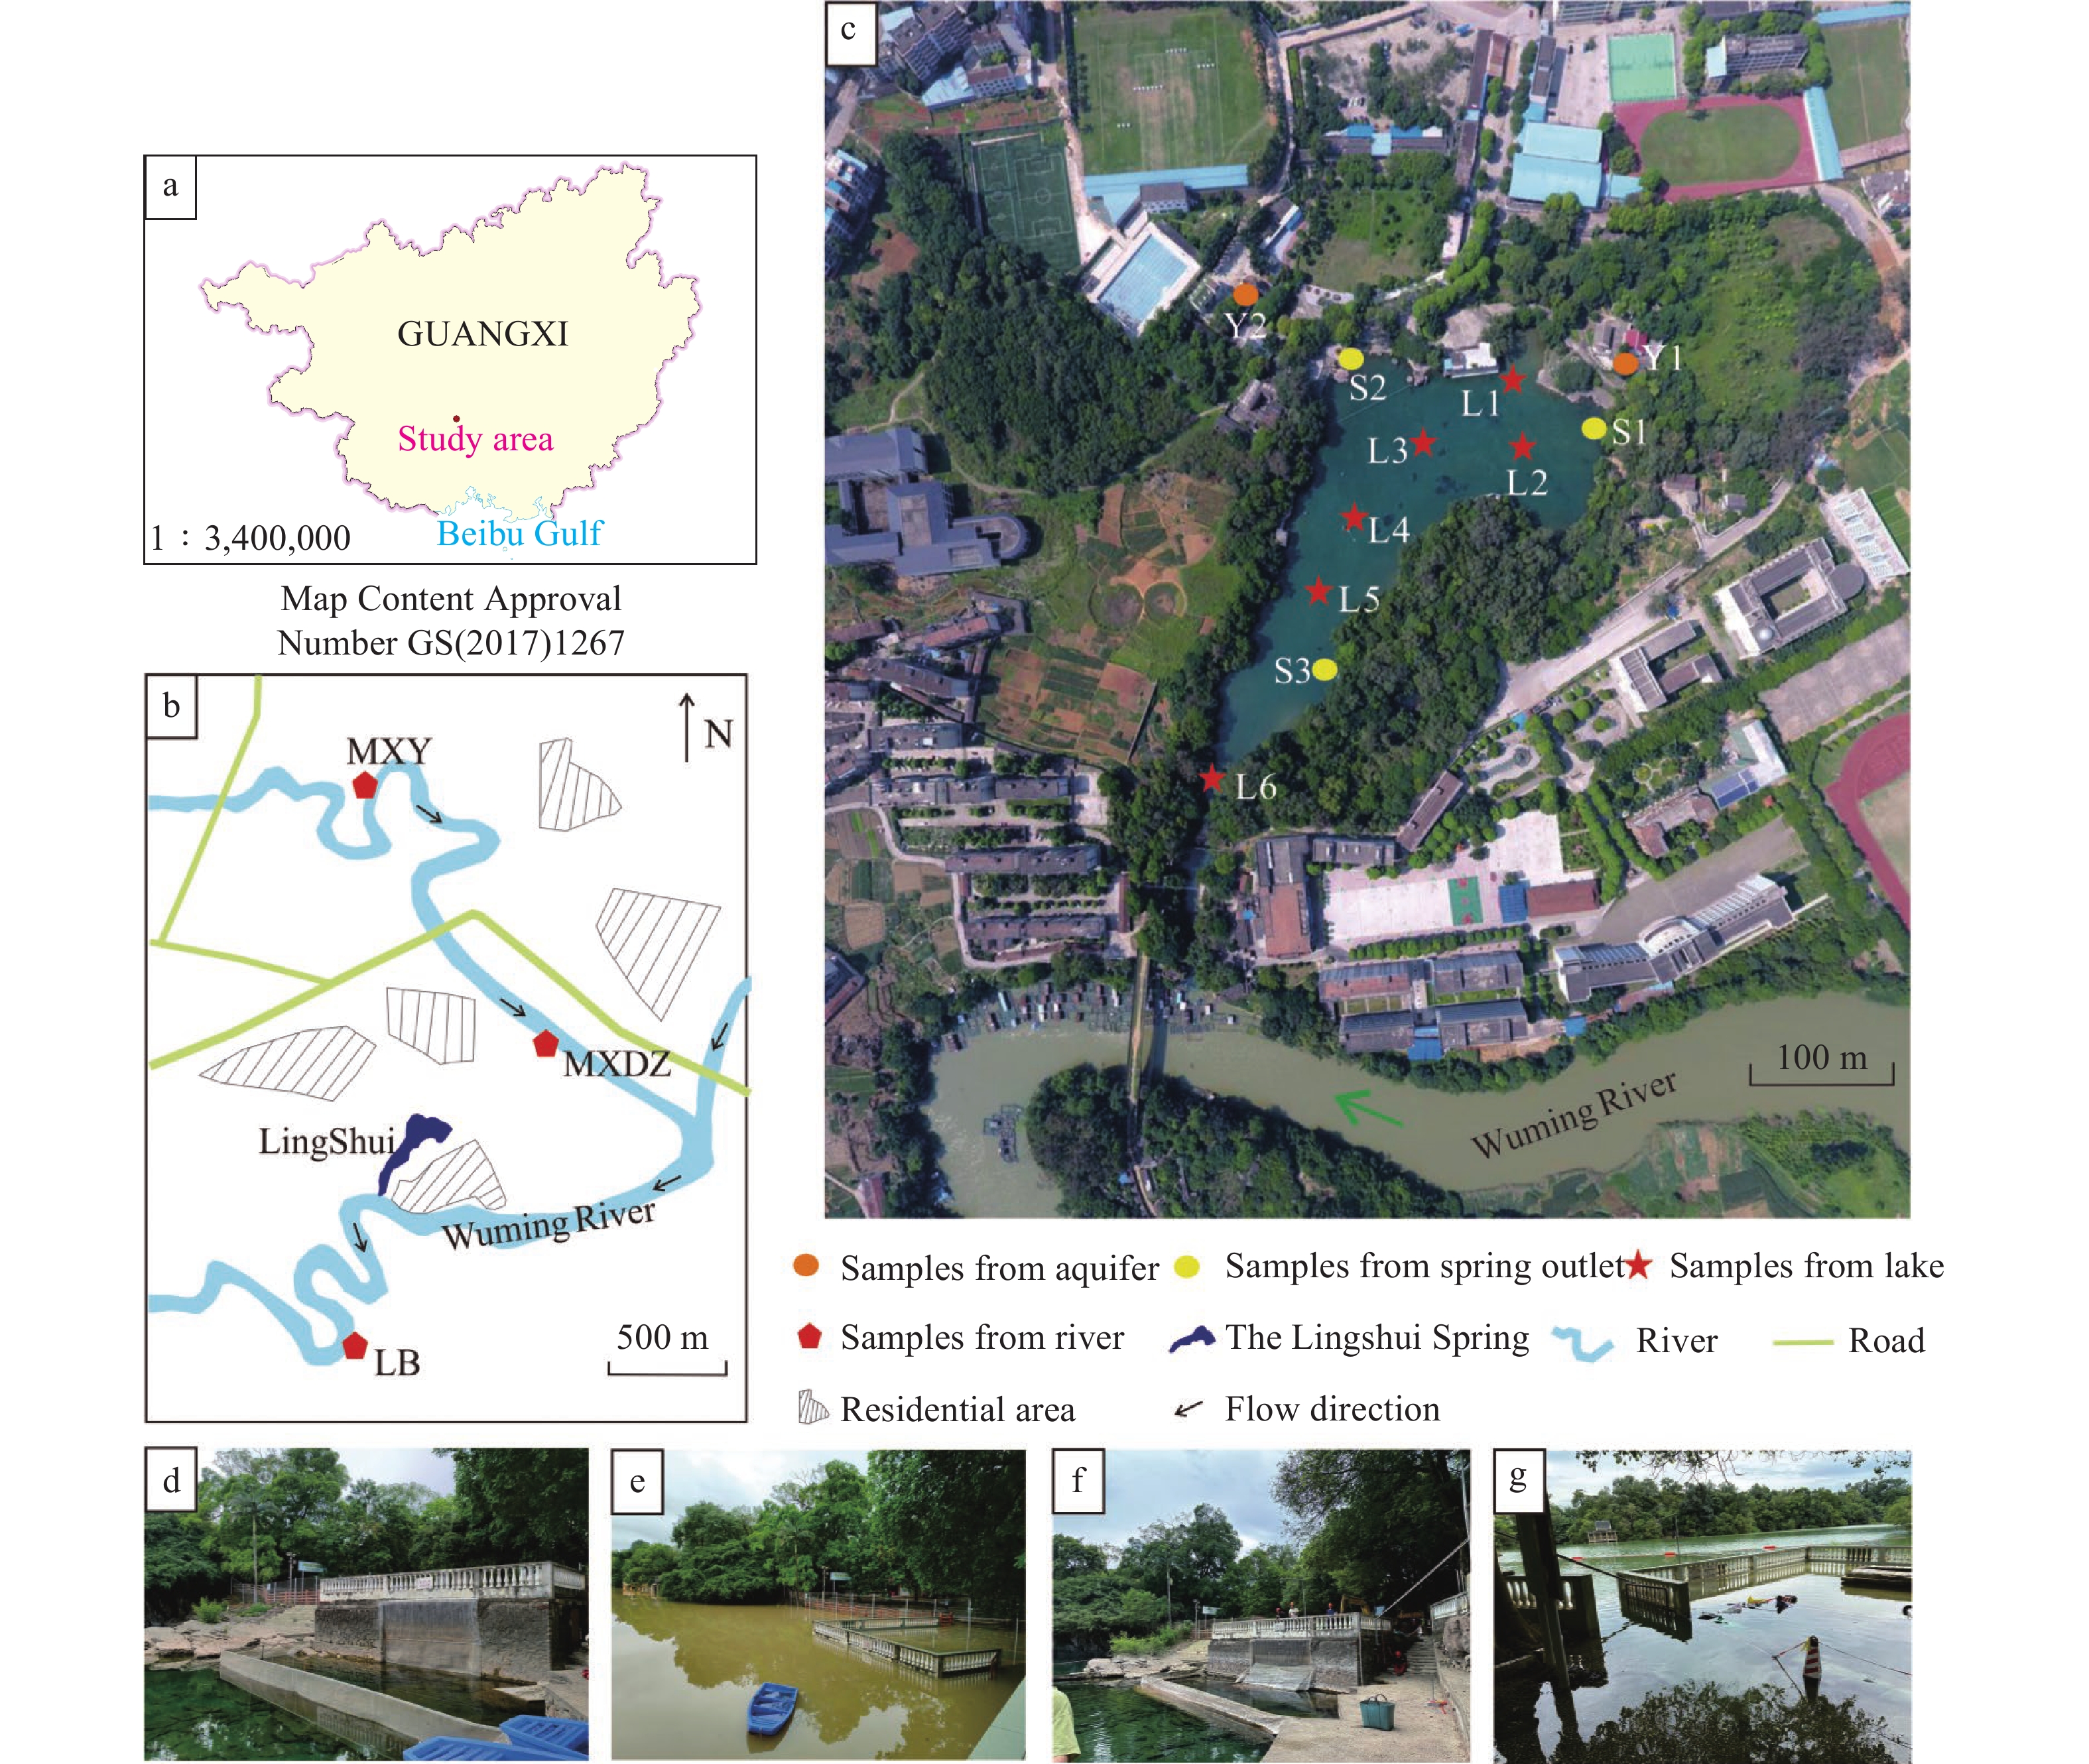
Figure 1. Study area
Notes: (a) Geographic location of the study area in Guangxi, China. (b) Schematic plan of LingShui Spring and adjacent Wuming River, showing the locations of three river sampling sites (MXY, MXDZ, and LB) and surrounding residential areas. (c) Aerial view of the LingShui Spring area, illustrating the sampling points from aquifer (Y1, Y2), spring outlets (S1-S3), lake water (L1-L6), and their spatial distribution within the spring system. (d) Spring outlet (S2) on May 31, 2021 (before backflow). (e) Spring outlet (S2) on June 2, 2021 (during the flooding). (f) Spring outlet (S2) on September 6, 2024 (before backflow). (g) Spring outlet (S2) on September 8, 2024 (during the flooding).
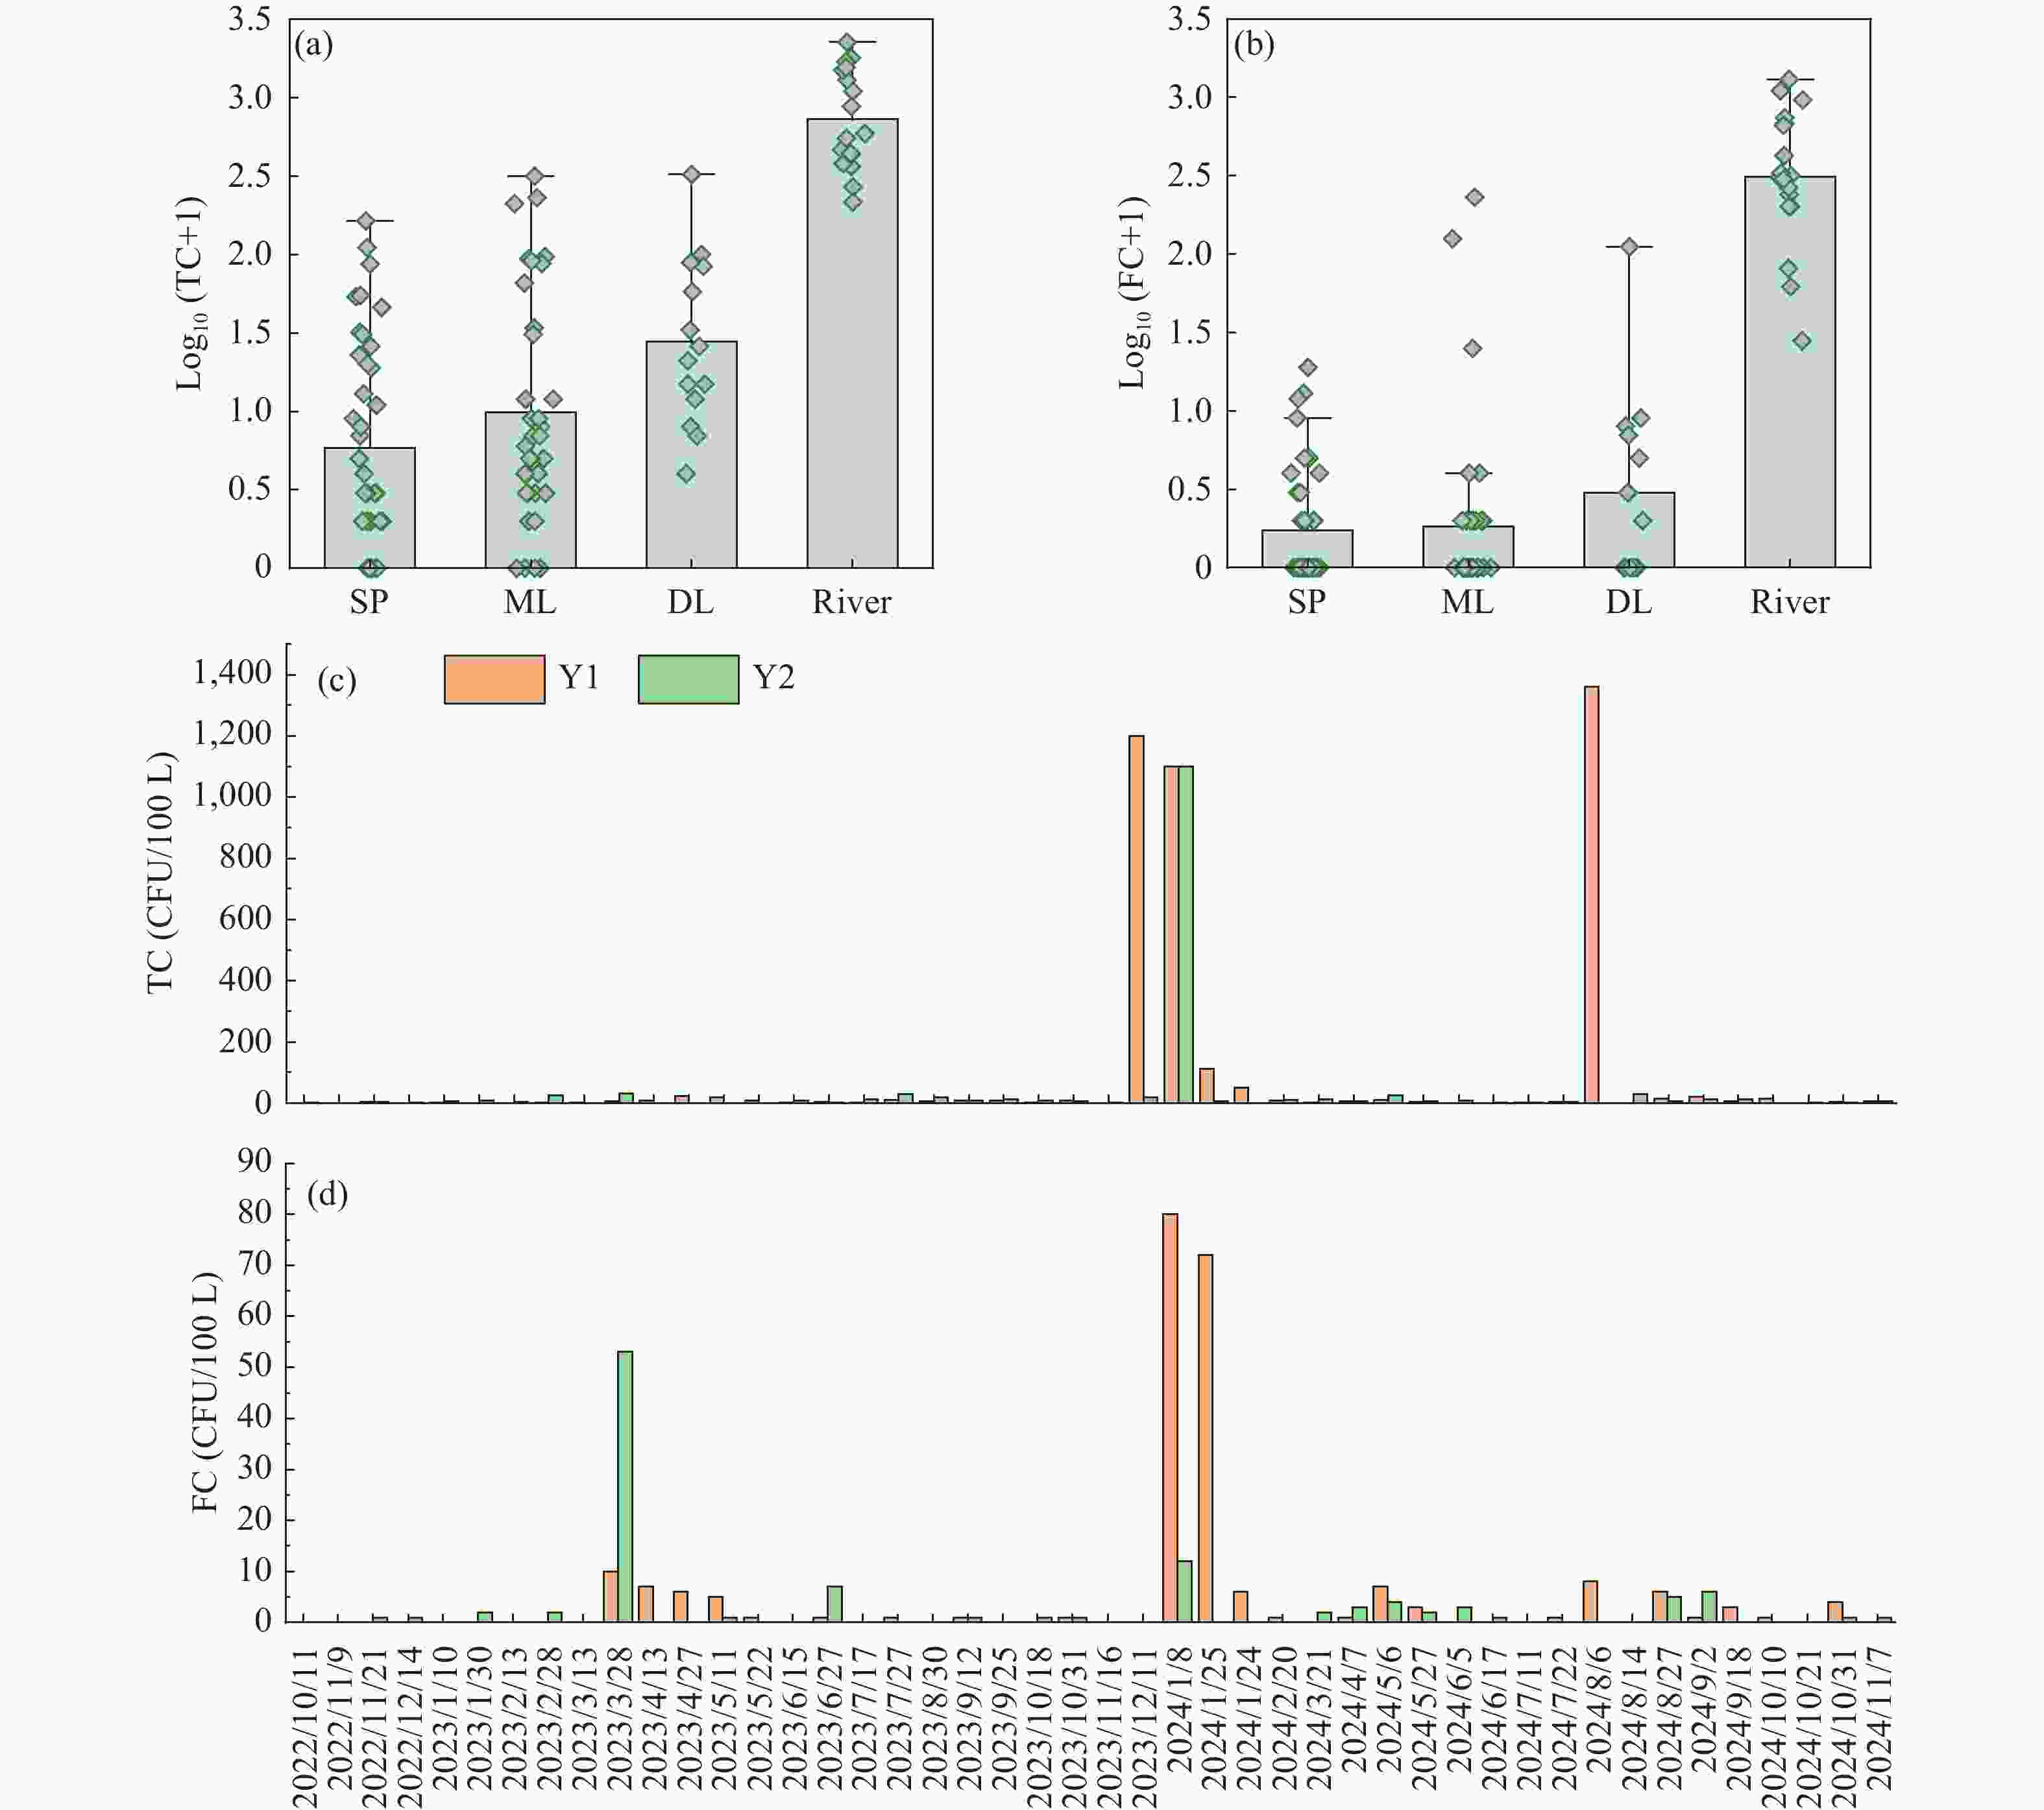
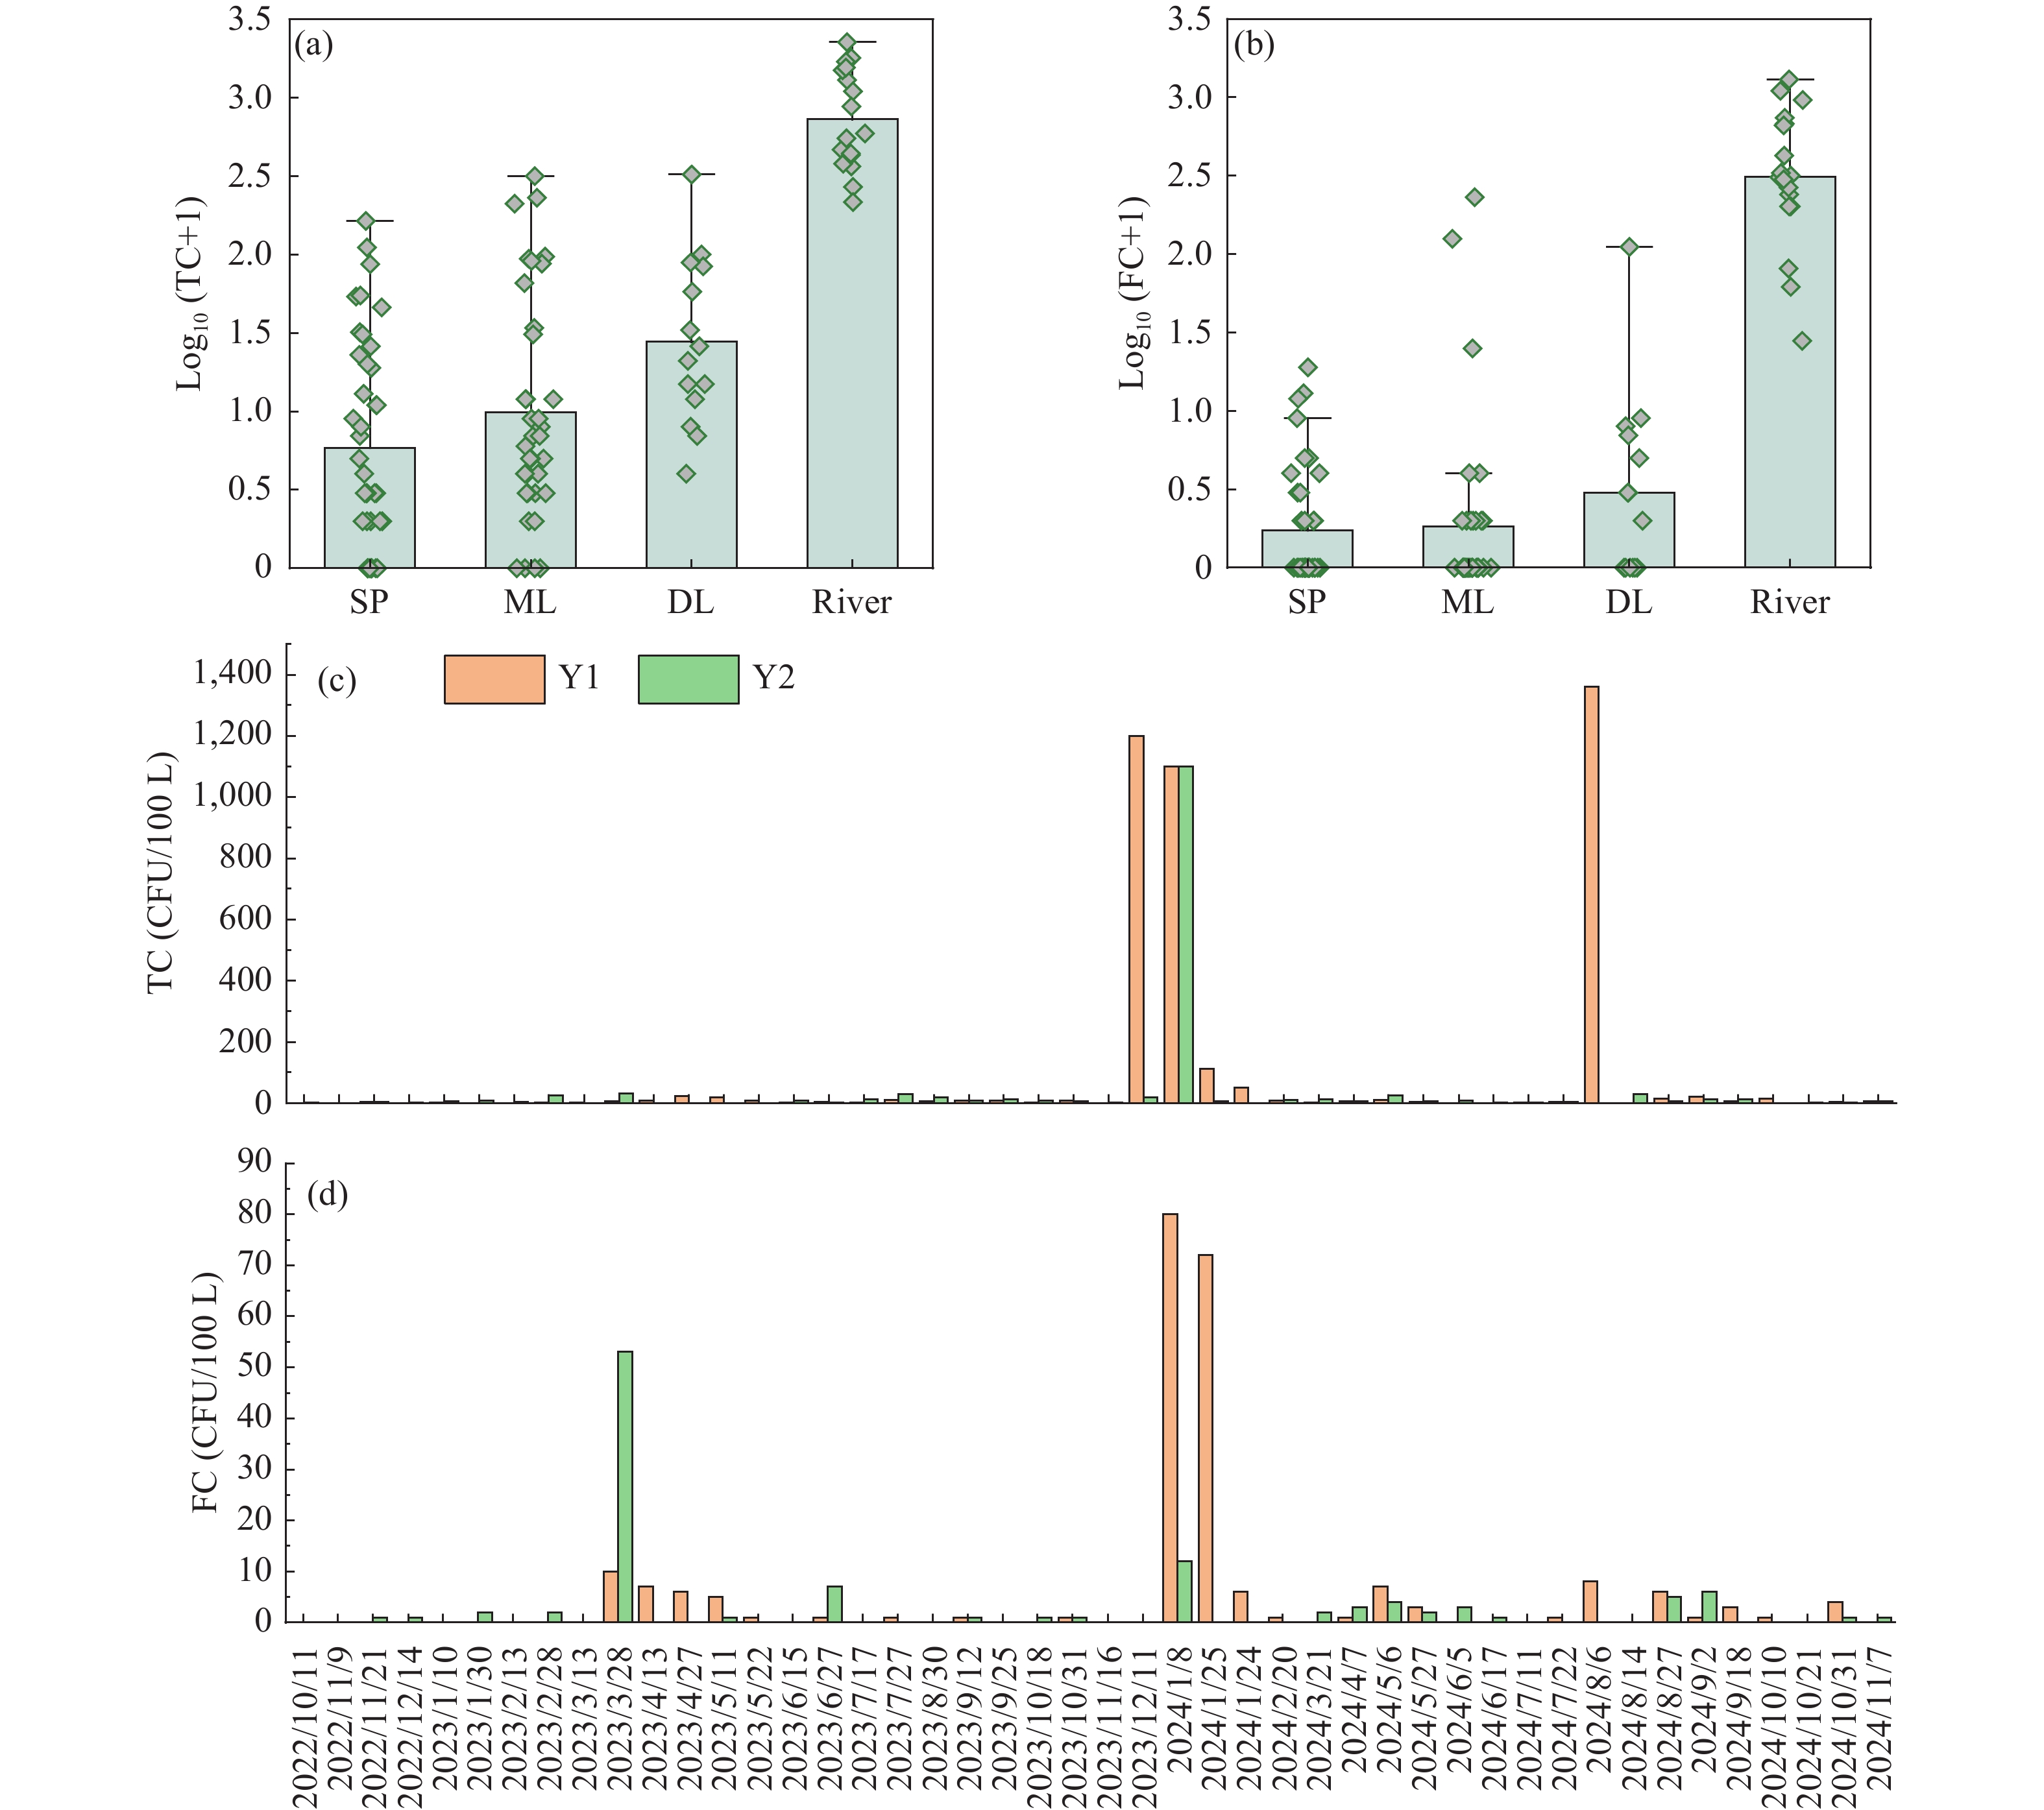
Figure 2. Spatial variations in TC (a) and FC (b) during non-backflow periods, and their concentrations in the aquifer (c).
Notes: Sampling locations are categorized along the hydrological flow path from the spring outlet (SP: S1–S3) to the central lake (ML: L1–L5), and then to the downstream lake (DL: L6). Log10 (TC+1) and Log10 (FC+1) represent the base-10 logarithmic transformation of TC and FC concentrations, respectively, with 1 added to avoid undefined values when concentrations are zero.
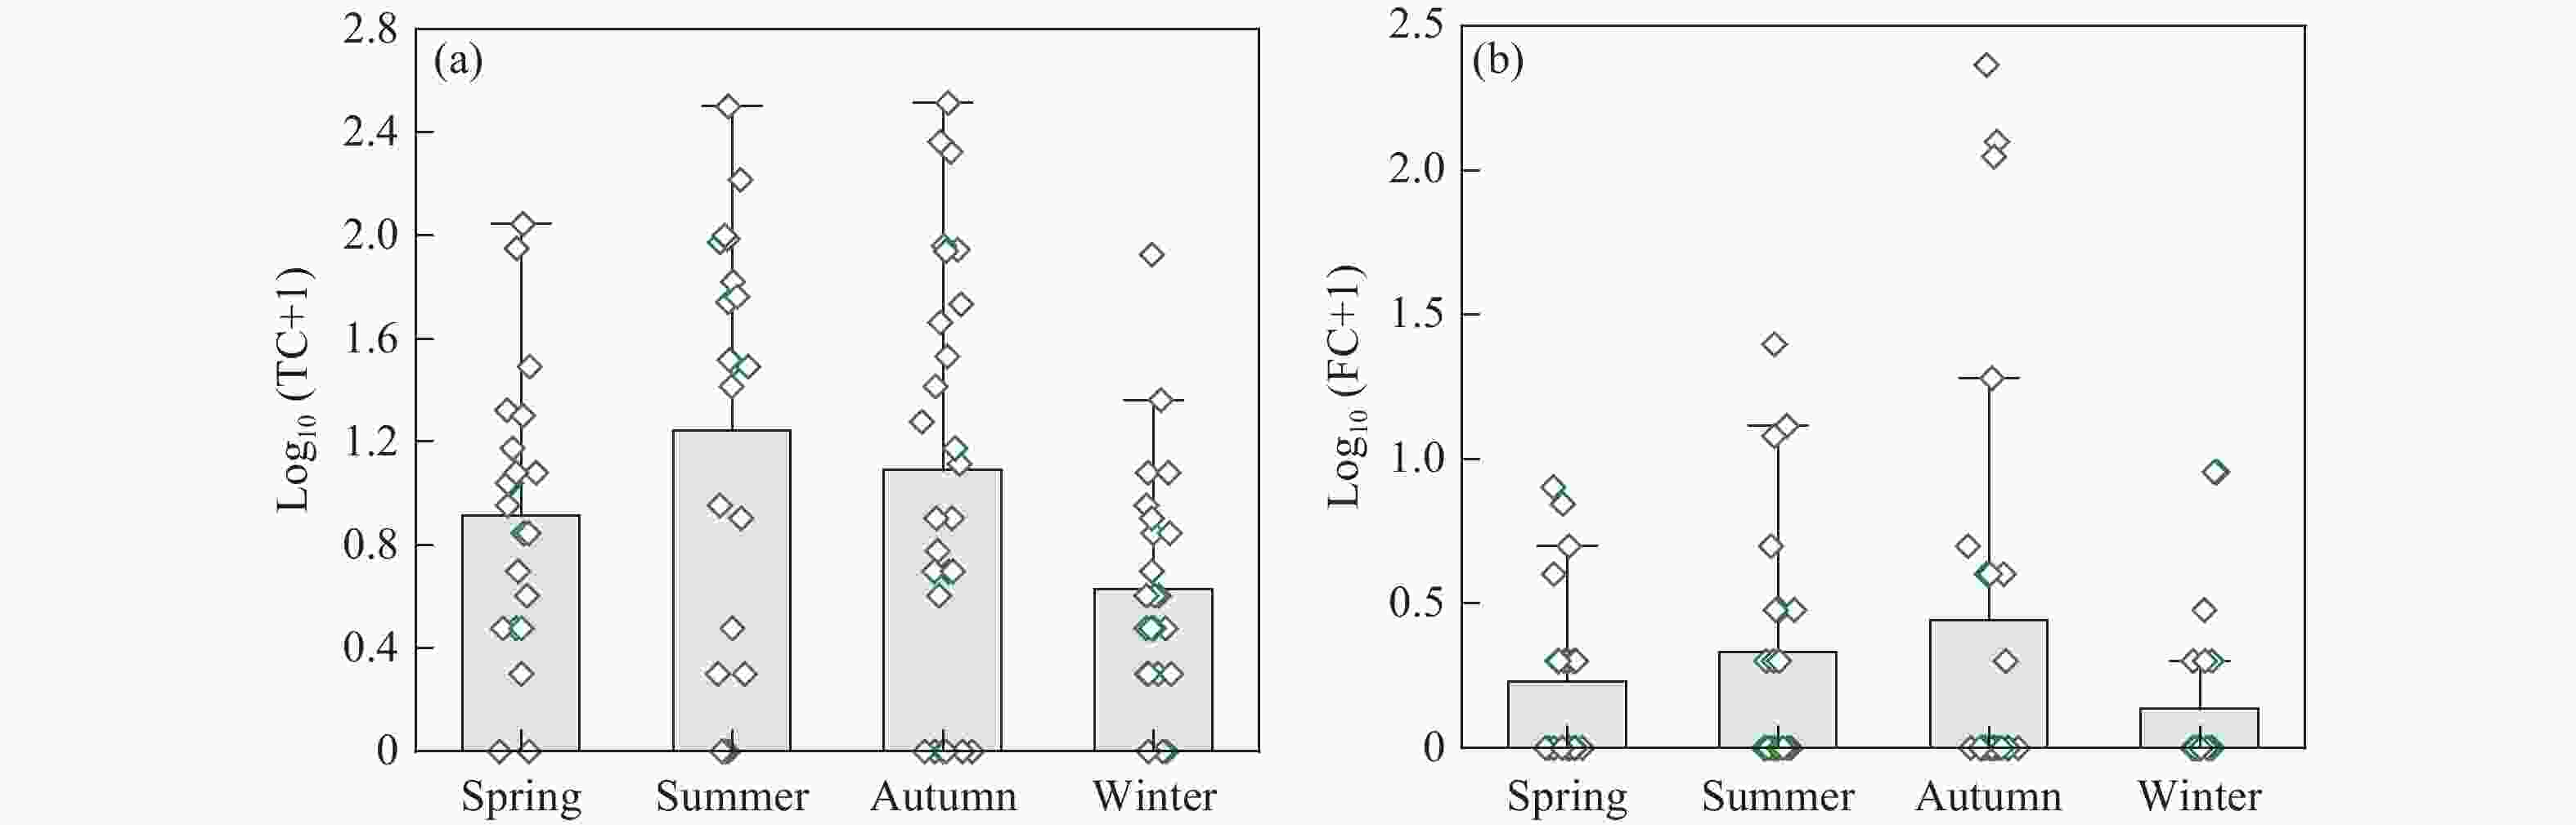
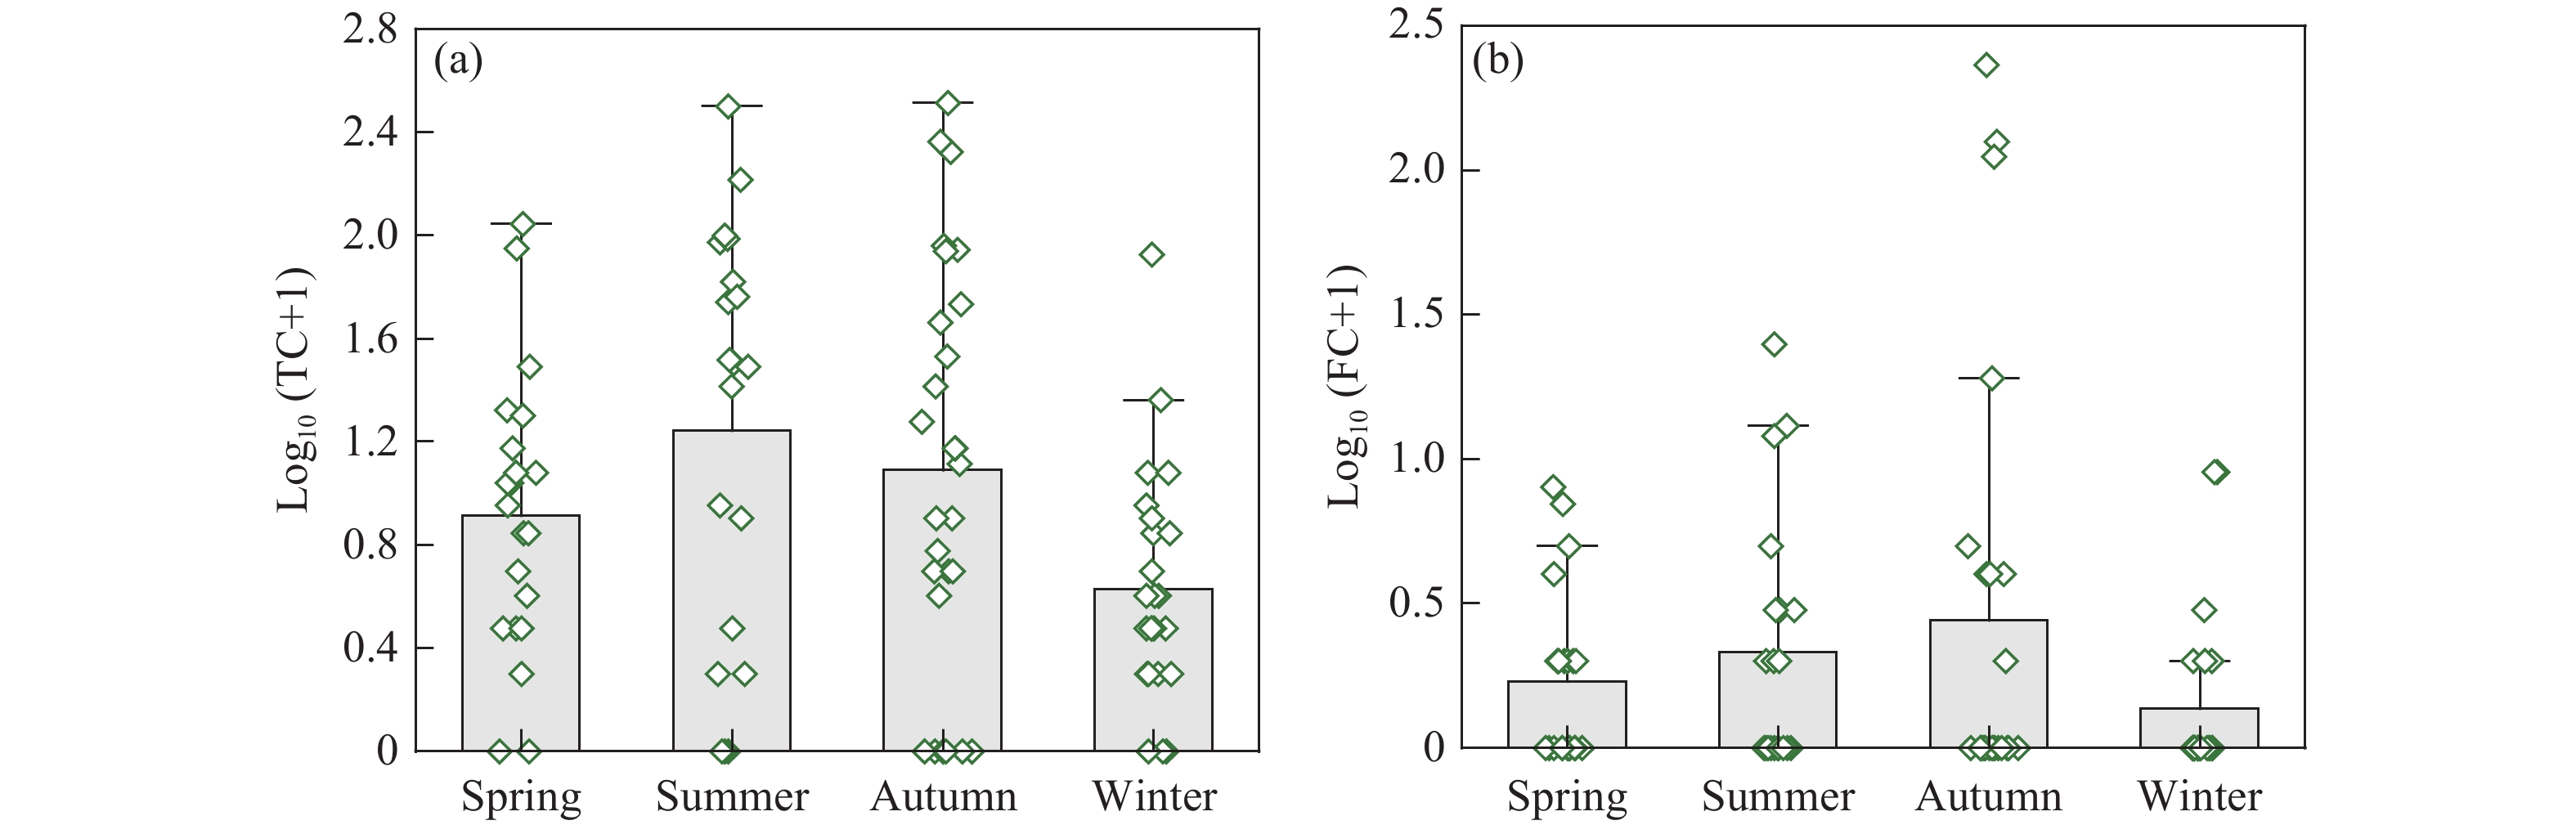
Figure 3. Seasonal variations in TC (a) and FC (b) in the hyporheic zone during non-backflow periods.
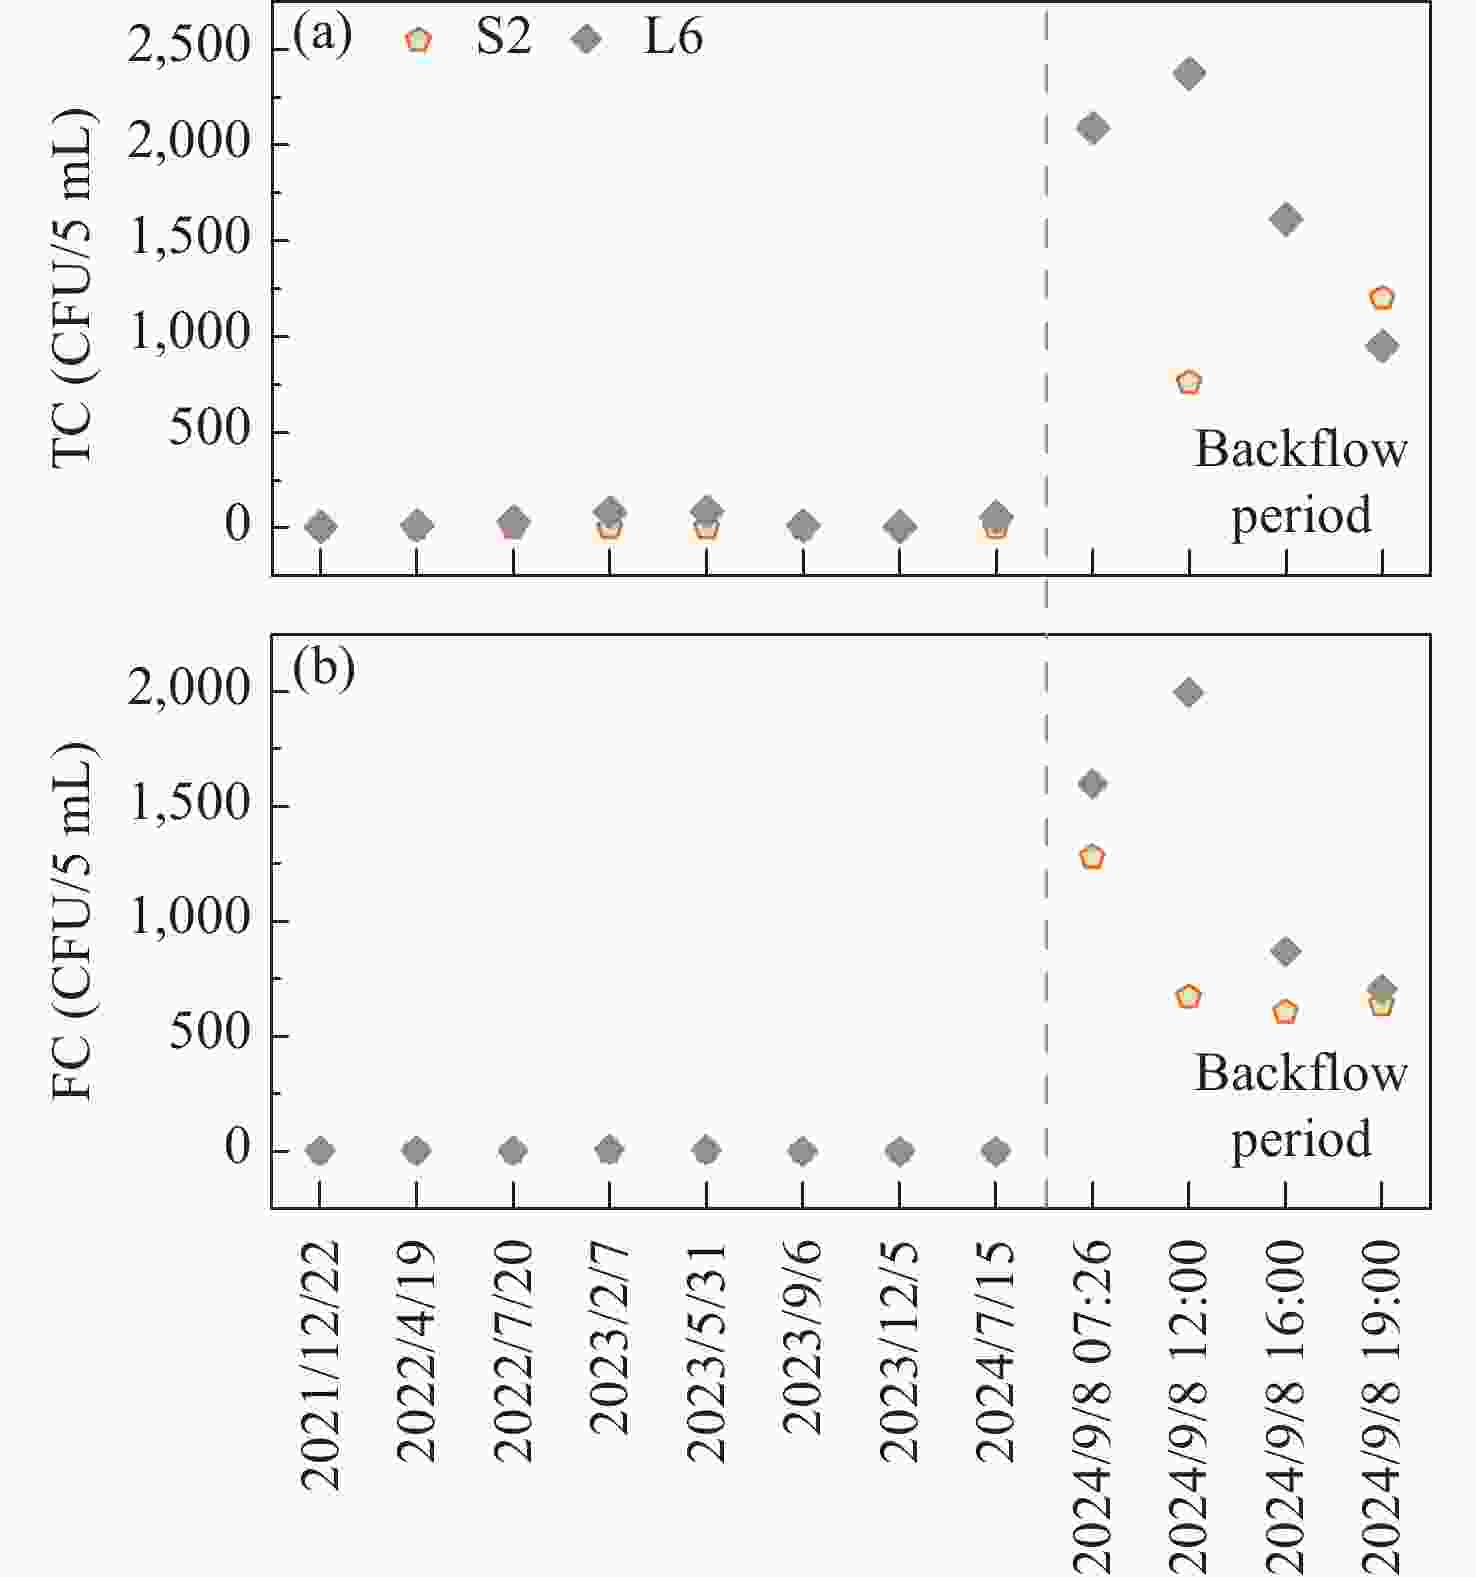
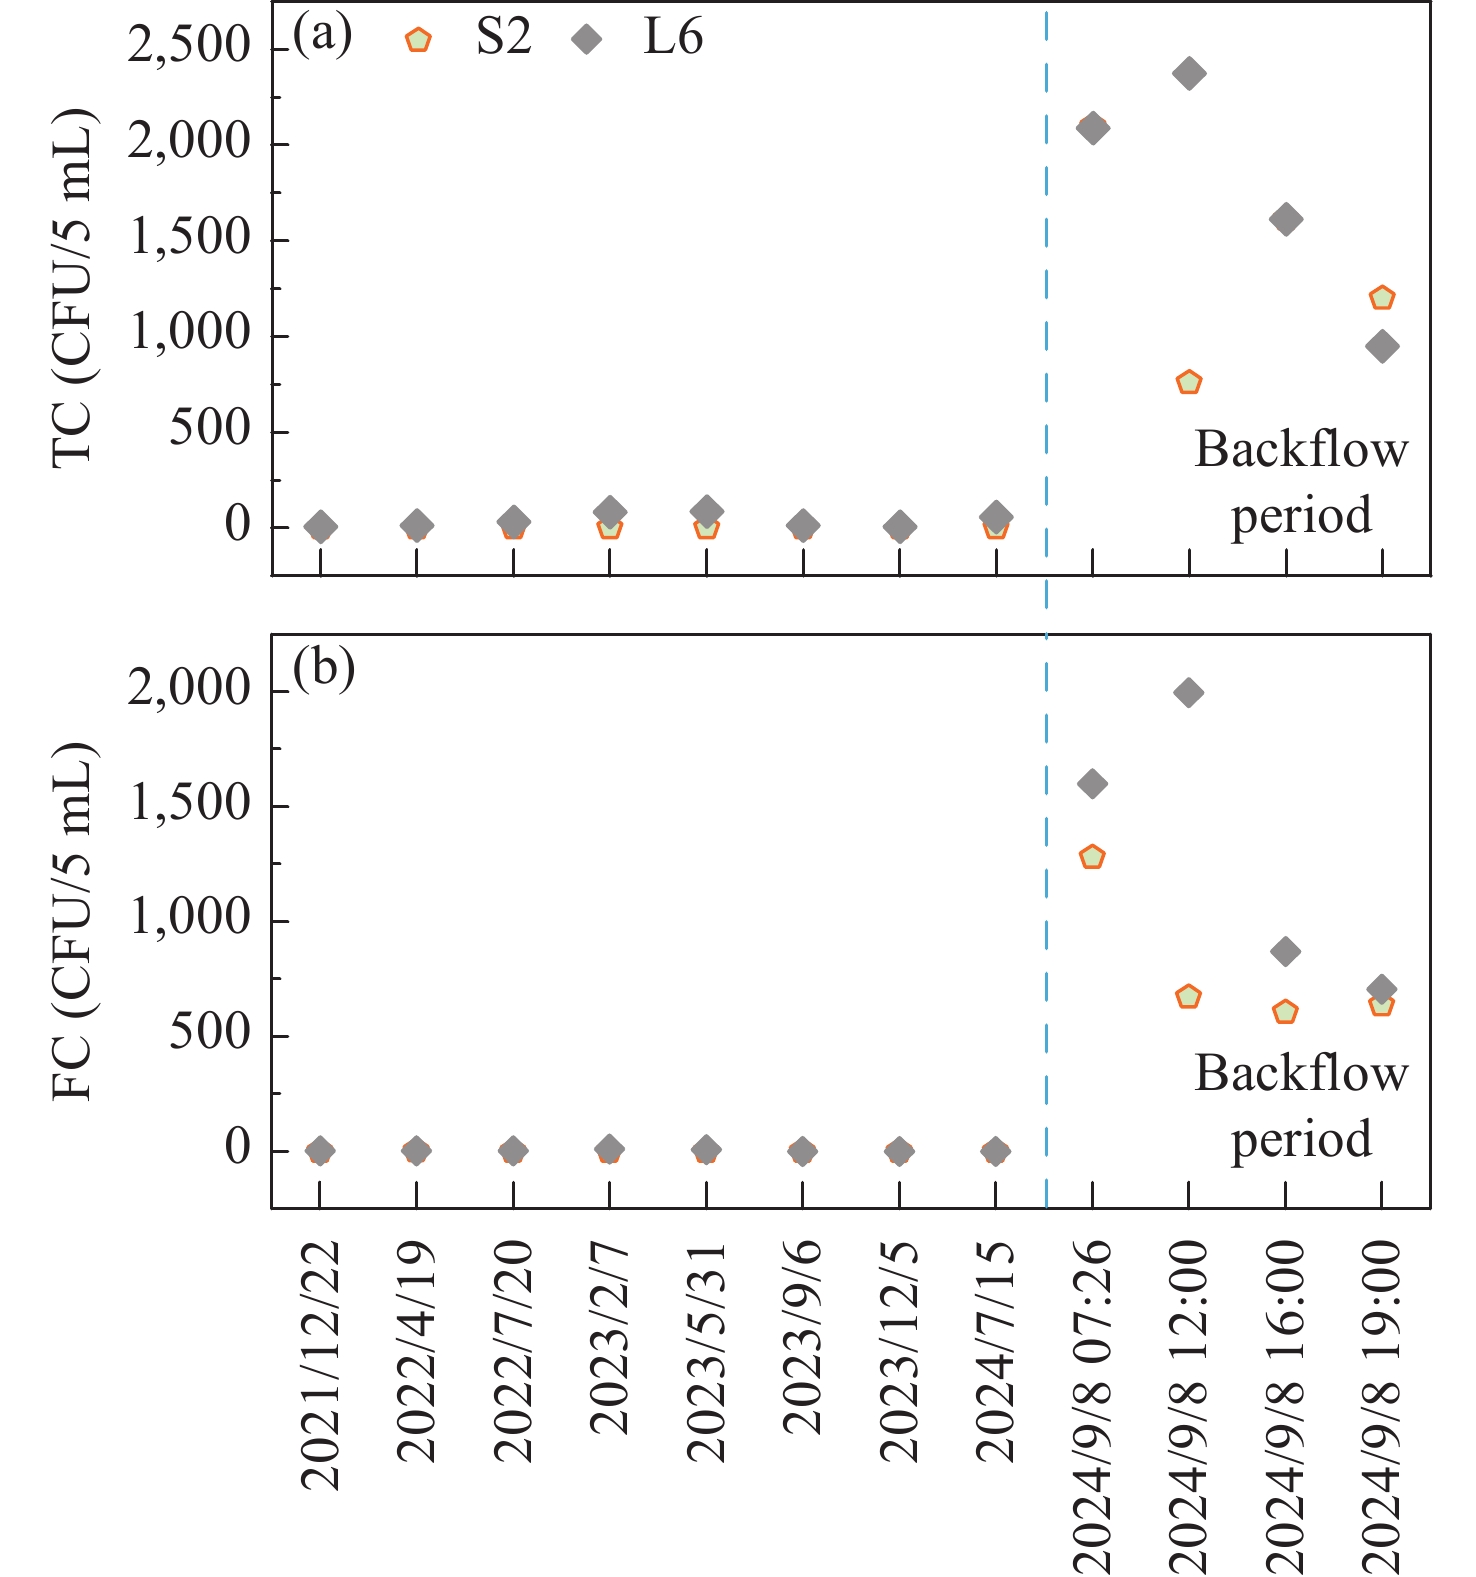
Figure 4. TC (a) and FC (b) count at the spring outlet (S2) and downstream lake (L6) under non-backflow and backflow conditions.
Notes: The area to the left of the dashed line represents the non-backflow period, and the area to the right represents the backflow period during the 2024 backflow event.
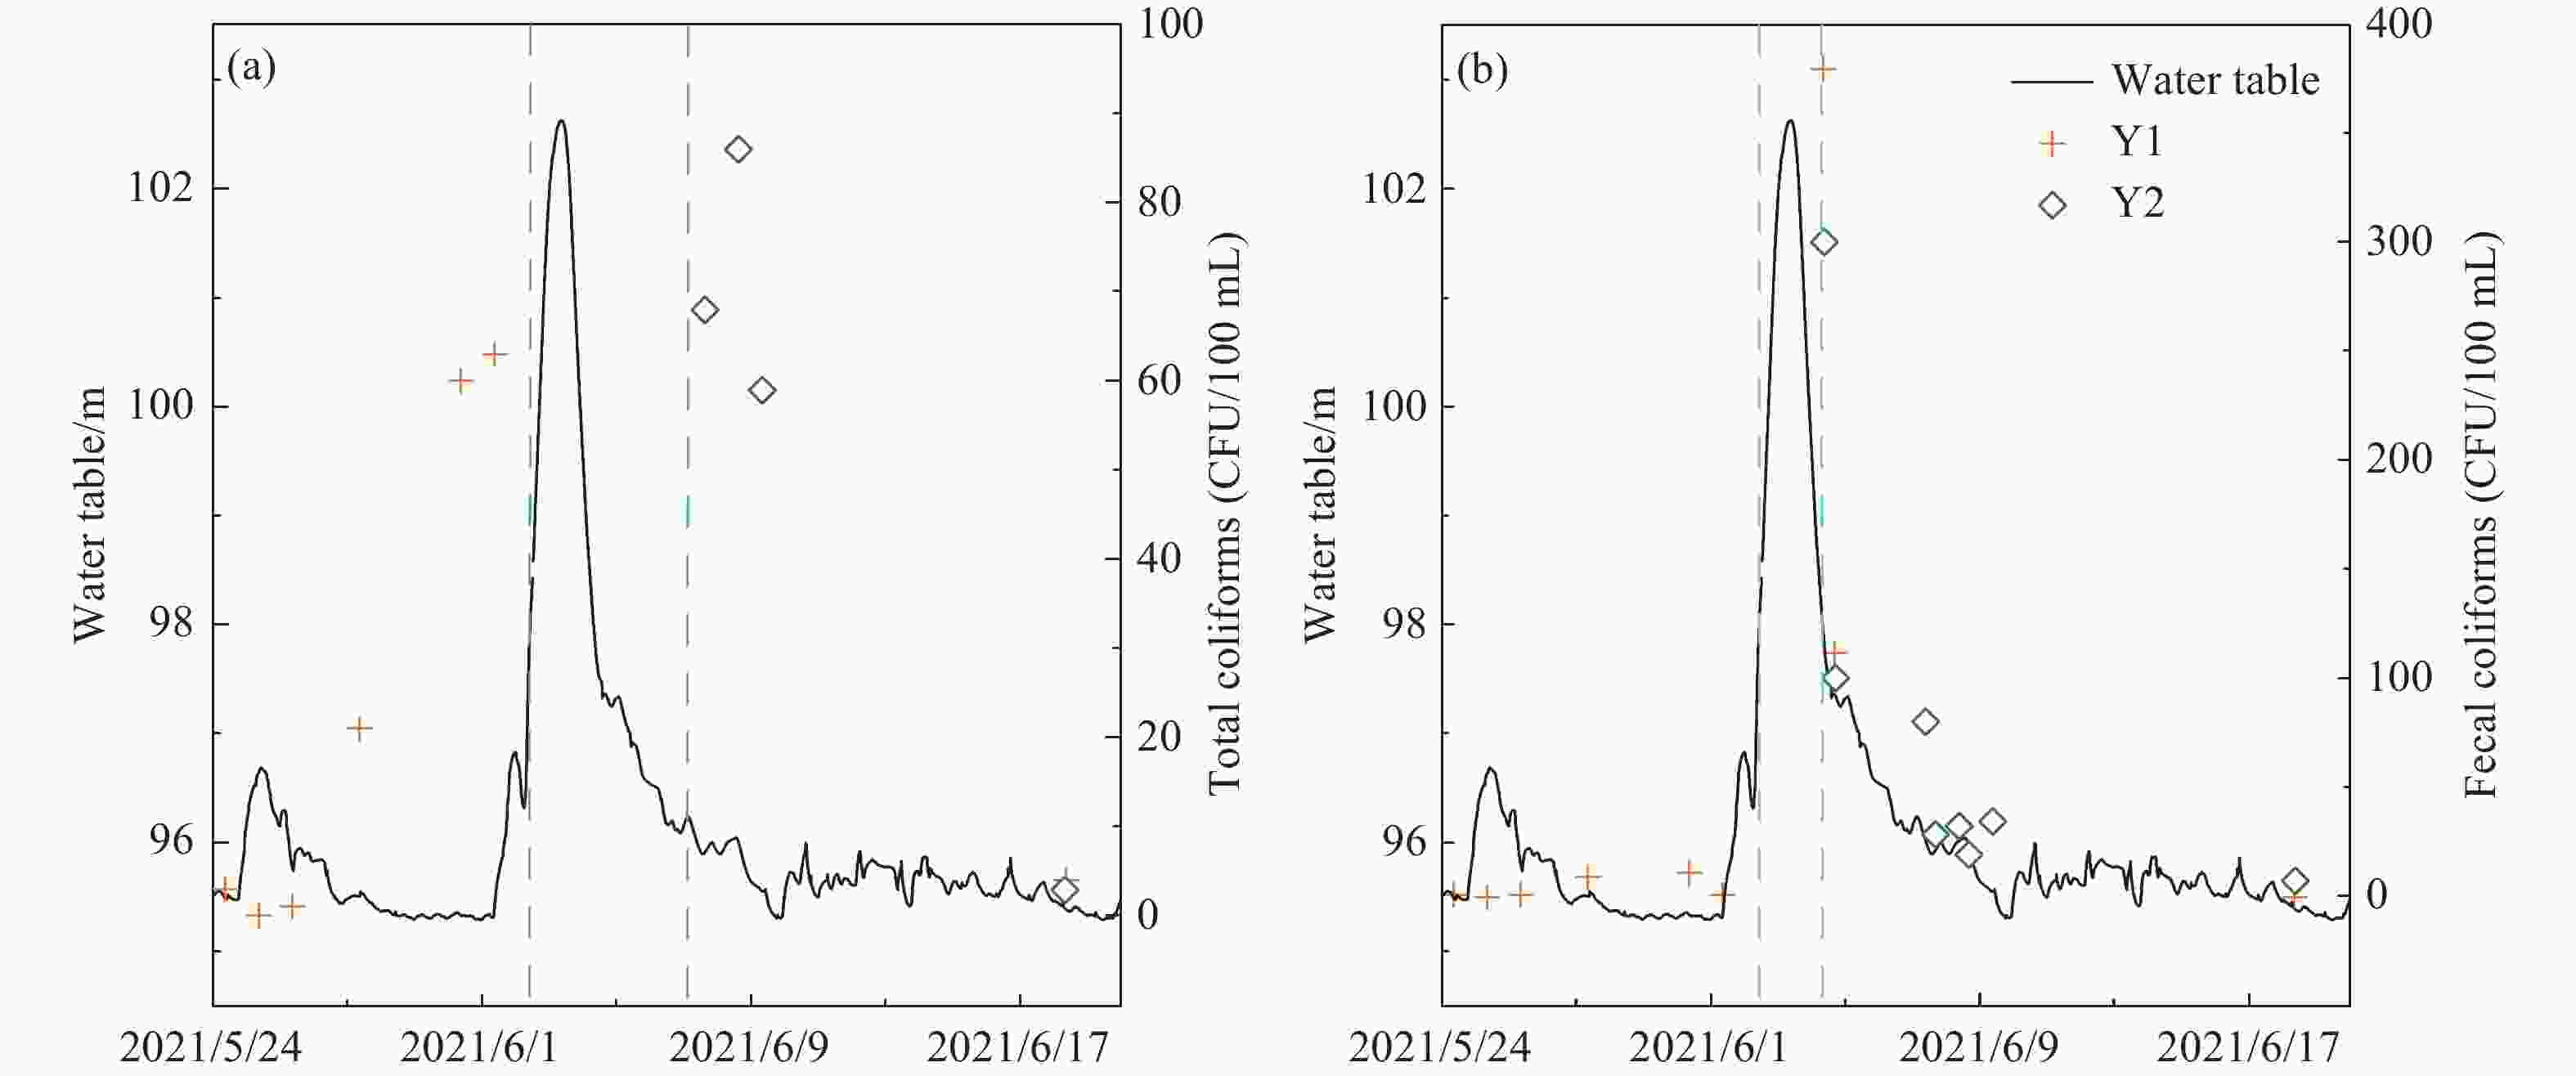
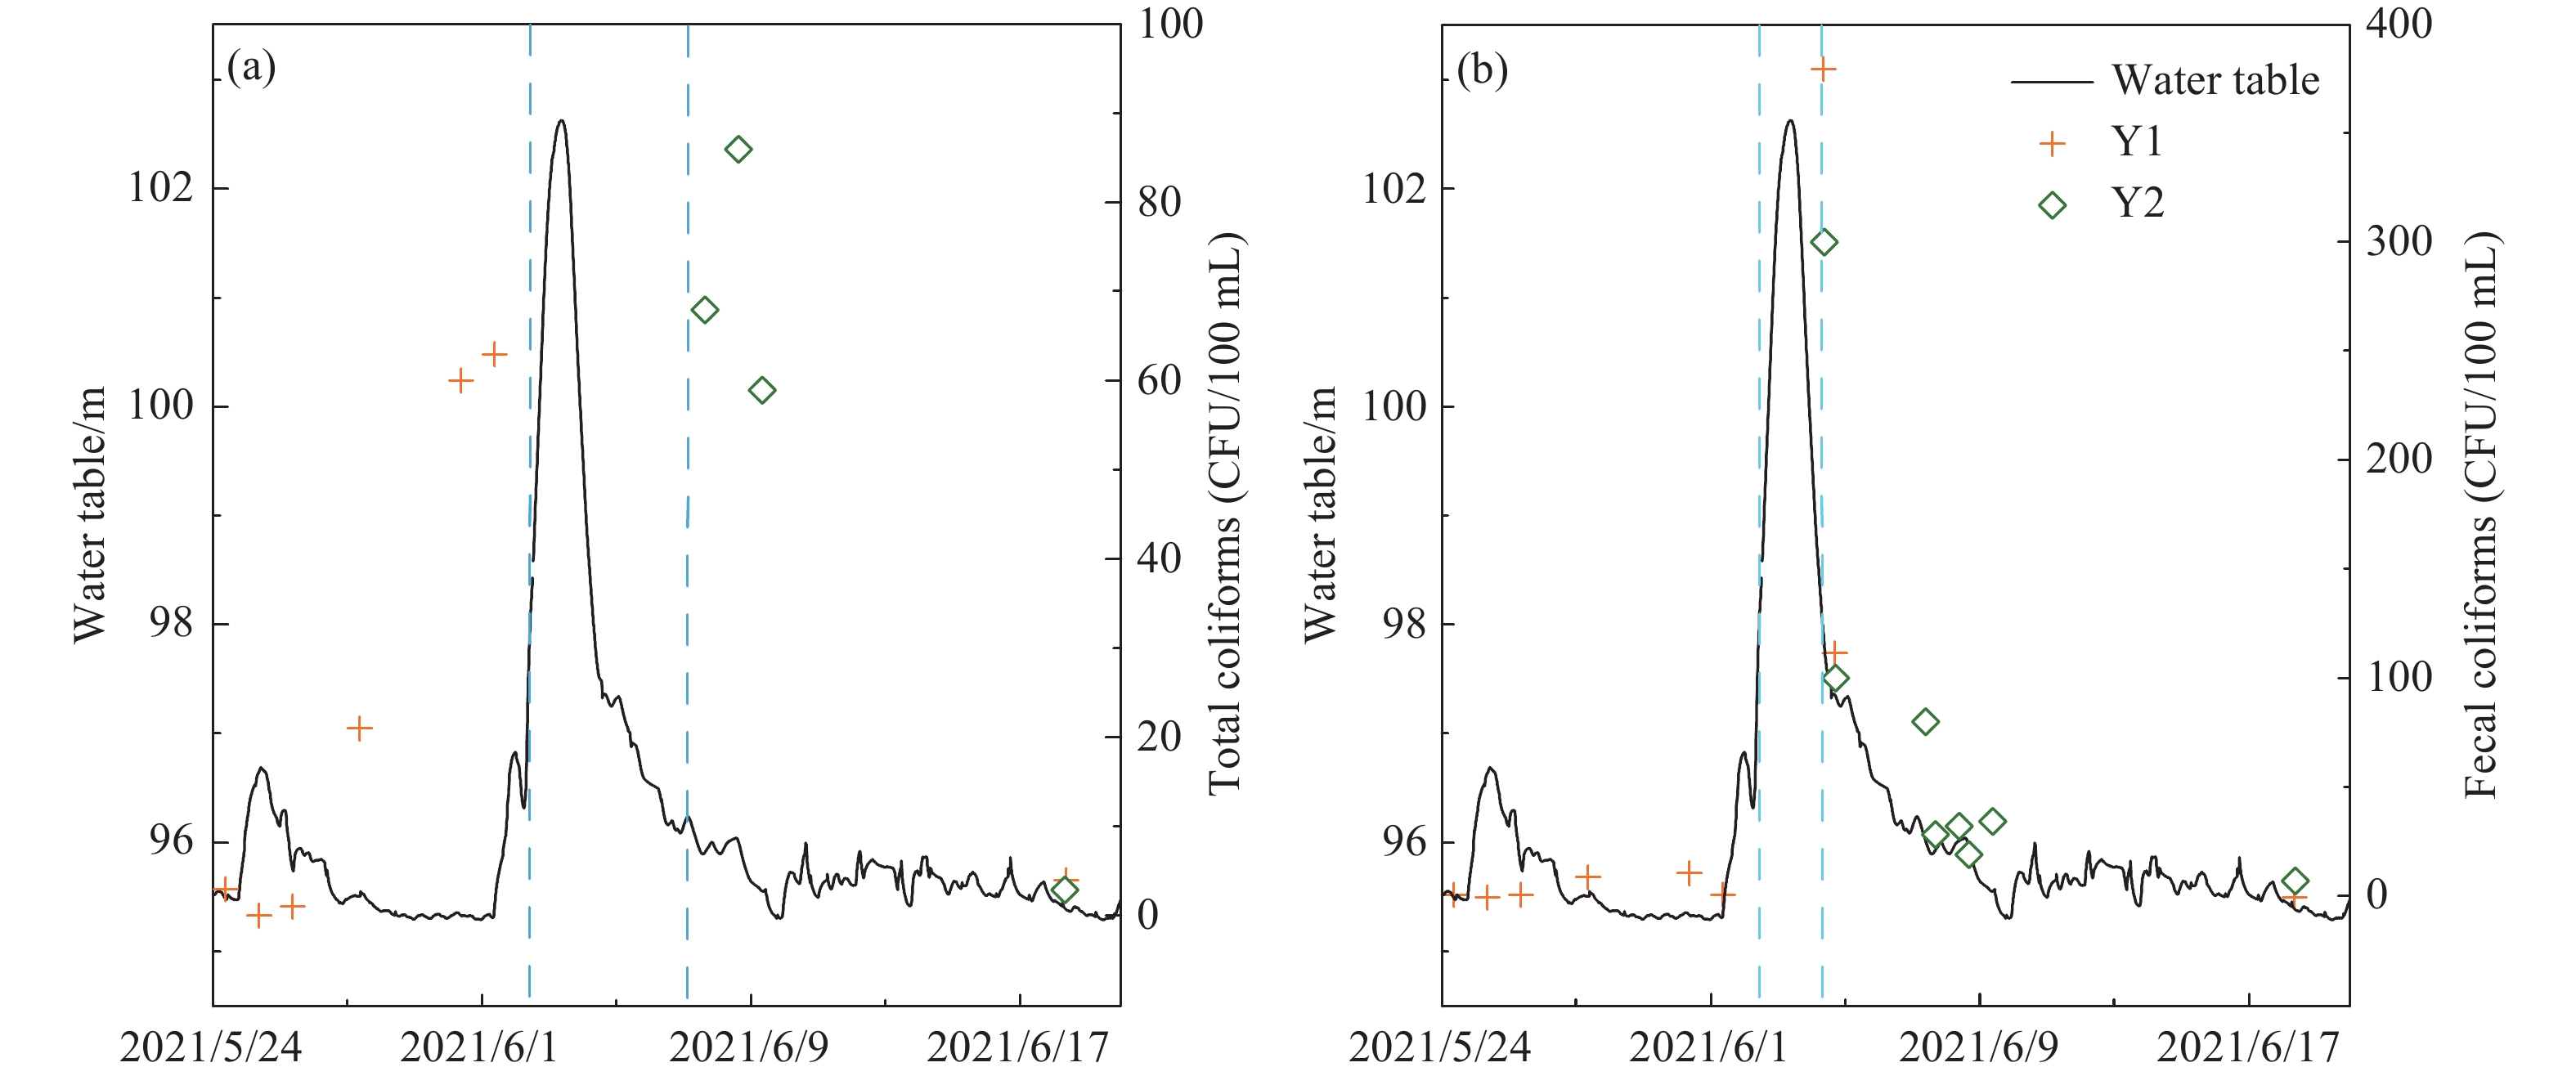
Figure 5. Response of TC (a) and FC (b) in the aquifer to lake water level fluctuations during the 2021 backflow event.
Notes: The area between the two dashed lines indicates the period during which both total coliforms and fecal coliform concentrations exceeded 104 CFU/100 mL.
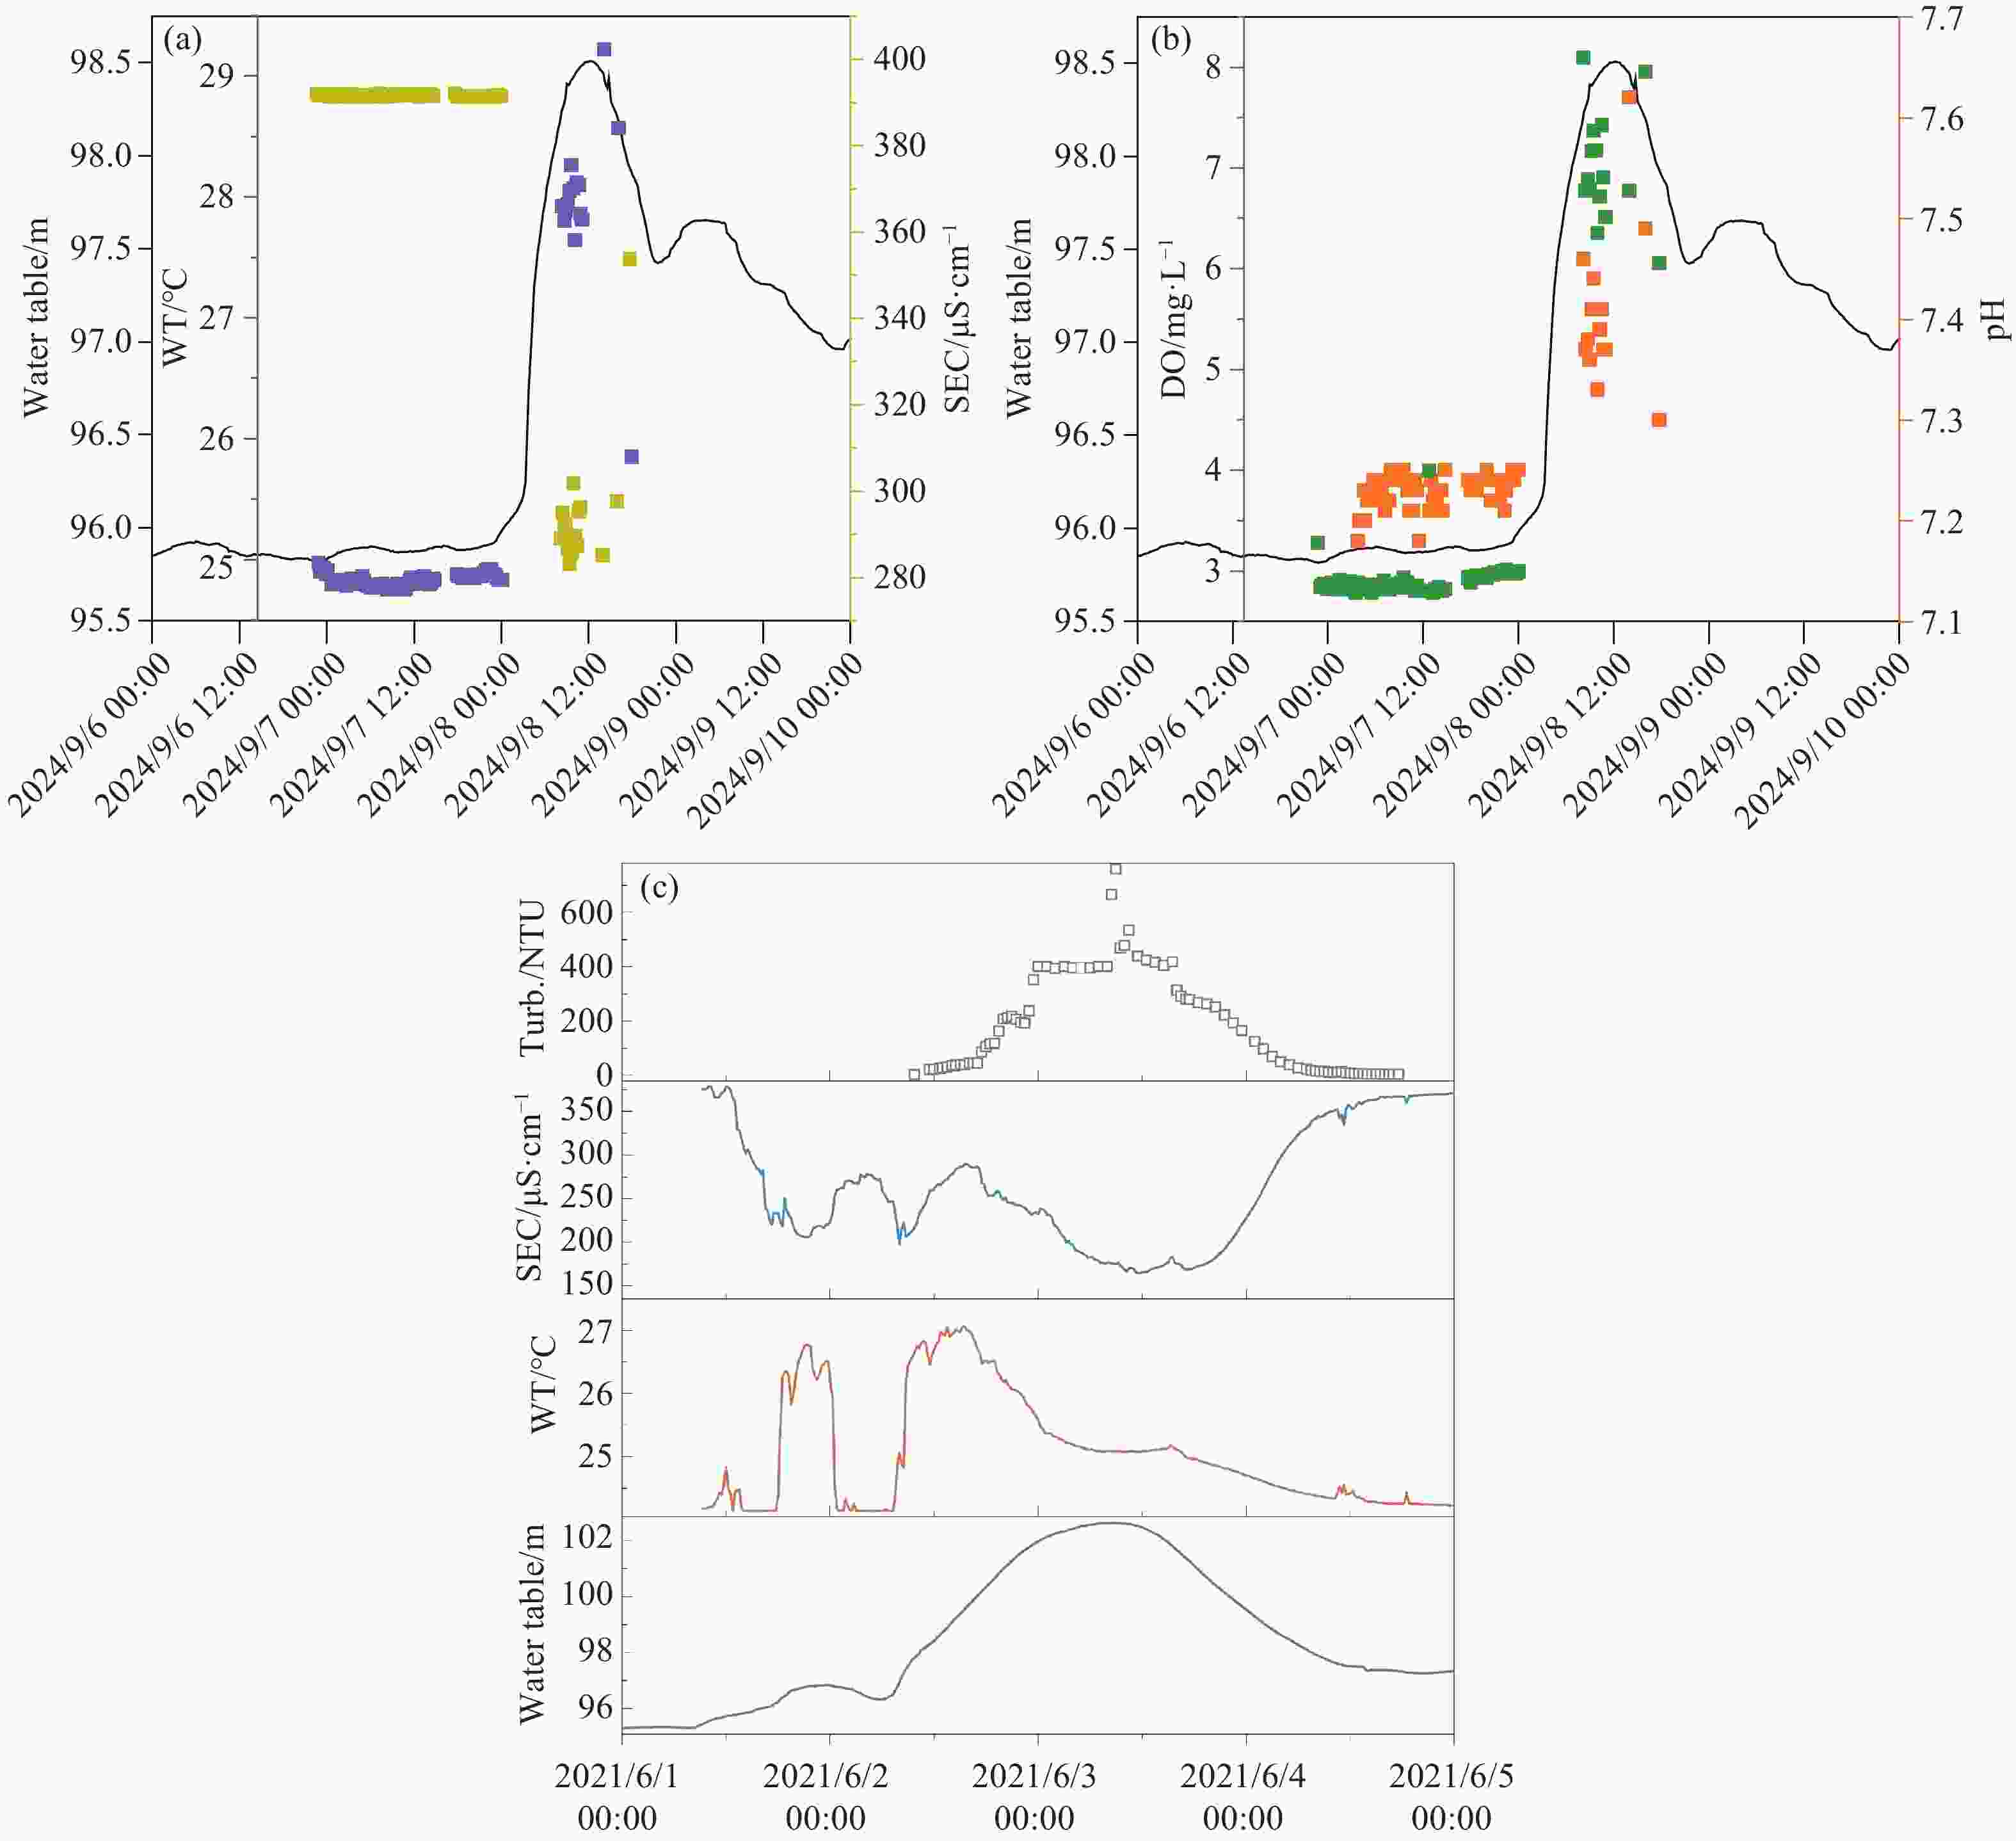
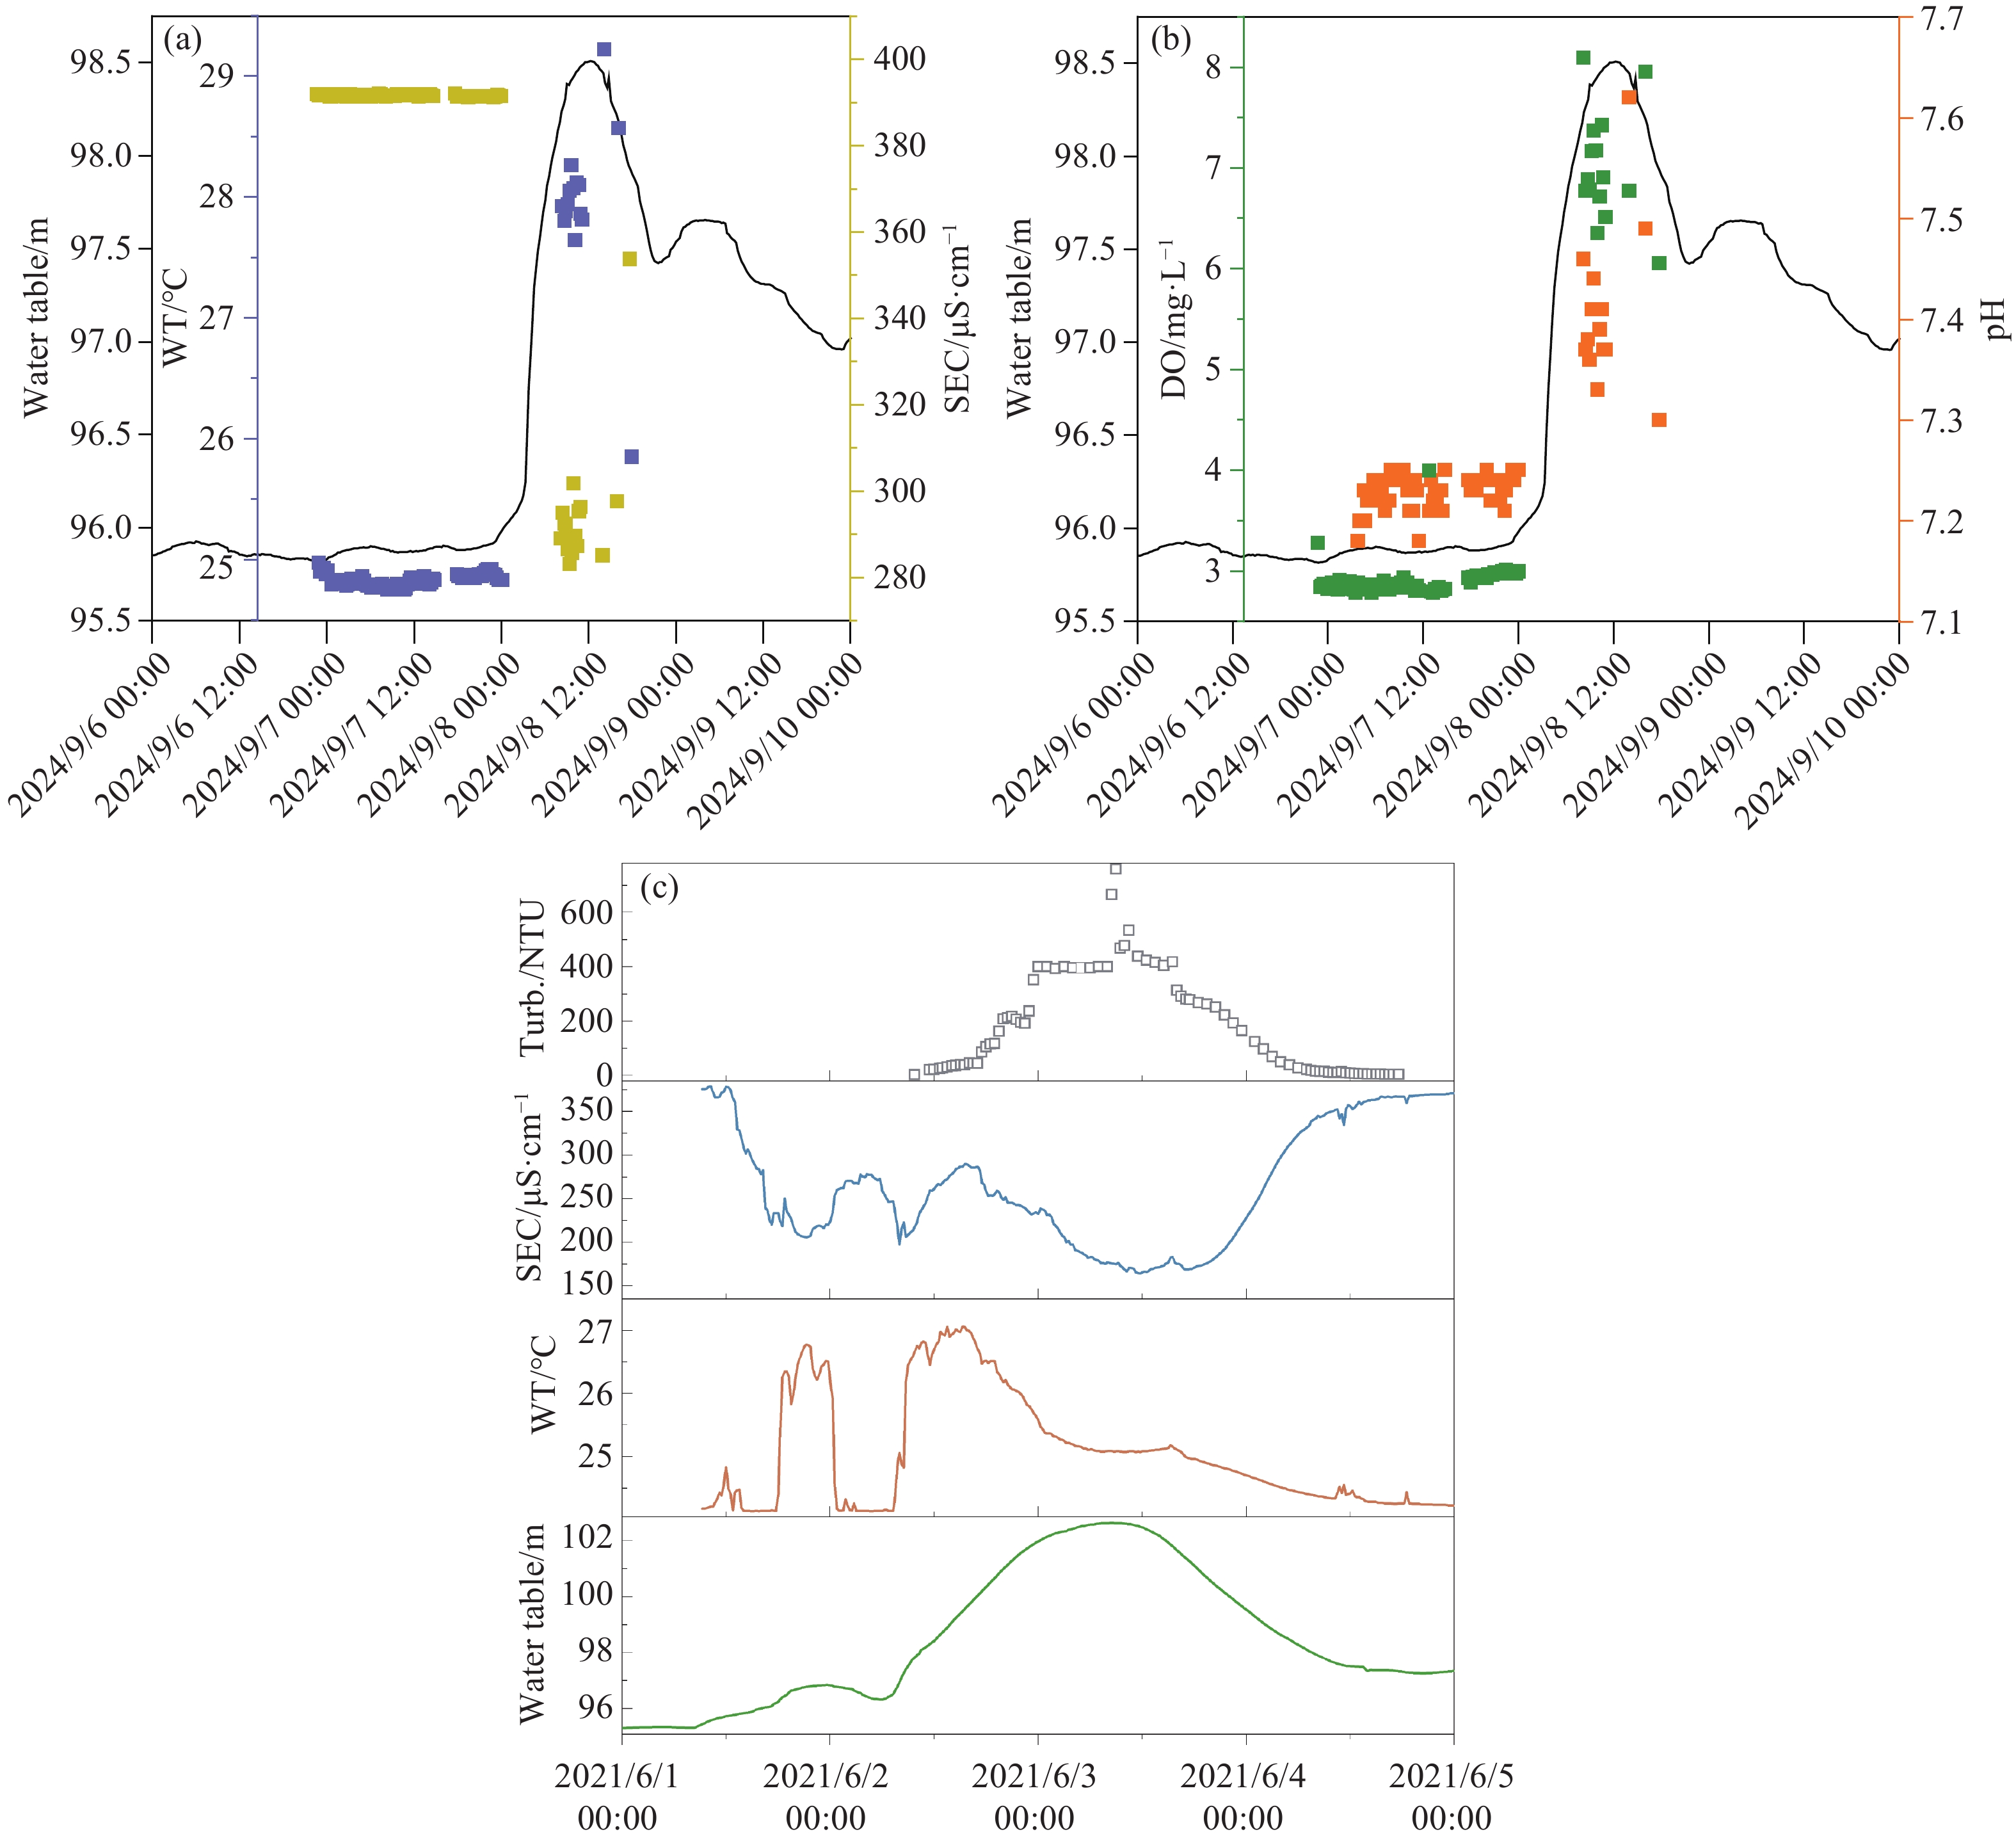
Figure 6. Variations in physicochemical parameters in response to lake water level fluctuations during backflow events.
Notes: (a) Water Temperature (WT) and Specific Electrical Conductivity (SEC) during the 2024 backflow event. (b) pH and Dissolved Oxygen (DO) during the 2024 backflow event. (c) Turbidity (Turb.), Specific Electrical Conductivity (SEC), and Water Temperature (WT) during the 2021 backflow event.
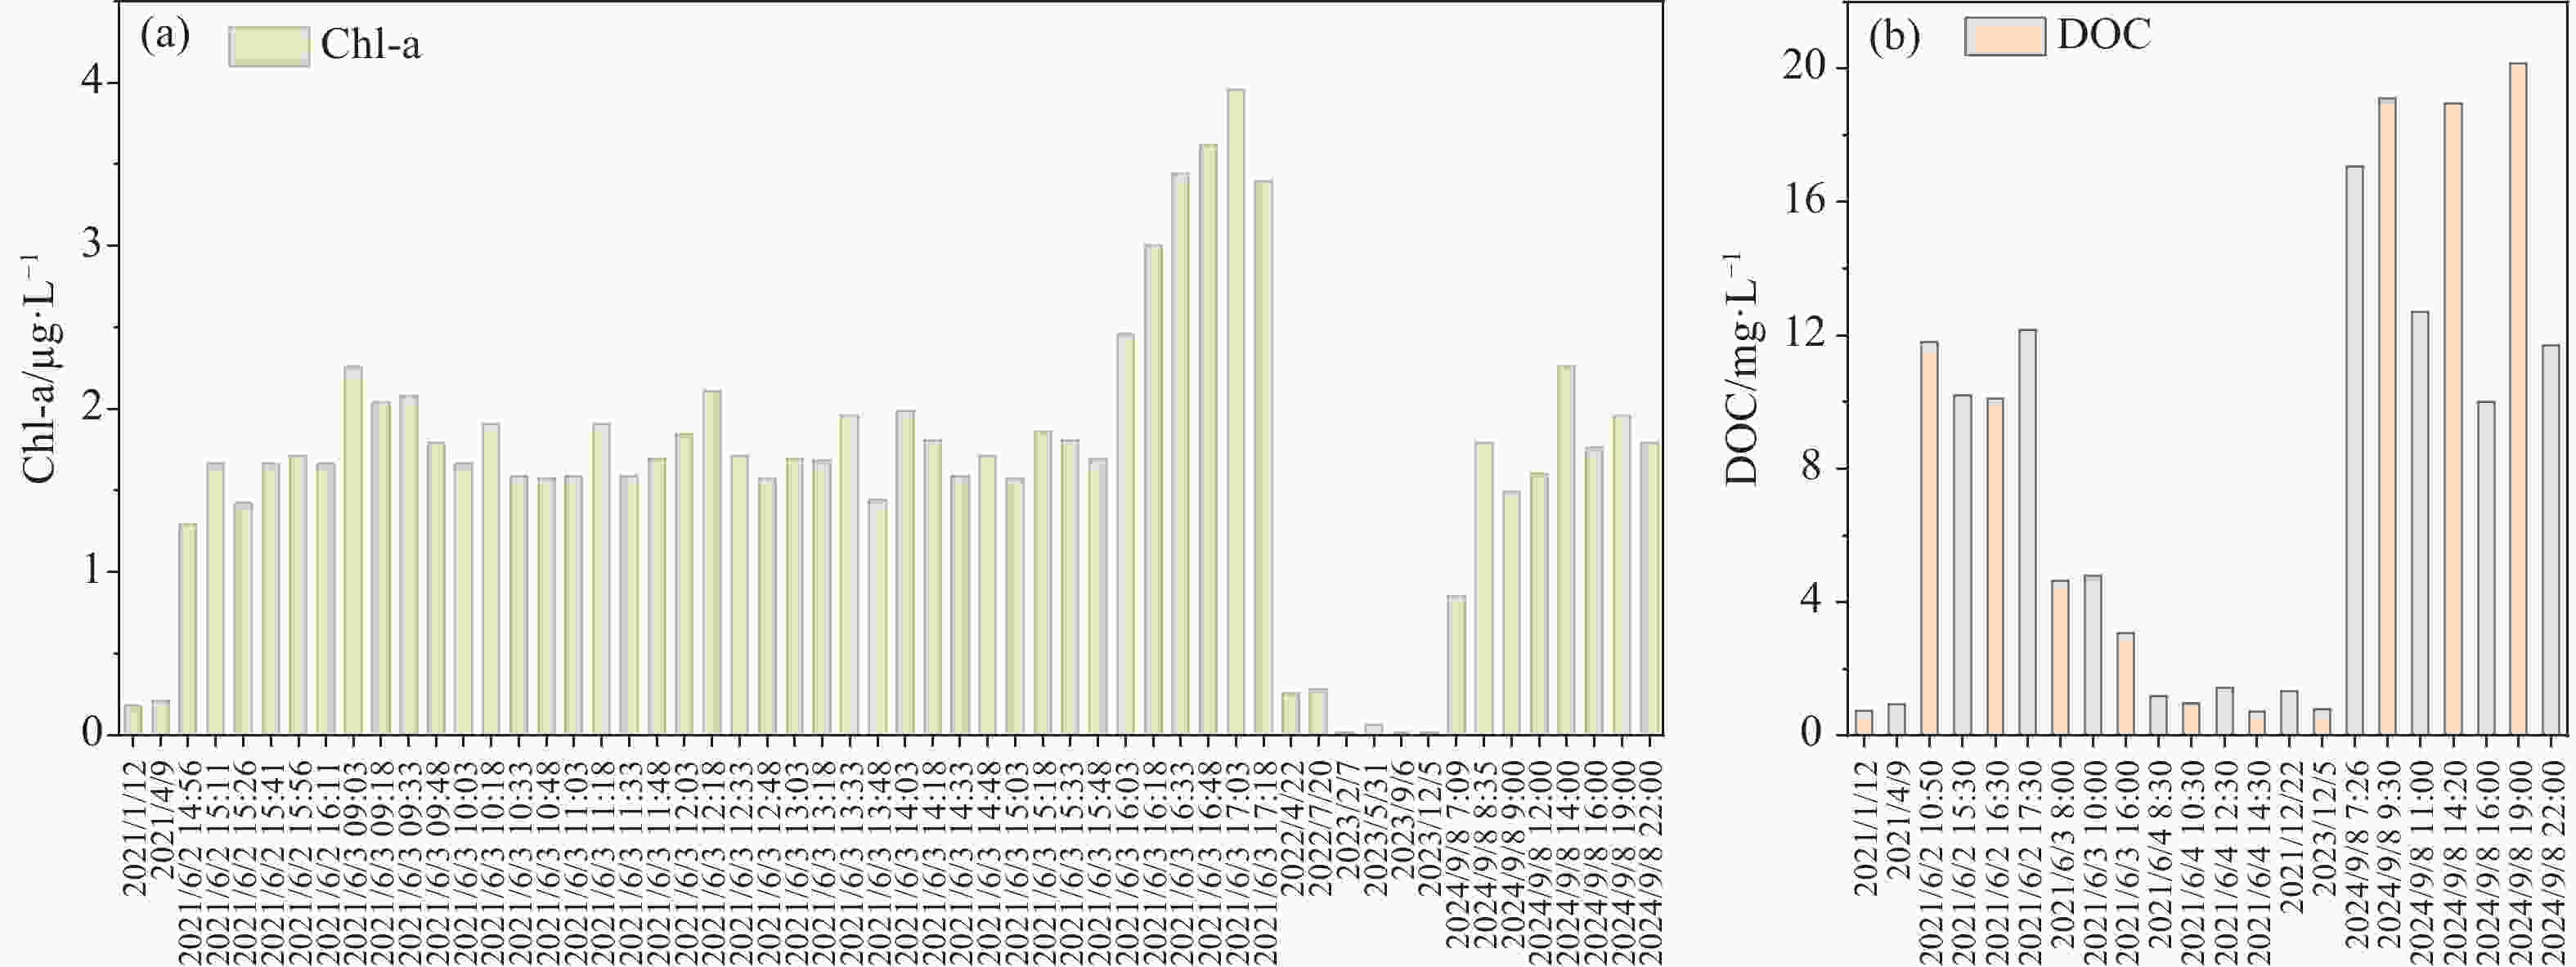
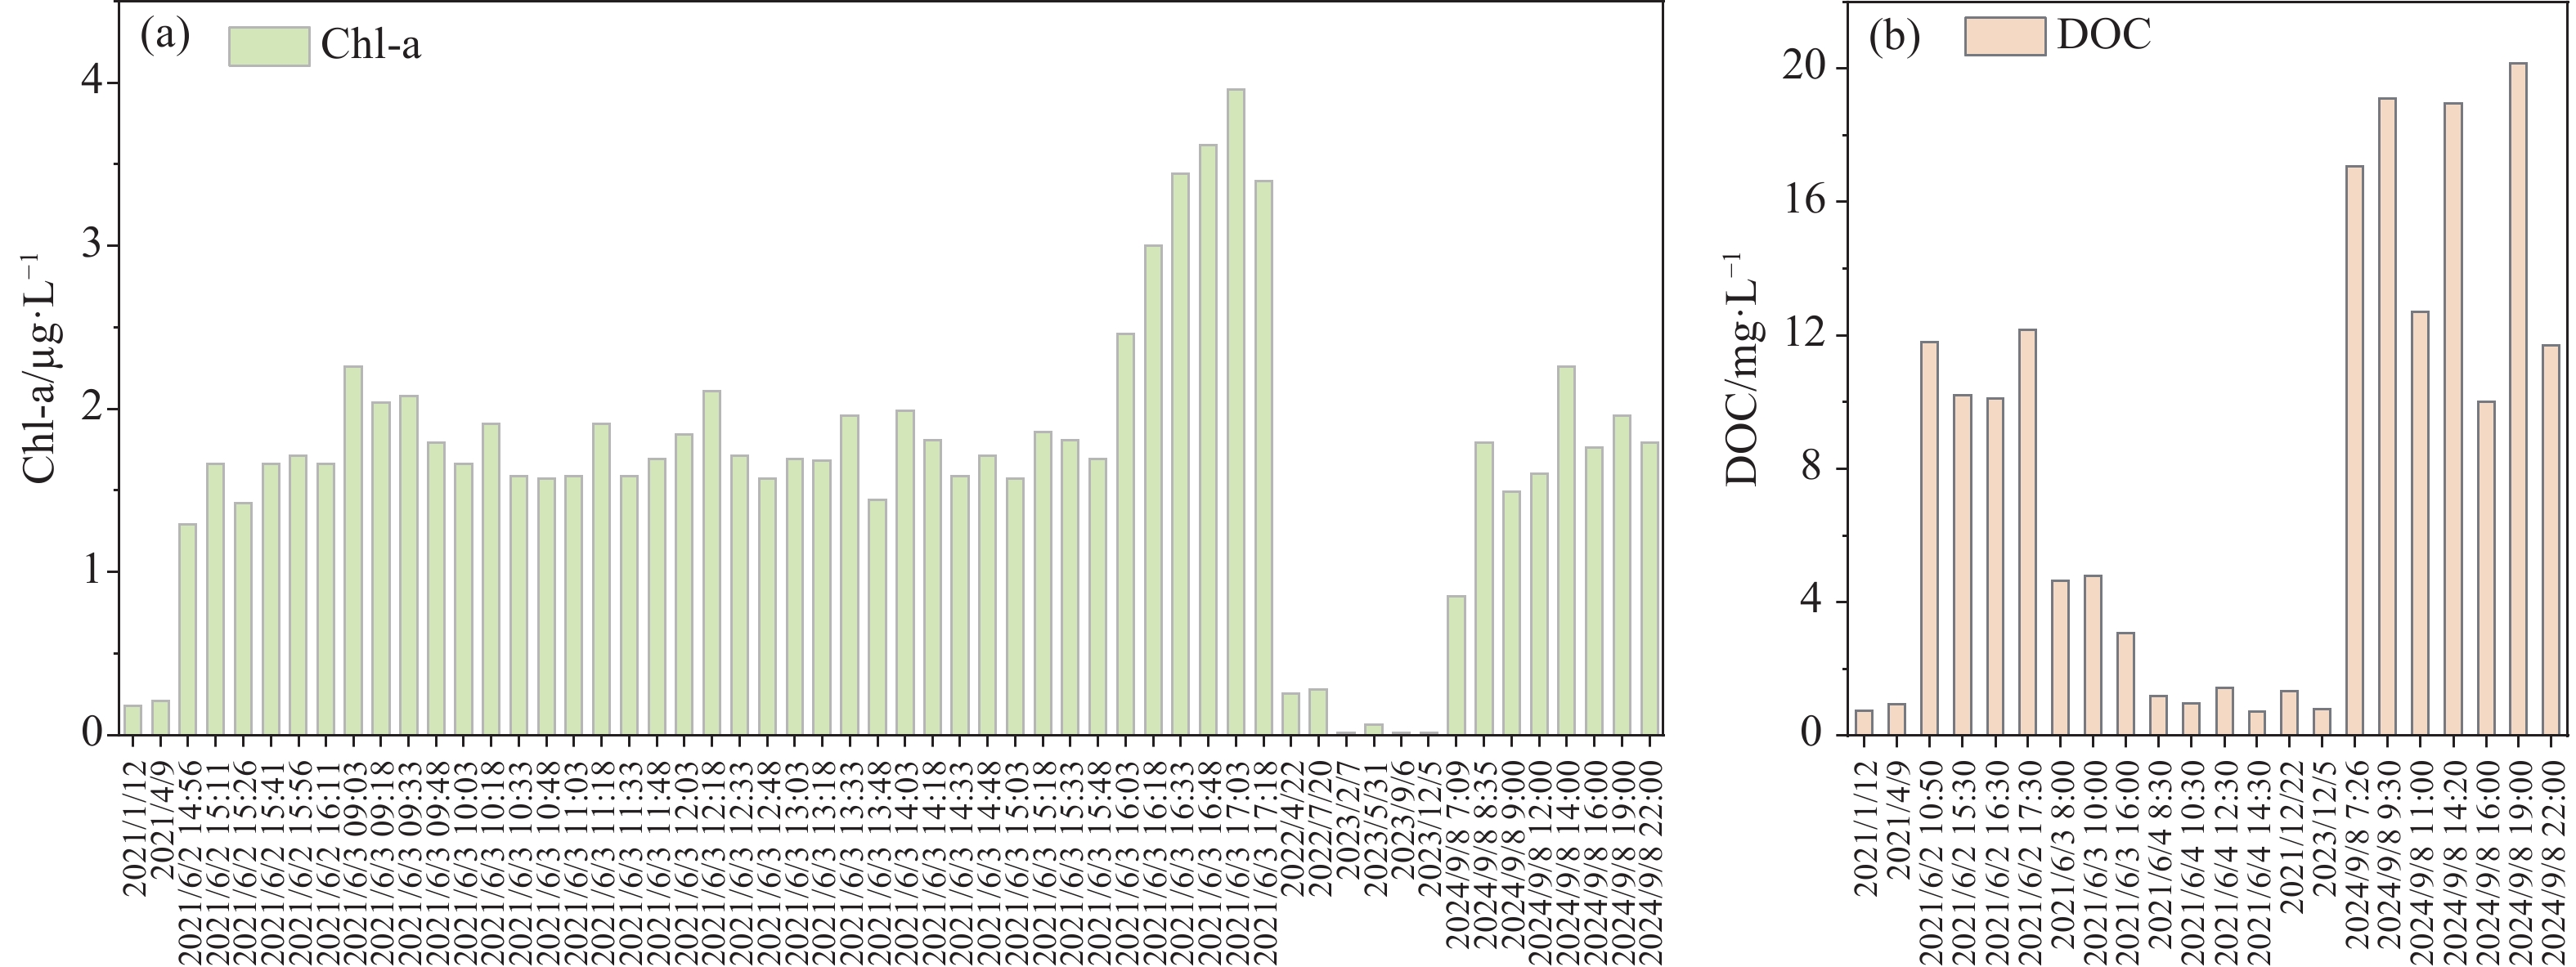
Figure 7. Chl-a (a) and DOC (b) levels at the spring outlet (S2) during the two backflow events and normal periods.
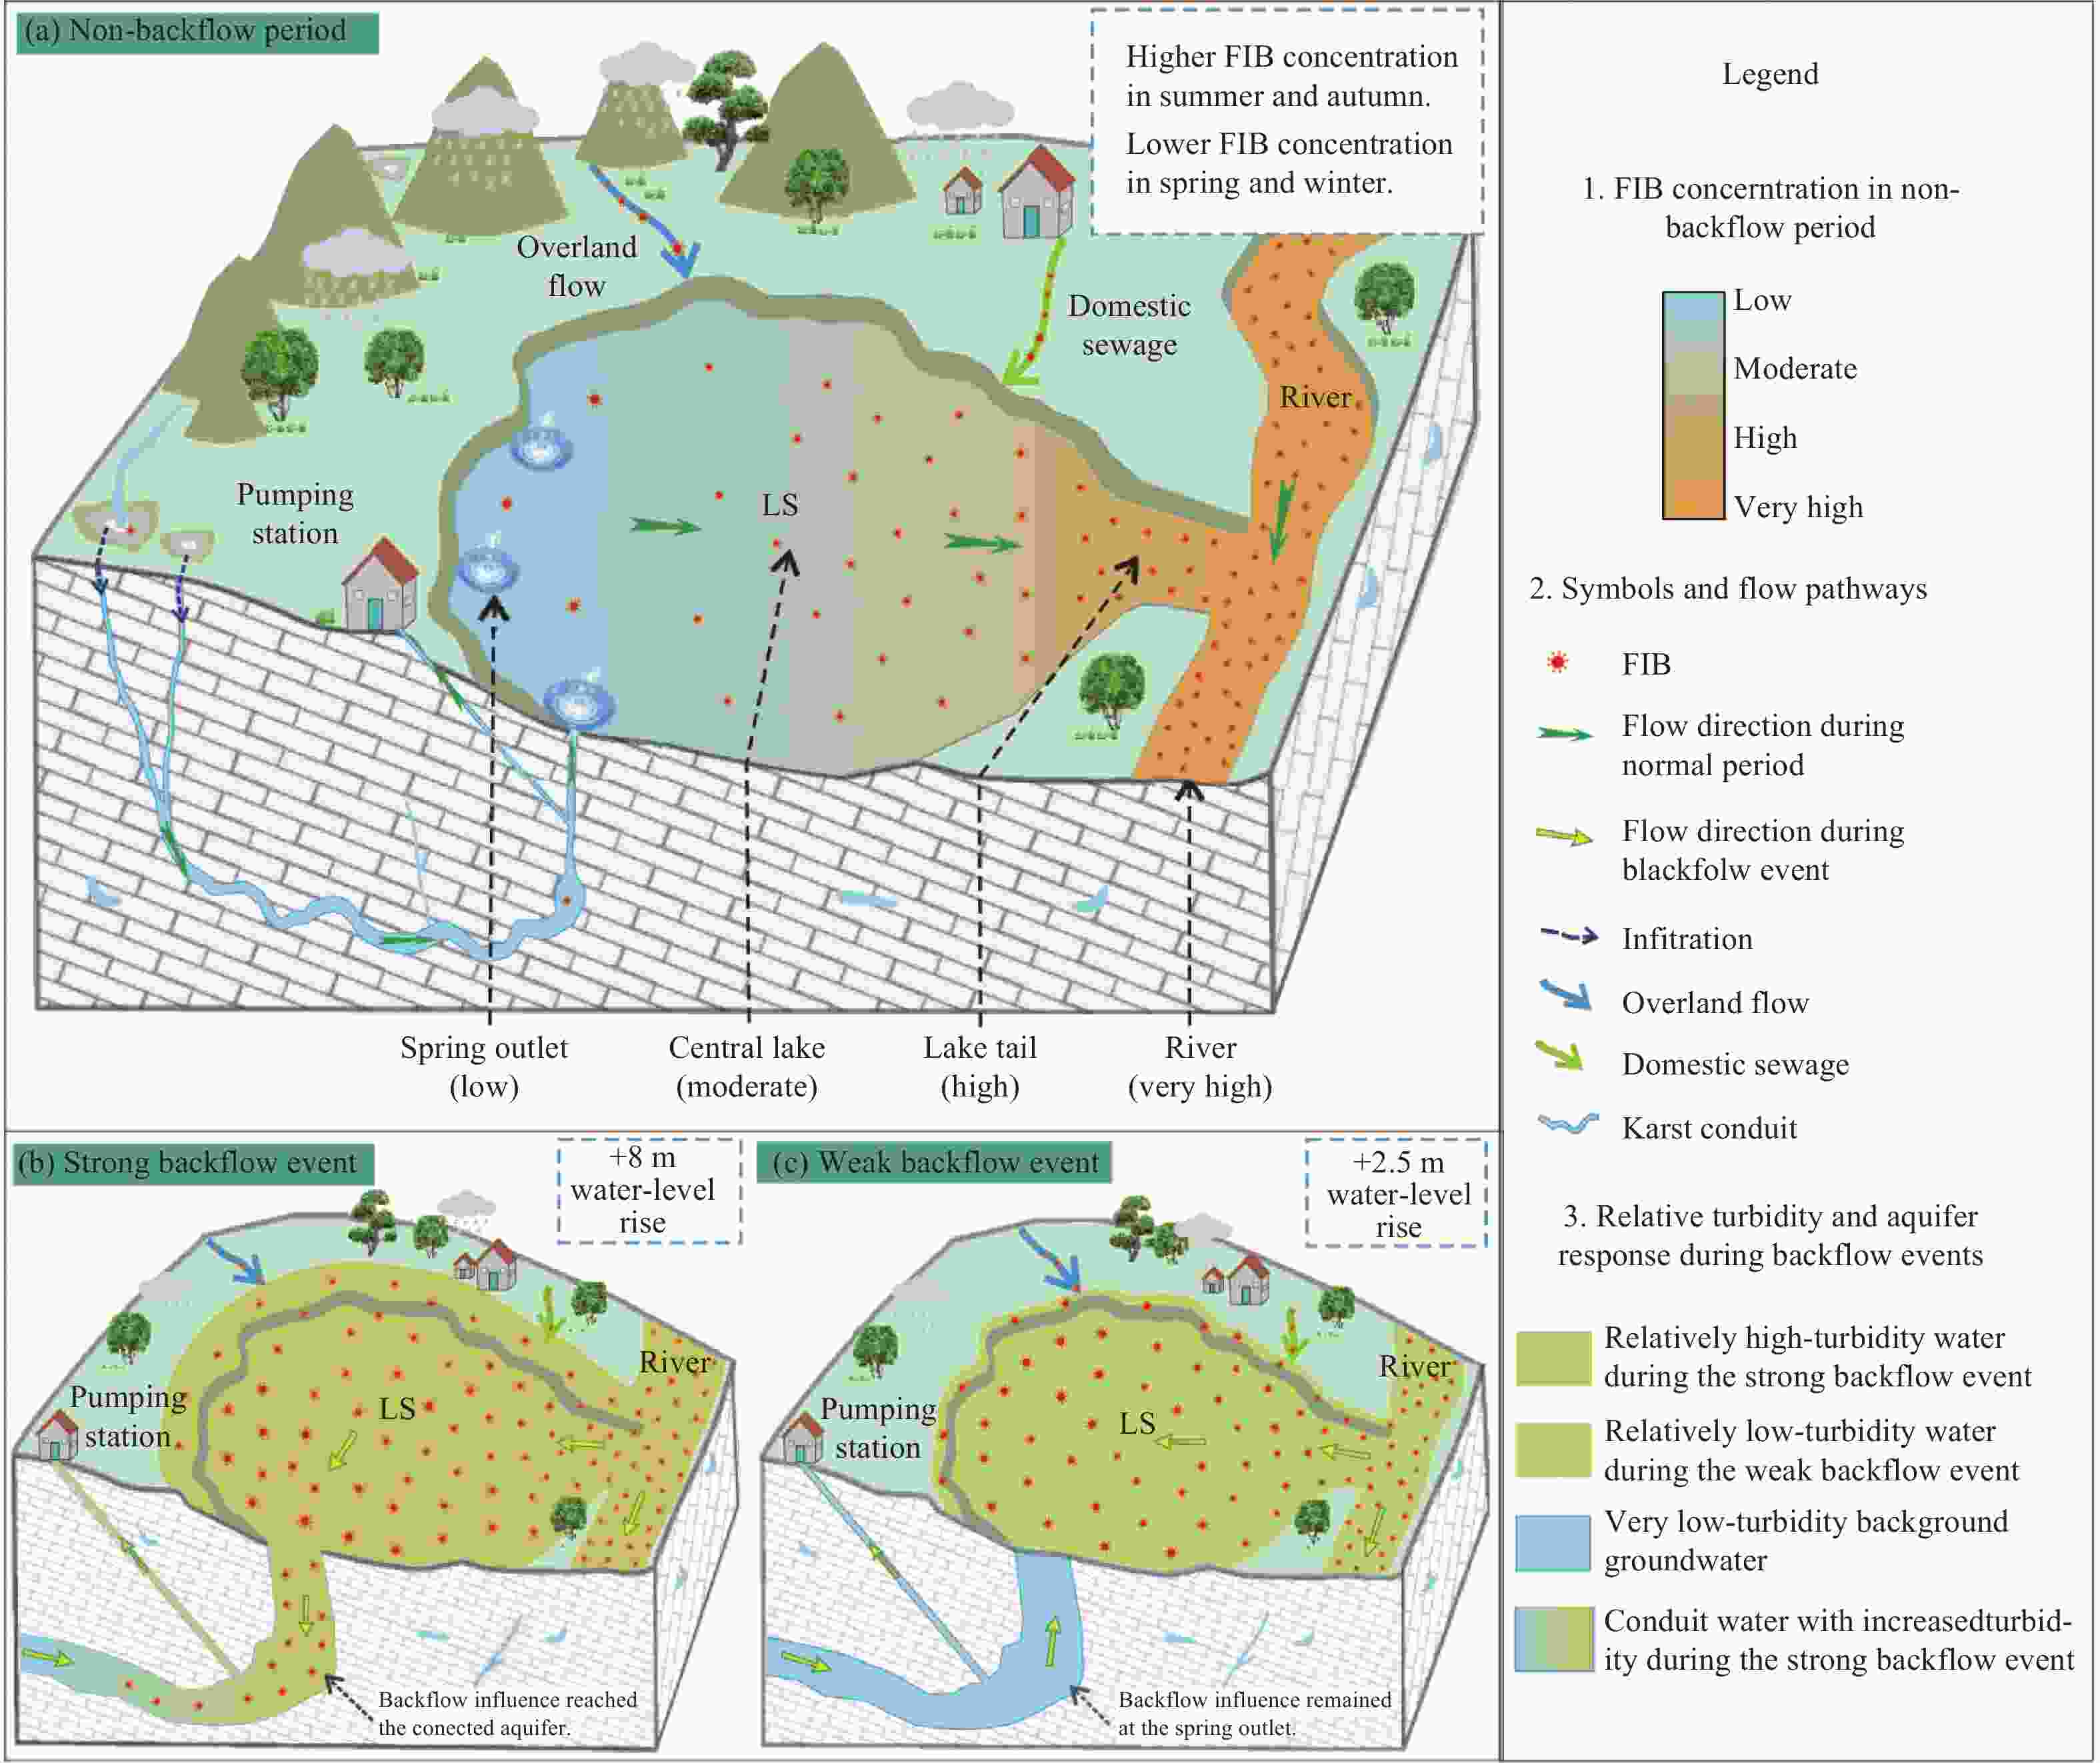
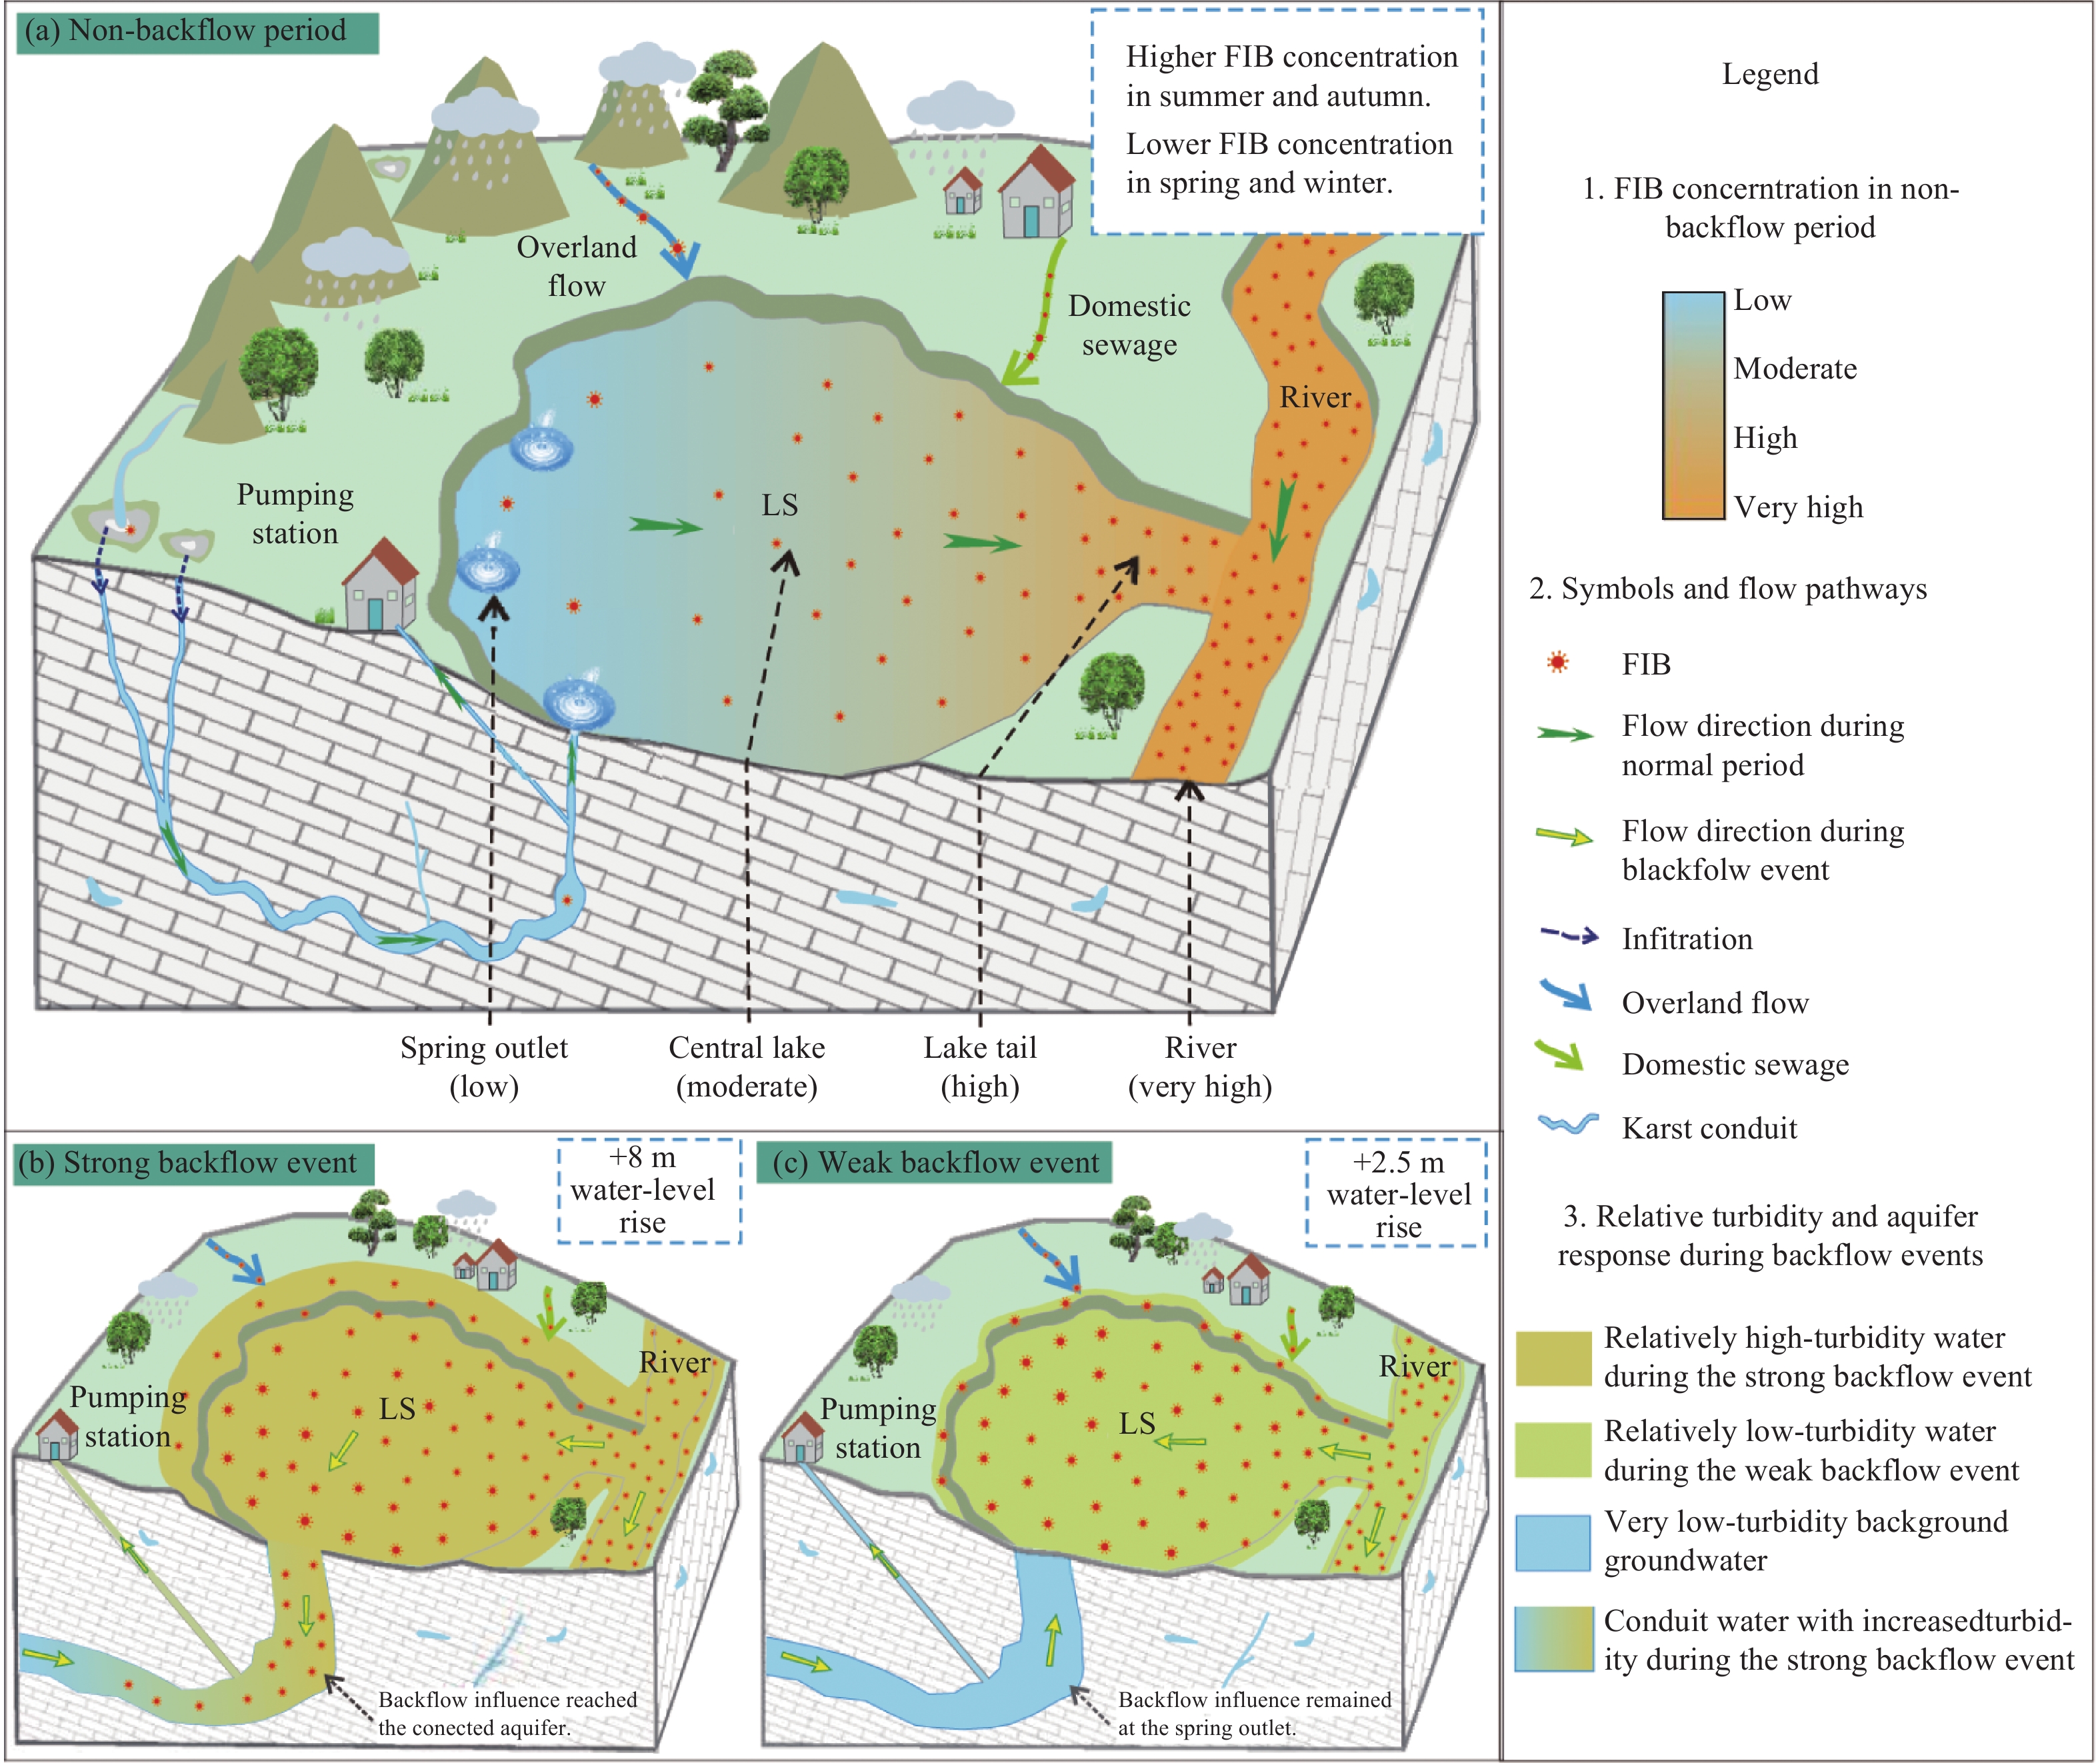
Figure 9. Conceptual model of the FIB sources and dynamics in the karst spring outlet hyporheic zone under contrasting hydrodynamic conditions.
Notes: The model illustrates FIB dynamics under three hydrodynamic scenarios: (a) the non-backflow period, (b) a strong backflow event, and (c) a weak backflow event. FIB mainly originated from the aquifer, river backflow, surrounding domestic sewage, and rainfall-induced runoff. During the non-backflow period, FIB concentrations were higher in summer and autumn than in spring and winter. Generally, they increased from the spring outlet to the central lake, lake tail, and river-affected zone. Both river backflow events led to marked increases in FIB concentrations at LS. The strong backflow event was associated with an approximately 8 m rise in water level, with effects extending to both the hyporheic zone and the connected aquifer. In contrast, the weak backflow event involved a water-level rise of only approximately 2.5 m, and its influence was mainly restricted to the hyporheic zone.
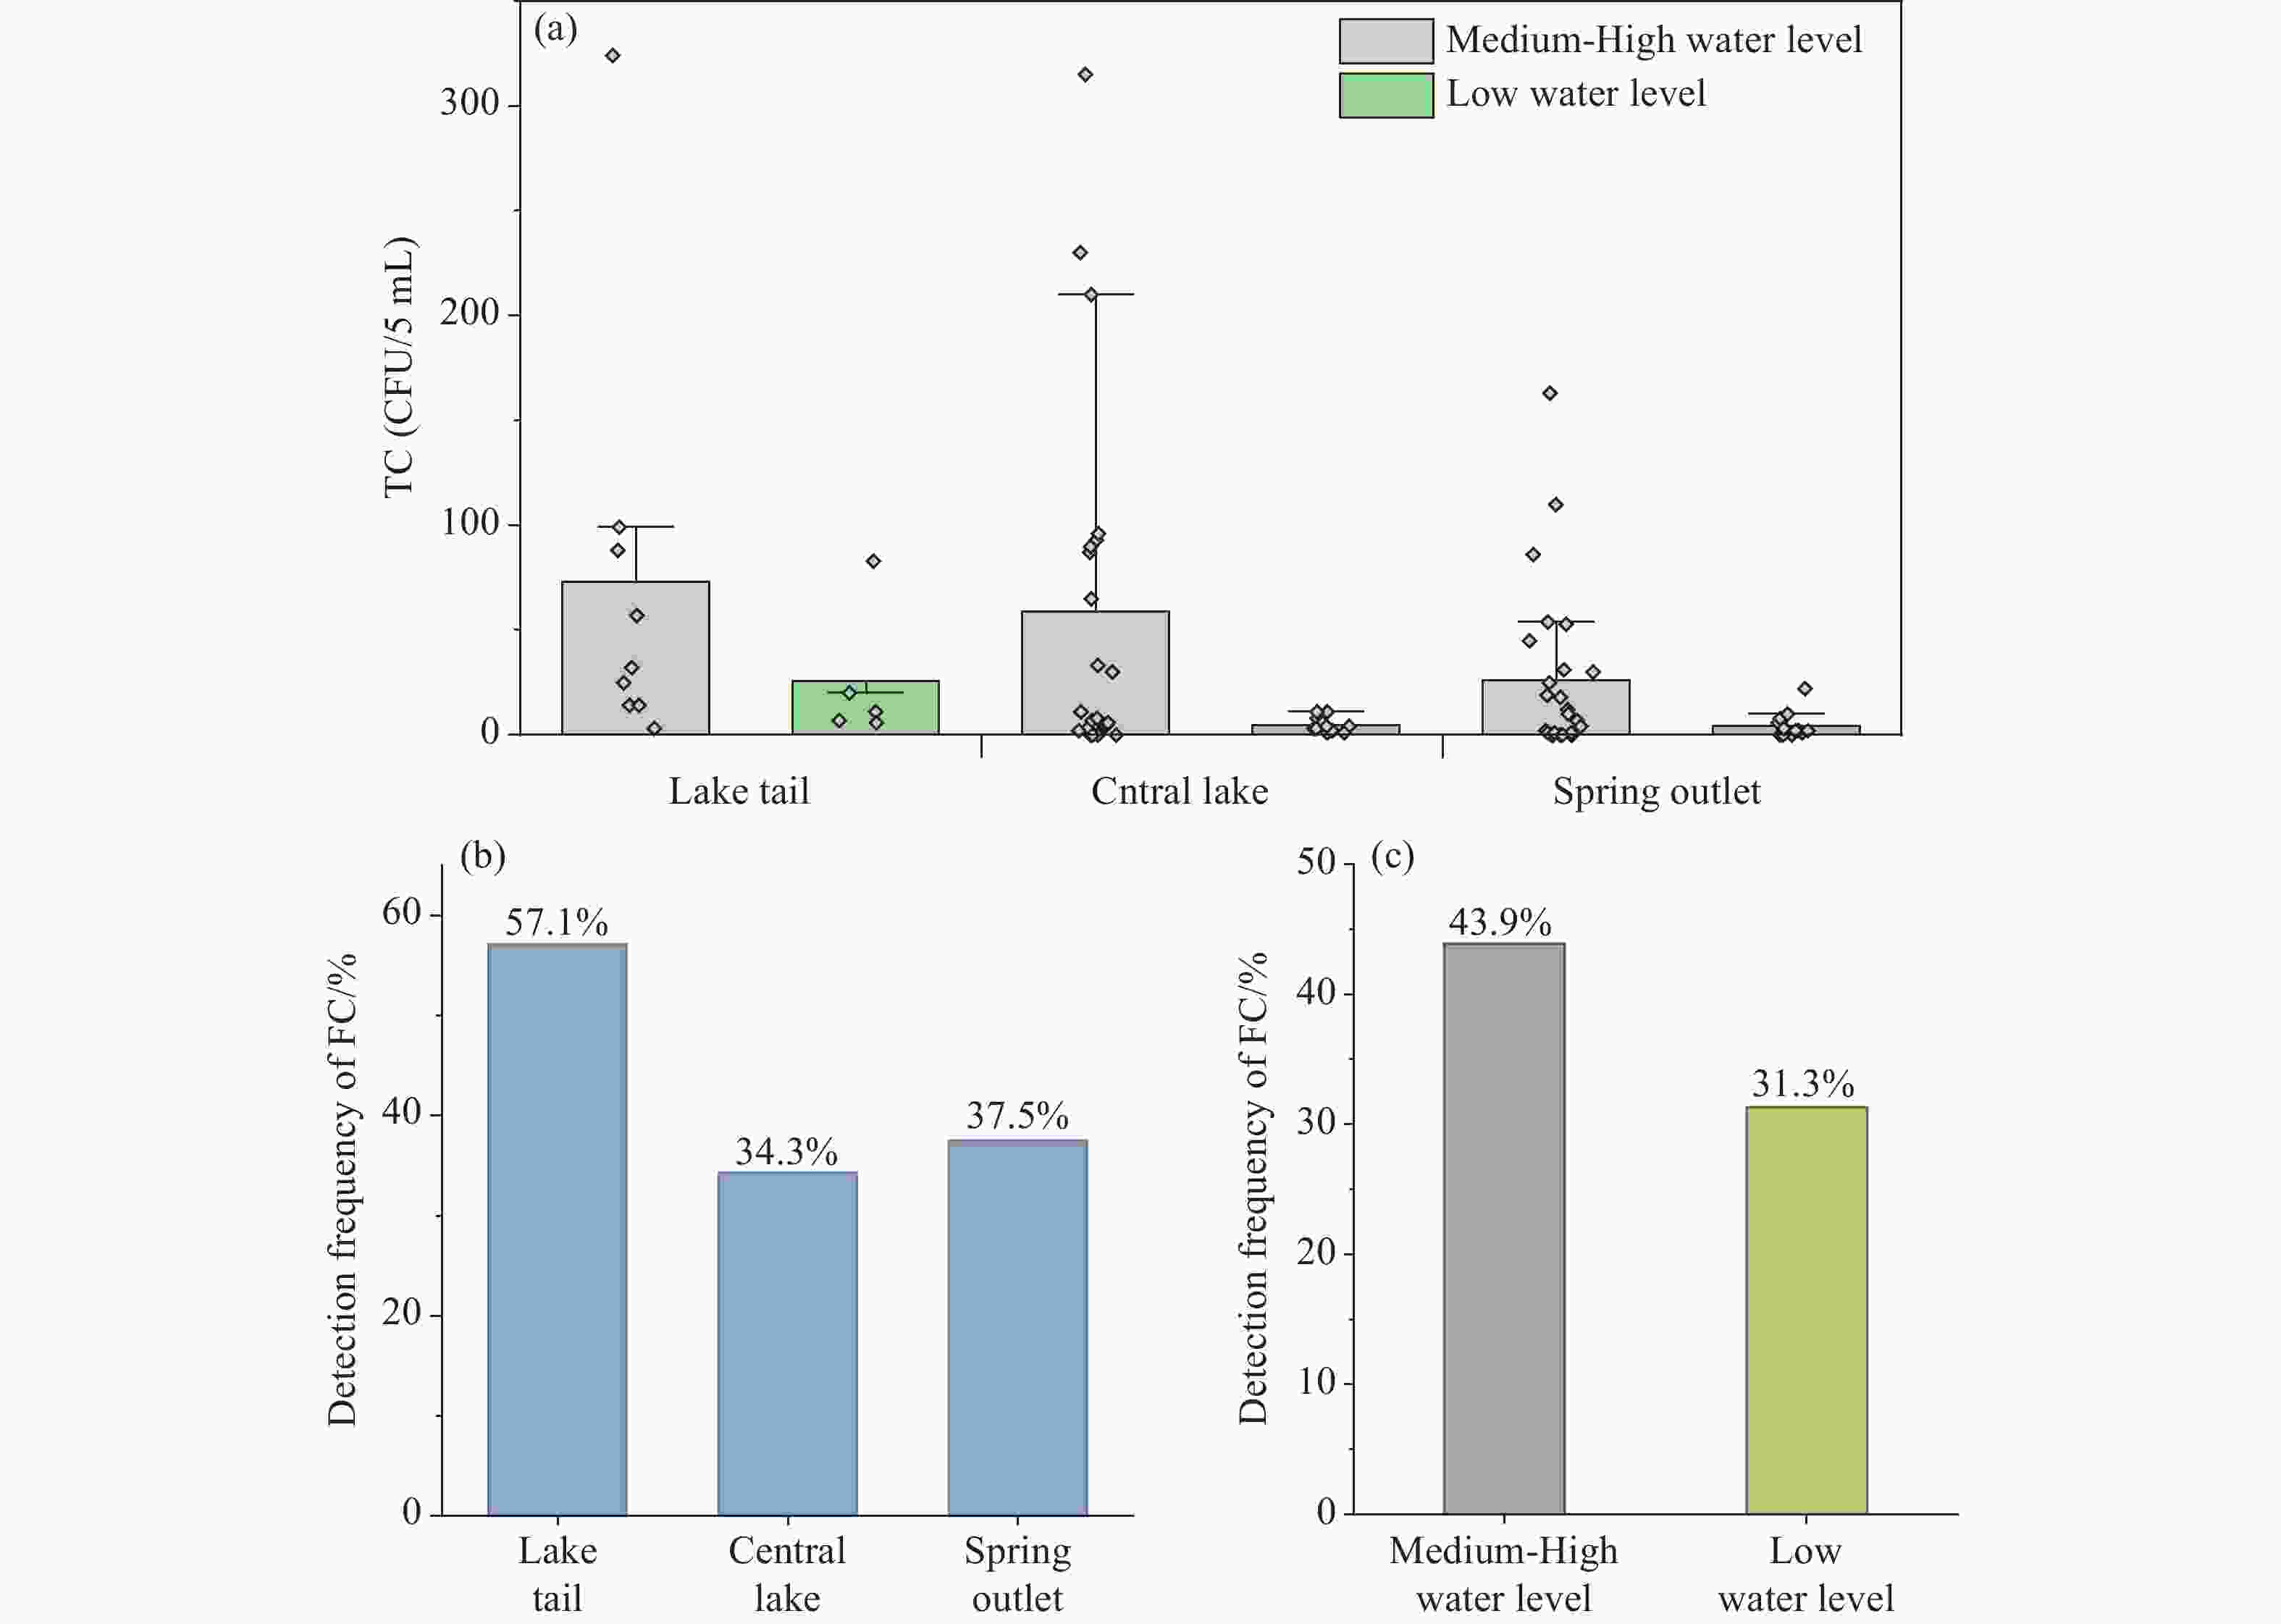
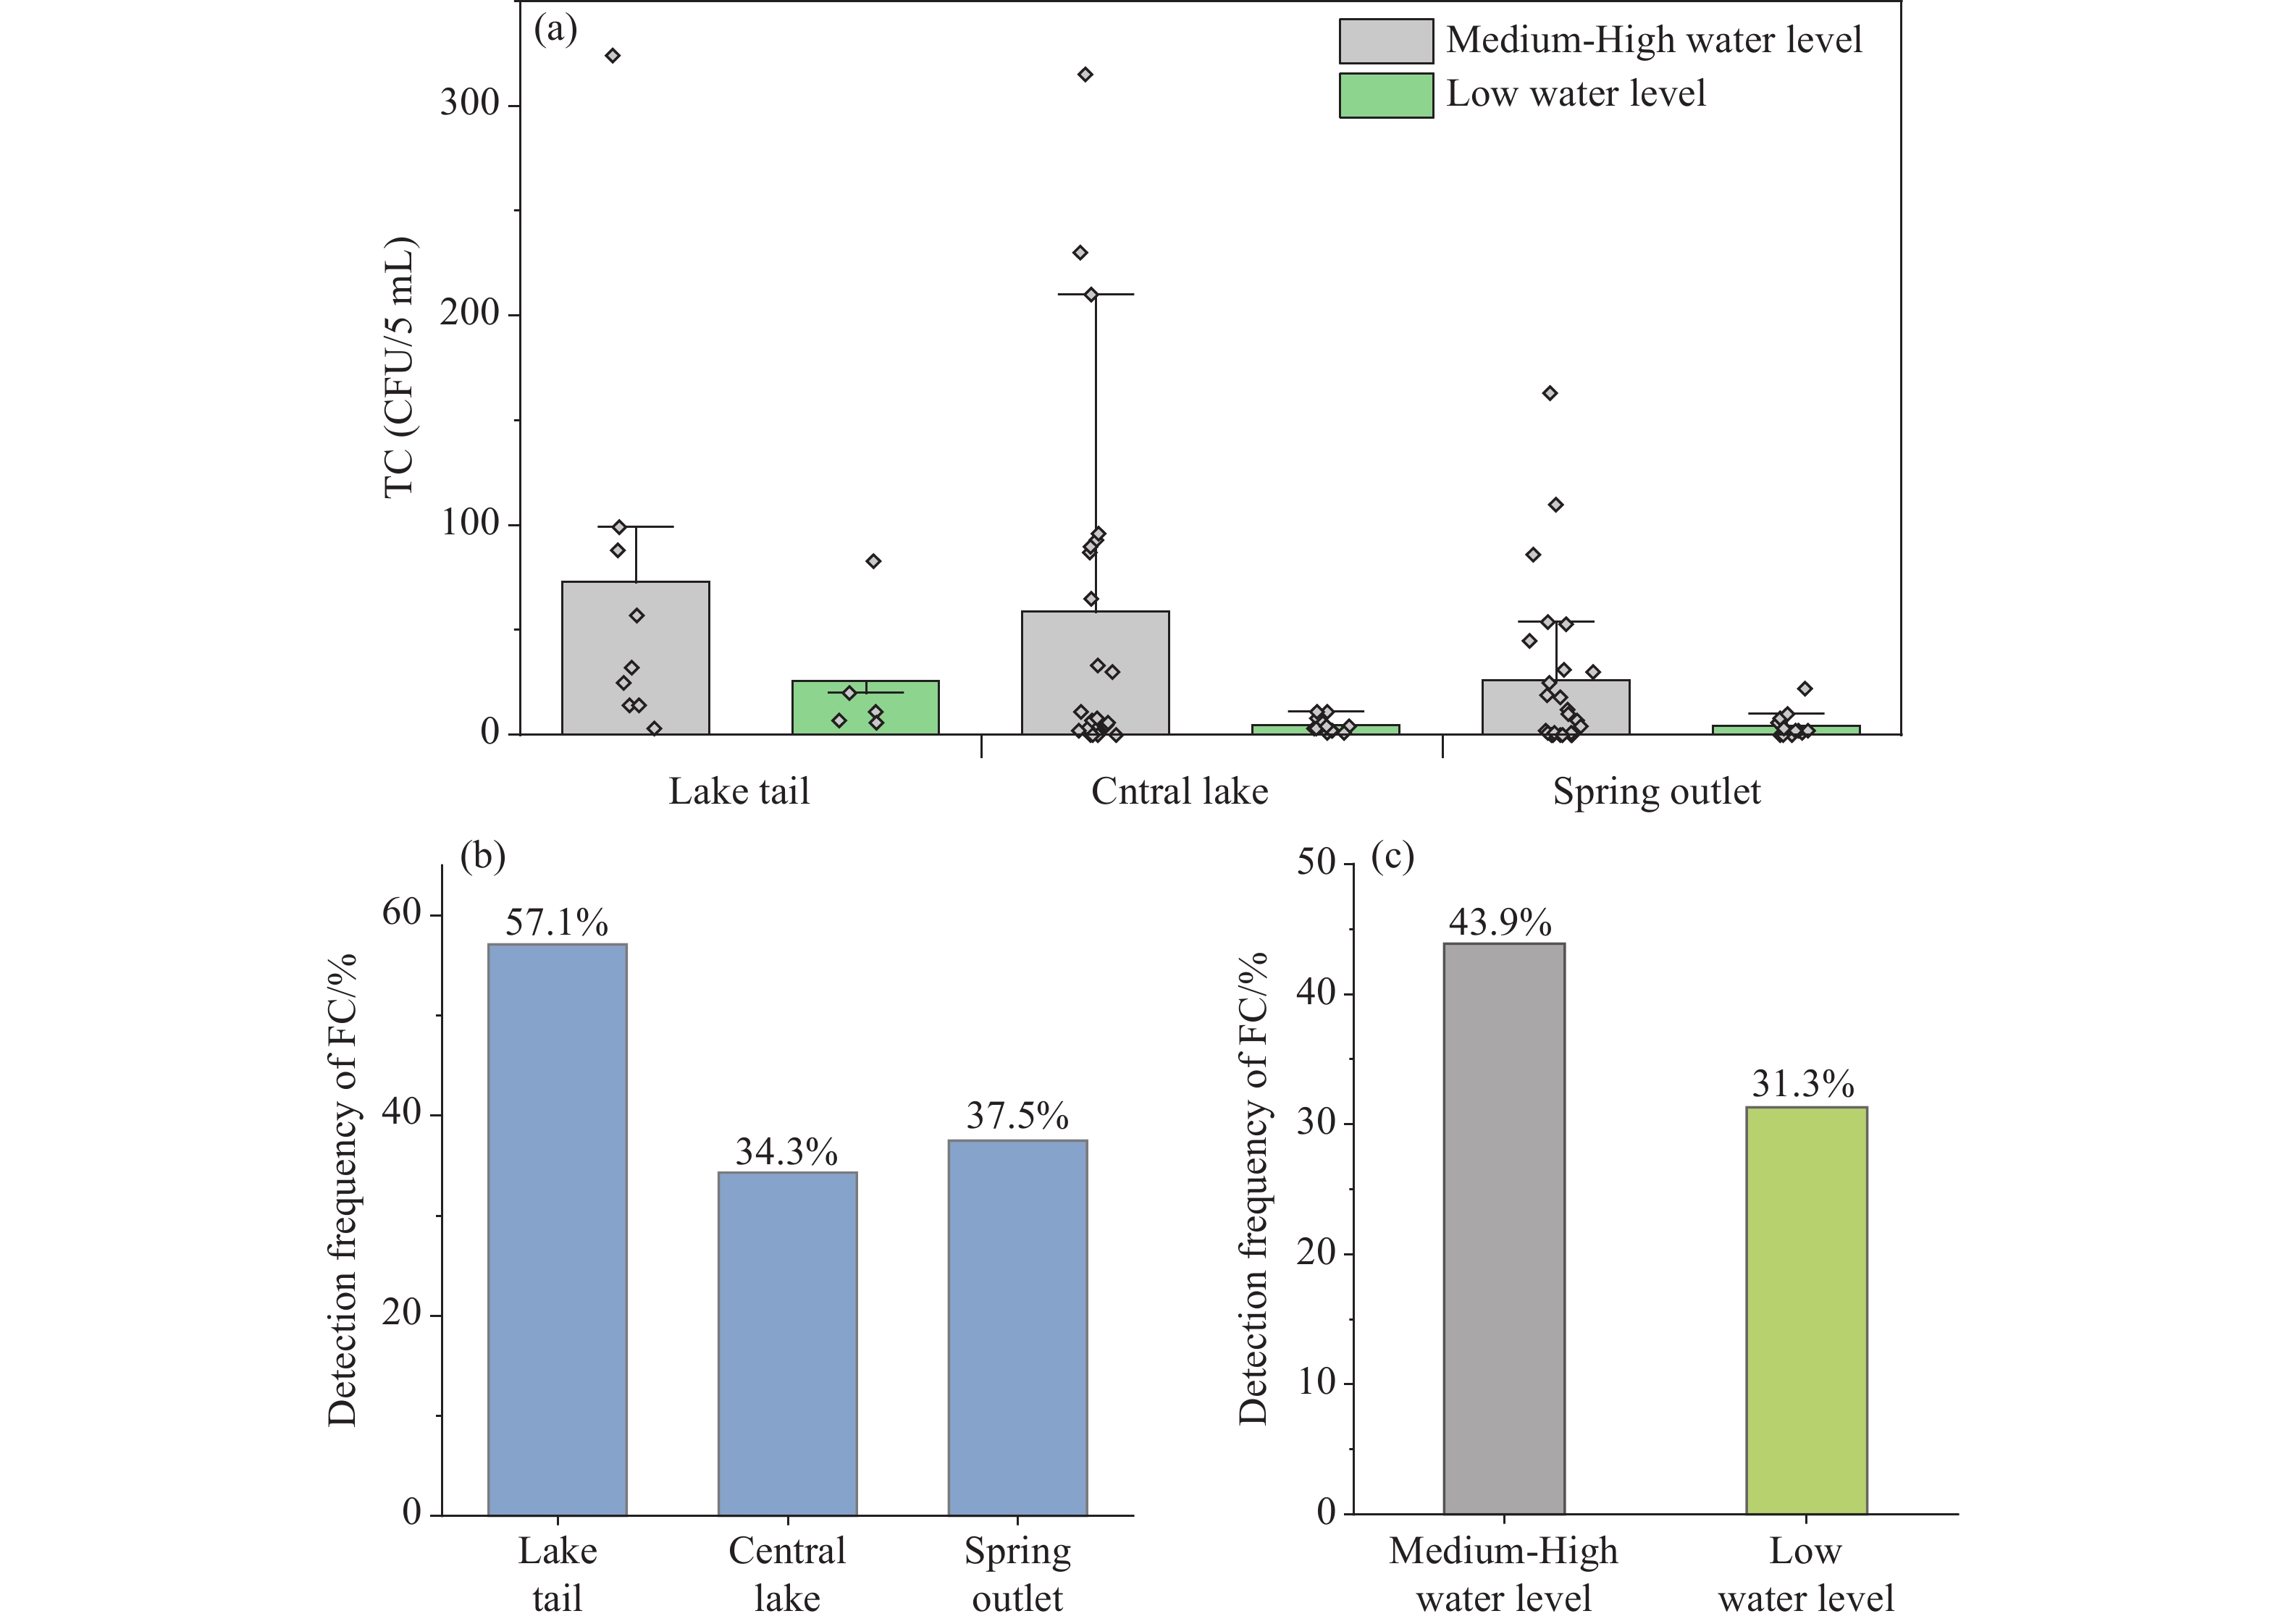
Figure 10. TC concentration and FC detection frequency in the hyporheic zone under different water-level conditions.
Notes: (a) TC concentration by sampling zone and water level; (b) FC detection frequency by sampling zone; and (c) overall FC detection frequency by water level.
Table 1. Seasonal variation of integrated environmental factors in the hyporheic zone (mean ± SD).
Spring (N=17) Summer (N=19) Autumn (N=23) Winter (N=23) pH 7.32±0.13 7.18±0.10 7.23±0.18 7.38±0.17 WT (°C) 24.21±0.39 24.46±0.23 24.40±0.23 24.01±0.34 DO (mg/L) 4.31±0.54 4.06±0.75 3.88±0.51 5.11±1.13 SEC (μS/cm) 378.9±15.1 380.4±18.2 383.6±16.0 381.4±14.2 Chl-a (μg/L) 0.22±0.20 0.18±0.16 0.20±0.30 0.09±0.08 CDOM (μg/L) 0.02±0.07 0.81±1.13 0.84±0.90 0.15±0.23 ORP (mV) 331.6±13.7 332.4±85.6 336.3±43.0 339.5±44.2  下载: 导出CSV
Table 2. Measured physicochemical parameters in hyporheic zone and river.
Spring outlet Lake River Range Mean Range Mean Range Mean pH 6.82–7.45 7.24 7.01–7.93 7.31 7.35–8.43 7.75 WT (°C) 23.93–24.72 24.27 23.53–24.95 24.27 14.71–31.32 24.85 DO (mg/L) 3.10–7.44 4.13 3.38–7.15 4.52 4.35–9.12 7.32 SEC (μS/cm) 336.3–413.9 378.51 363.8–398.2 383.02 222.7–414 294.5 Chl-a (μg/L) 0.00–0.91 0.11 0.03–0.91 0.21 0.55–9.75 2.15 CDOM (μg/L) 0.00–2.31 0.25 0.00–4.46 0.67 4.26–19.86 11.19 DOC (mg/L) 0.25–4 1.07 0.23–5.06 1.31 1.05–15.76 7.77 Turb. (NTU) 0.01–0.86 0.43 0.01–1.38 0.57 3.36–11.40 7.62 Cl− (mg/L) 5.09–6.89 6.14 5.00–6.77 5.94 6.04–33.96 9.92 SO42− (mg/L) 0.96–8.54 4.09 1.88–5.48 3.81 6.01–15.42 10.07 PO43− (mg/L) 0–0.12 0.05 0–0.08 0.03 0–0.64 0.101 NO3− (mg/L) 0–23.56 9.10 0–11.68 6.50 0–13.14 2.77 NO2− (mg/L) 0–0.018 0.005 0–4.82 0.788 0–3.18 0.439 NH4+ (mg/L) 0–0.02 0.005 0–0.062 0.011 0–0.2 0.034
下载: 导出CSV
Table 3. Changes in major pollutants in the hyporheic zone before and after river backflow
Period Date Site Cl− (mg/L) SO42− (mg/L) NH4+ (mg/L) NO2− (mg/L) NO3− (mg/L) PO43− (mg/L) Normal period 2021/1/13 L6 5.84 5.48 – – 8.94 – 2021/4/7 L6 5.96 3.36 0 0.003 8.94 0.08 Backflow period 2021/6/2 12:00 Y2 6.54 7.49 0 3.54 0.36 0 2021/6/3 8:00 Y2 6.54 9.68 1.35 0.003 9.55 0.08 2021/6/4 10:30 Y2 6.30 6.05 0 5.62 0 0 Normal period 2021/9/16 L6 5.00 2.8 – – – – 2021/12/22 L6 5.57 3.77 – – 9.92 0.05 2022/4/19 L6 6.40 3.54 0 3.57 – 0.03 2023/5/31 L6 6.68 4.01 0 4.82 0.80 0 2023/9/6 L6 6.37 3.25 0 0 – 0 2024/7/15 L6 6.26 3.54 0.02 0 10.49 0 Backflow period 2024/9/8 7:09 L6 8.18 11.42 0.08 0 0 0 2024/9/8 9:00 L6 7.83 4.22 0.12 0 0 0 2024/9/8 14:00 L6 10.10 15.46 1.27 0 0 0.071 2024/9/8 22:00 L6 8.07 10.66 0 0 0 0 2024/9/8 22:00 S2 7.69 10.74 0 0 0 0 Notes: – indicates missing data
下载: 导出CSV
Table 4. Correlation coefficients for environmental factors with FIB.
Log10 (TC +1) Log10 (FC + 1) Log10 (NO3− + 1) −0.579** −0.439** Log10 (NO2− + 1) 0.409* 0.432* Log10 (NH4+ + 1) −0.007 −0.311 Log10 (PO43− + 1) −0.308 0.003 Log10 (Turb. + 1) 0.436 0.157 Log10 (DOC + 1) 0.392* 0.274 Log10 (Chla + 1) 0.329** 0.453** Log10 (CDOM + 1) 0.418** 0.314* Log10 (WT + 1) 0.423** 0.202 Log10 (pH + 1) 0.142 0.096 Log10 (ORP + 1) 0.130 0.073 Log10 (SEC + 1) −0.043 0.100 Log10 (DO + 1) 0.002 −0.051 Notes: Values represent Pearson correlation coefficients. "**" indicates significance at p < 0.01; "*" indicates significance at p < 0.05. Log10 (TC + 1) and Log10 (FC + 1) represent the base-10 logarithmic transformation of TC and FC concentrations, respectively, with 1 added to avoid undefined values when concentrations are zero.
下载: 导出CSV
-
Bradshaw JK, Snyder BJ, Spidle D, Sidle RC, Sullivan K, Molina M. 2021. Sediment and fecal indicator bacteria loading in a mixed land use watershed: Contributions from suspended sediment and bedload transport. Journal of Environmental Quality, 50(3): 598−611. DOI: 10.1002/jeq2.20166. Chudoba EA, Mallin MA, Cahoon LB, Skrabal SA. 2013. Stimulation of fecal bacteria in ambient waters by experimental inputs of organic and inorganic phosphorus. Water Research, 47(10): 3455−3466. DOI: 10.1016/j.watres.2013.03.047. Cui G, Su XS, Zheng SD, Tong SZ, Jiang M. 2024. Hydrological and biogeochemical processes controlling riparian groundwater quantity and quality during riverbank filtration. Environmental Pollution, 350: 124020. DOI: 10.1016/j.envpol.2024.124020. Epting J, Huggenberger P, Radny D, Hammes F, Hollender J, Page RM, Weber S, Bänninger D, Auckenthaler A. 2018. Spatiotemporal scales of river-groundwater interaction – The role of local interaction processes and regional groundwater regimes. Science of The Total Environment, 618: 1224−1243. DOI: 10.1016/j.scitotenv.2017.09.219. Goldscheider N. 2005. Karst groundwater vulnerability mapping: Application of a new method in the Swabian Alb, Germany. Hydrogeology Journal, 13(4): 555−564. DOI: 10.1007/s10040-003-0291-3. Guo F, Jiang, GH, Liu, SH. 2018. Change of water environment in Lingshui karst spring and new issues faced in water resources management and protection. Guangxi Sciences, 25(05): 553−559. (In Chinese) DOI: 10.13656/j.cnki.gxkx.20181101.001. Guo F, Jiang GH, Wang WK, Liu SH. 2019. Concept of karst cave hyporheic zone and its significance in water resource management. Carsologica Sinica, 38(1): 1−9. (In Chinese) DOI: 10.11932/karst20190101. Guo F, Jiang GH. 2020. Hydro-ecological processes of hyporheic zone in a karst spring-fed pool: Effects of groundwater decline and river backflow. Journal of Hydrology, 587: 124987. DOI: 10.1016/j.jhydrol.2020.124987. Guo F, Jiang GH, Polk J. 2024. Karst hyporheic zone and its aquatic environmental effects: A preliminary study in South China. Hydrological Sciences Journal, 69(6): 678−690. DOI: 10.1080/02626667.2024.2328632. Harmon SM, West RT, Yates JR. 2014. Identifying fecal pollution sources using 3MTM PetrifilmTM count plates and antibiotic resistance analysis in the Horse Creek Watershed in Aiken County, SC(USA). Environmental Monitoring and Assessment, 186: 8215−8227. DOI: 10.1007/s10661-014-3999-8. Hodge J, Chang HH, Boisson S, Collin SM, Peletz R, Clasen T. 2016. Assessing the association between thermotolerant coliforms in drinking water and diarrhea: An analysis of individual–level data from multiple studies. Environmental Health Perspective, 124(10): 1560−1567. DOI: 10.1289/EHP156. Hong HC, Qiu JW, Liang Y. 2010. Environmental factors influencing the distribution of total and fecal coliform bacteria in six water storage reservoirs in the Pearl River Delta Region, China. Journal of Environmental Sciences, 22(5): 663−668. DOI: 10.1016/S1001-0742(09)60160-1. Huang T, Wollheim WM, Jones SH. 2022. Removal of fecal indicator bacteria by river networks. Water, 14(4): 617. DOI: 10.3390/w14040617. Huey GM, Meyer ML. 2010. Turbidity as an indicator of water quality in diverse watersheds of the Upper Pecos River Basin. Water, 2(2): 273−284. DOI: 10.3390/w2020273. Jiang GH, Guo F. 2012. Source identification of Lingshui Spring using GIS-based hydrochemistry and environmental isotopic methods. Water Resources Protection, 28(01): 59−63. (In Chinese) Jiang GH, Guo F, Wei LQ, Li WY. 2023. Characterizing the transitory groundwater-surface water interaction and its environmental consequence of a riverside karst pool. Science of The Total Environment, 902: 166532. DOI: 10.1016/j.scitotenv.2023.166532. Jin GQ, Zhang ZT, Yuan HY, Tang HW, Chen HX, Zhang SY. 2022. Advances in the response of surface-subsurface water exchange to activities of typical aquatic organisms in the hyporheic zone of rivers. Advances in Wate Science, 33(5): 835−847. (In Chinese) DOI: 10.14042/j.cnki.32.1309.2022.05.013. Korajkic A, Wanjugi P, Brooks L, Cao YP, Harood VJ. 2019. Persistence and decay of fecal microbiota in aquatic habitats. Microbiology and Molecular Biology Reviews, 83(4): e00005−19. DOI: 10.1128/MMBR.00005-19. Lew S, Glińska-Lewczuk K, Burandt P, Obolewski K, Goździejewska A, Lew M, Dunalska J. 2016. Impact of environmental factors on bacterial communities in floodplain lakes differed by hydrological connectivity. Limnologica, 58: 20−29. DOI: 10.1016/j.limno.2016.02.005. Li B, Li XM. 2018. Characteristics of karst groundwater system in the northern basin of Laiyuan Spring area. Journal of Groundwater Science and Engineering, 6(4): 261−269. DOI: 10.19637/j.cnki.2305-7068.2018.04.002. Li TT, Xu LQ, Li WX, Wang CX, Gin KYH, Chai XL, Wu B. 2024. Dissolved organic carbon spurs bacterial-algal competition and phosphorus-paucity adaptation: Boosting Microcystis' phosphorus uptake capacity. Water Research, 256: 121465. DOI: 10.1016/j.watres.2024.121465. Liu S, Chui TFM. 2019. Numerical modelling to evaluate the nitrogen removal rate in hyporheic zone and its implications for stream management. Hydrological Processes, 33(24): 3084−3097. DOI: 10.1002/hyp.13548. Liu YY, Liu CX, Nelson WC, Shi L, Xu F, Liu YD, Yan A, Zhong LR, Thompson C, Fredrickson JK, Zachara JM. 2017. Effect of water chemistry and hydrodynamics on nitrogen transformation activity and microbial community functional potential in hyporheic zone sediment columns. Environmental Science & Technology, 51(9): 4877−4886. DOI: 10.1021/acs.est.6b05018. Long SH, Guo F, Jiang GH, Wei LQ, Liu F, Huang YQ. 2026. Hydrodynamic characteristics and water-environmental effects of a karst groundwater-fed lake. Journal of China Hydrology, 46(3): 57−63. (In Chinese) DOI: 10.19797/j.cnki.1000-0852.20250367. Morris CL, Pokhrel LR, Williams A, Iverson G. 2022. Understanding factors influencing total coliform and E. coli sampling outcomes in new private water wells in North Carolina, USA. Groundwater for Sustainable Development, 17: 100759. DOI: 10.1016/j.gsd.2022.10 0759. Mosharova IV, Il'inskii VV, Mosharov SA, Akulova AY. 2019. Ecological–microbiological studies of lake beloe in winter and spring with the use of innovation test-systems. Water Resources, 46: 959−965. DOI: 10.1134/S0097807819060149. Mugnai R, Sattamini A, Albuquerque dos Santos JA, Regua-Mangia AH. 2015. A survey of escherichia coli and salmonella in the hyporheic zone of a subtropical stream: Their bacteriological, physicochemical and environmental relationships. PLoS One, 10(6): e0129382. DOI: 10.1371/journal.pone.0129382. Nguyen HTM, Le QTP, Garnier J, Janeau JL, Rochelle-Newall E. 2016. Seasonal variability of faecal indicator bacteria numbers and die-off rates in the Red River basin, North Viet Nam. Scientific Report, 6: 21644. DOI: 10.1038/srep21644. Paule-Mercado MC, Salim I, Sajjad RU, Memon SA, Sukhbaatar C, Lee BY, Lee CH. 2022. Quantifying the effects of land use change and aggregate stormwater management practices on fecal coliform dynamics in a temperate catchment. Science of The Total Environment, 838: 155608. DOI: 10.1016/j.scitotenv.2022.155608. Prusty R, Biswal T. 2020. Physico-chemical, bacteriological and health hazard effect analysis of the water in Taladanda Canal, Paradip area, Odisha, India. Journal of Groundwater Science and Engineering, 8(4): 338−348. DOI: 10.19637/j.cnki.2305-7068.2020.04.004. Ren J, Cheng JQ, Yang J, Zhou YJ. 2018. A review on using heat as a tool for studying groundwater–surface water interactions. Environmental Earth Science, 77(22): 756. DOI: 10.1007/s12665-018-7959-4. Sackett JD, Shope CL, Bruckner JC, Wallace J, Cooper CA, Moser DP. 2019. Microbial community structure and metabolic potential of the hyporheic zone of a large mid-stream channel bar. Geomicrobiology Journal, 36(9): 765−776. DOI: 10.1080/01490451.2019.1621964. Scoullos IM, Lopez Vazquez CM, van de Vossenberg J, Hammond M, Brdjanovic D. 2019. Effect of artificial solar radiation on the die-off of pathogen indicator organisms in urban floods. International Journal of Environmental Research, 13(1): 107−116. DOI: 10.1007/s41742-018-0160-5. Shamsuddin MKN, Sulaiman WNA, Suratman S, Zakaria MP, Samuding K. 2014. Groundwater and surface-water utilisation using a bank infiltration technique in Malaysia. Hydrogeology Journal, 22(3): 543−564. DOI: 10.1007/s10040-014-1122-4. Stange C, Tiehm A. 2020. Occurrence of antibiotic resistance genes and microbial source tracking markers in the water of a karst spring in Germany. Science of The Total Environment, 742: 140529. DOI: 10.1016/j.scitotenv.2020.140529. Stegen JC, Fredrickson JK, Wilkins MJ, Konopka AE, Nelson WC, Arntzen EV, Chrisler WB, Chu RK, Danczak RE, Fansler SJ, Kennedy DW, Resch CT, Tfaily M. 2016. Groundwater–surface water mixing shifts ecological assembly processes and stimulates organic carbon turnover. Nature Communications, 7: 11237. DOI: 10.1038/ncomms11237. Thornton DCO. 2014. Dissolved organic matter (DOM) release by phytoplankton in the contemporary and future ocean. European Journal of Phycology, 49(1): 20−46. DOI: 10.1080/09670262.2013.875596. Thrane JE, Hessen DO, Andersen T. 2014. The absorption of light in lakes: Negative impact of dissolved organic carbon on primary productivity. Ecosystems, 17(6): 1040−1052. DOI: 10.1007/s10021-014-9776-2. Van Driezum IH, Chik AHS, Jakwerth S, Lindner G, Farnleitner AH, Sommer R, Blaschke AP, Kirschner AKT. 2018. Spatiotemporal analysis of bacterial biomass and activity to understand surface and groundwater interactions in a highly dynamic riverbank filtration system. Science of The Total Environment, 627: 450−461. DOI: 10.1016/j.scitotenv.2018.01.226. Wei LQ, Guo F, Jiang GH. 2022. Responses of plankton community to water environment changes in karst springs in Wuming Basin, Guangxi Province. Journal of Lake Science, 34(3): 777−790. (in Chinese) DOI: 10.18307/2022.0307. Xia RY. 2016. Groundwater resources in karst area in Southern China and sustainable utilization pattern. Journal of Groundwater Science and Engineering, 4(4): 301−309. DOI: 10.26599/JGSE.2016.9280034. Xu GZ, Wang T, Wei Y, Zhang YX, Chen JL. 2022. Fecal coliform distribution and health risk assessment in surface water in an urban-intensive catchment. Journal of Hydrology, 604: 127204. DOI: 10.1016/j.jhydrol.2021.127204. Zhang XY, Zhi X, Chen L, Shen ZY. 2020. Spatiotemporal variability and key influencing factors of river fecal coliform within a typical complex watershed. Water Research, 178: 115835. DOI: 10.1016/j.watres.2020.115835. Zhang Y, Kelly WR, Panno SV, Liu WT. 2014. Tracing fecal pollution sources in karst groundwater by Bacteroidales genetic biomarkers, bacterial indicators, and environmental variables. Science of The Total Environment, 490: 1082−1090. DOI: 10.1016/j.scitotenv.2014.05.086. Zhang Y, Wu RR, Zhang YM, Wang G, Li KM. 2018. Impact of nutrient addition on diversity and fate of fecal bacteria. Science of The Total Environment, 636: 717−726. DOI: 10.1016/j.scitotenv.2018.04.312. -

 点击查看大图
计量
- 文章访问数: 18
- HTML全文浏览量: 8
- PDF下载量: 0
- 被引次数: 0


