 E-mail alert
 Rss
Rss

Ecological vulnerability assessment and driving force analysis of small watersheds in Hilly Regions using sensitivity-resilience-pressure modeling
-
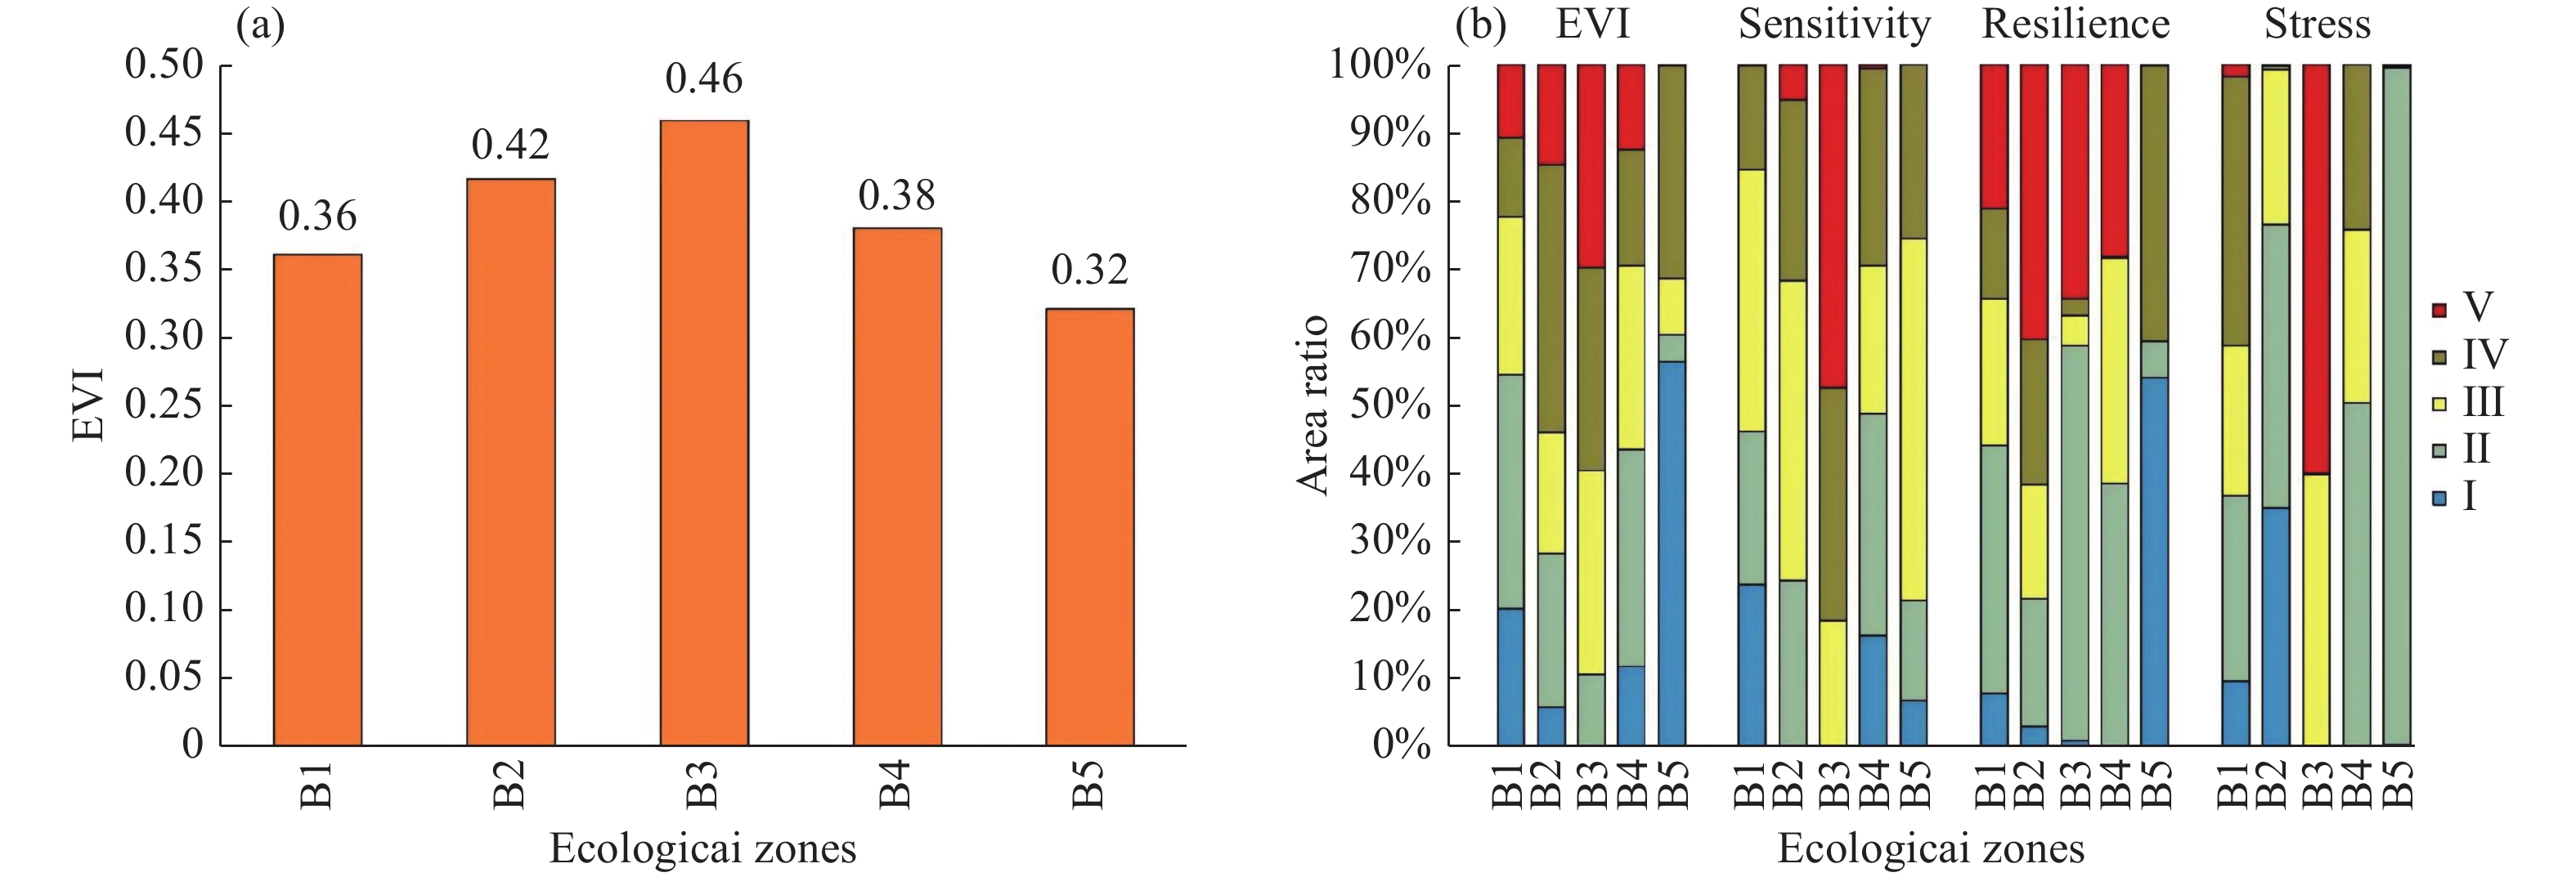
Abstract: Pingquan City, the origin of five rivers, serves as the core water conservation zone for the Beijing-Tianjin-Hebei region and exemplifies the characteristics of small watersheds in hilly areas. In recent years, excessive mining and intensified human activities have severely disrupted the local ecosystem, creating an urgent need for ecological vulnerability assessment to enhance water conservation functions. This study employed the sensitivity-resilience-pressure model, integrating various data sources, including regional background, hydro-meteorological data, field investigations, remote sensing analysis, and socio-economic data. The weights of the model indices were determined using an entropy weighting model that combines principal component analysis and the analytic hierarchy process. Using the ArcGIS platform, the spatial distribution and driving forces of ecological vulnerability in 2020 were analyzed, providing valuable insights for regional ecological restoration. The results indicated that the overall Ecological Vulnerability Index (EVI) was 0.389, signifying moderate ecological vulnerability, with significant variation between watersheds. The Daling River Basin had a high EVI, with ecological vulnerability primarily in levels IV and V, indicating high ecological pressure, whereas the Laoniu River Basin had a low EVI, reflecting minimal ecological pressure. Soil type was identified as the primary driving factor, followed by elevation, temperature, and soil erosion as secondary factors. It is recommended to focus on key regions and critical factors while conducting comprehensive monitoring and assessment to ensure the long-term success of ecological management efforts.
-
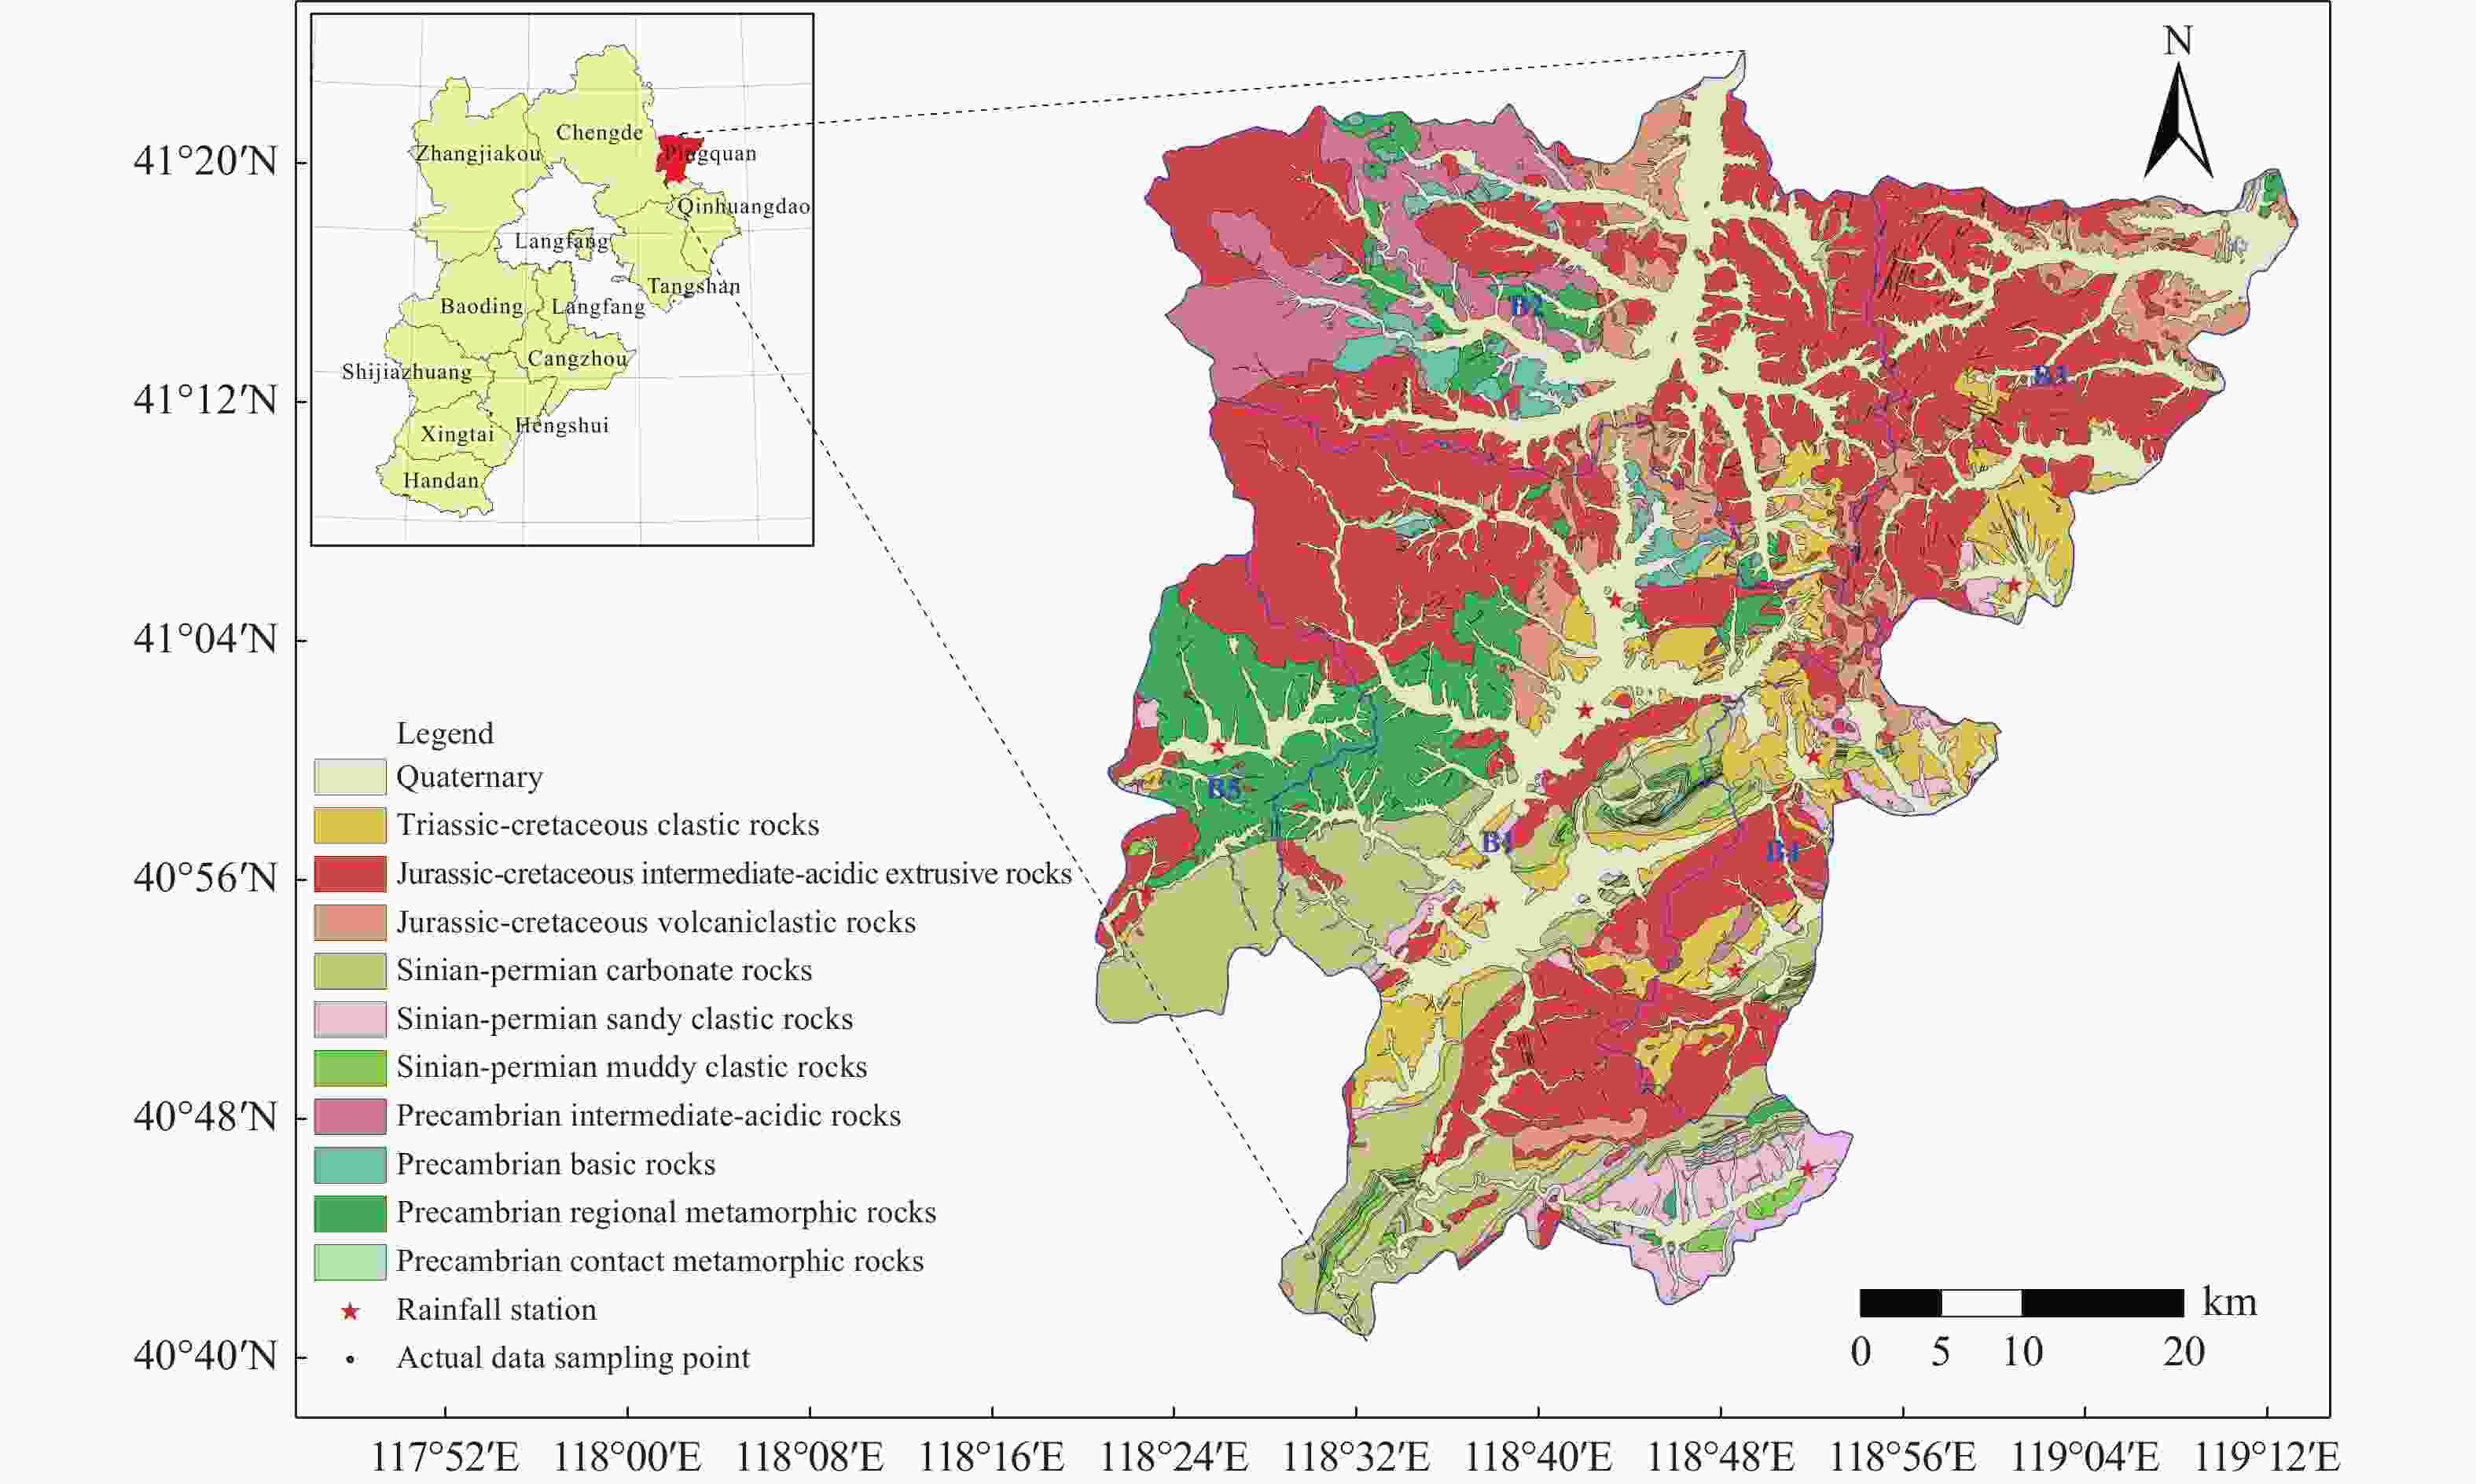
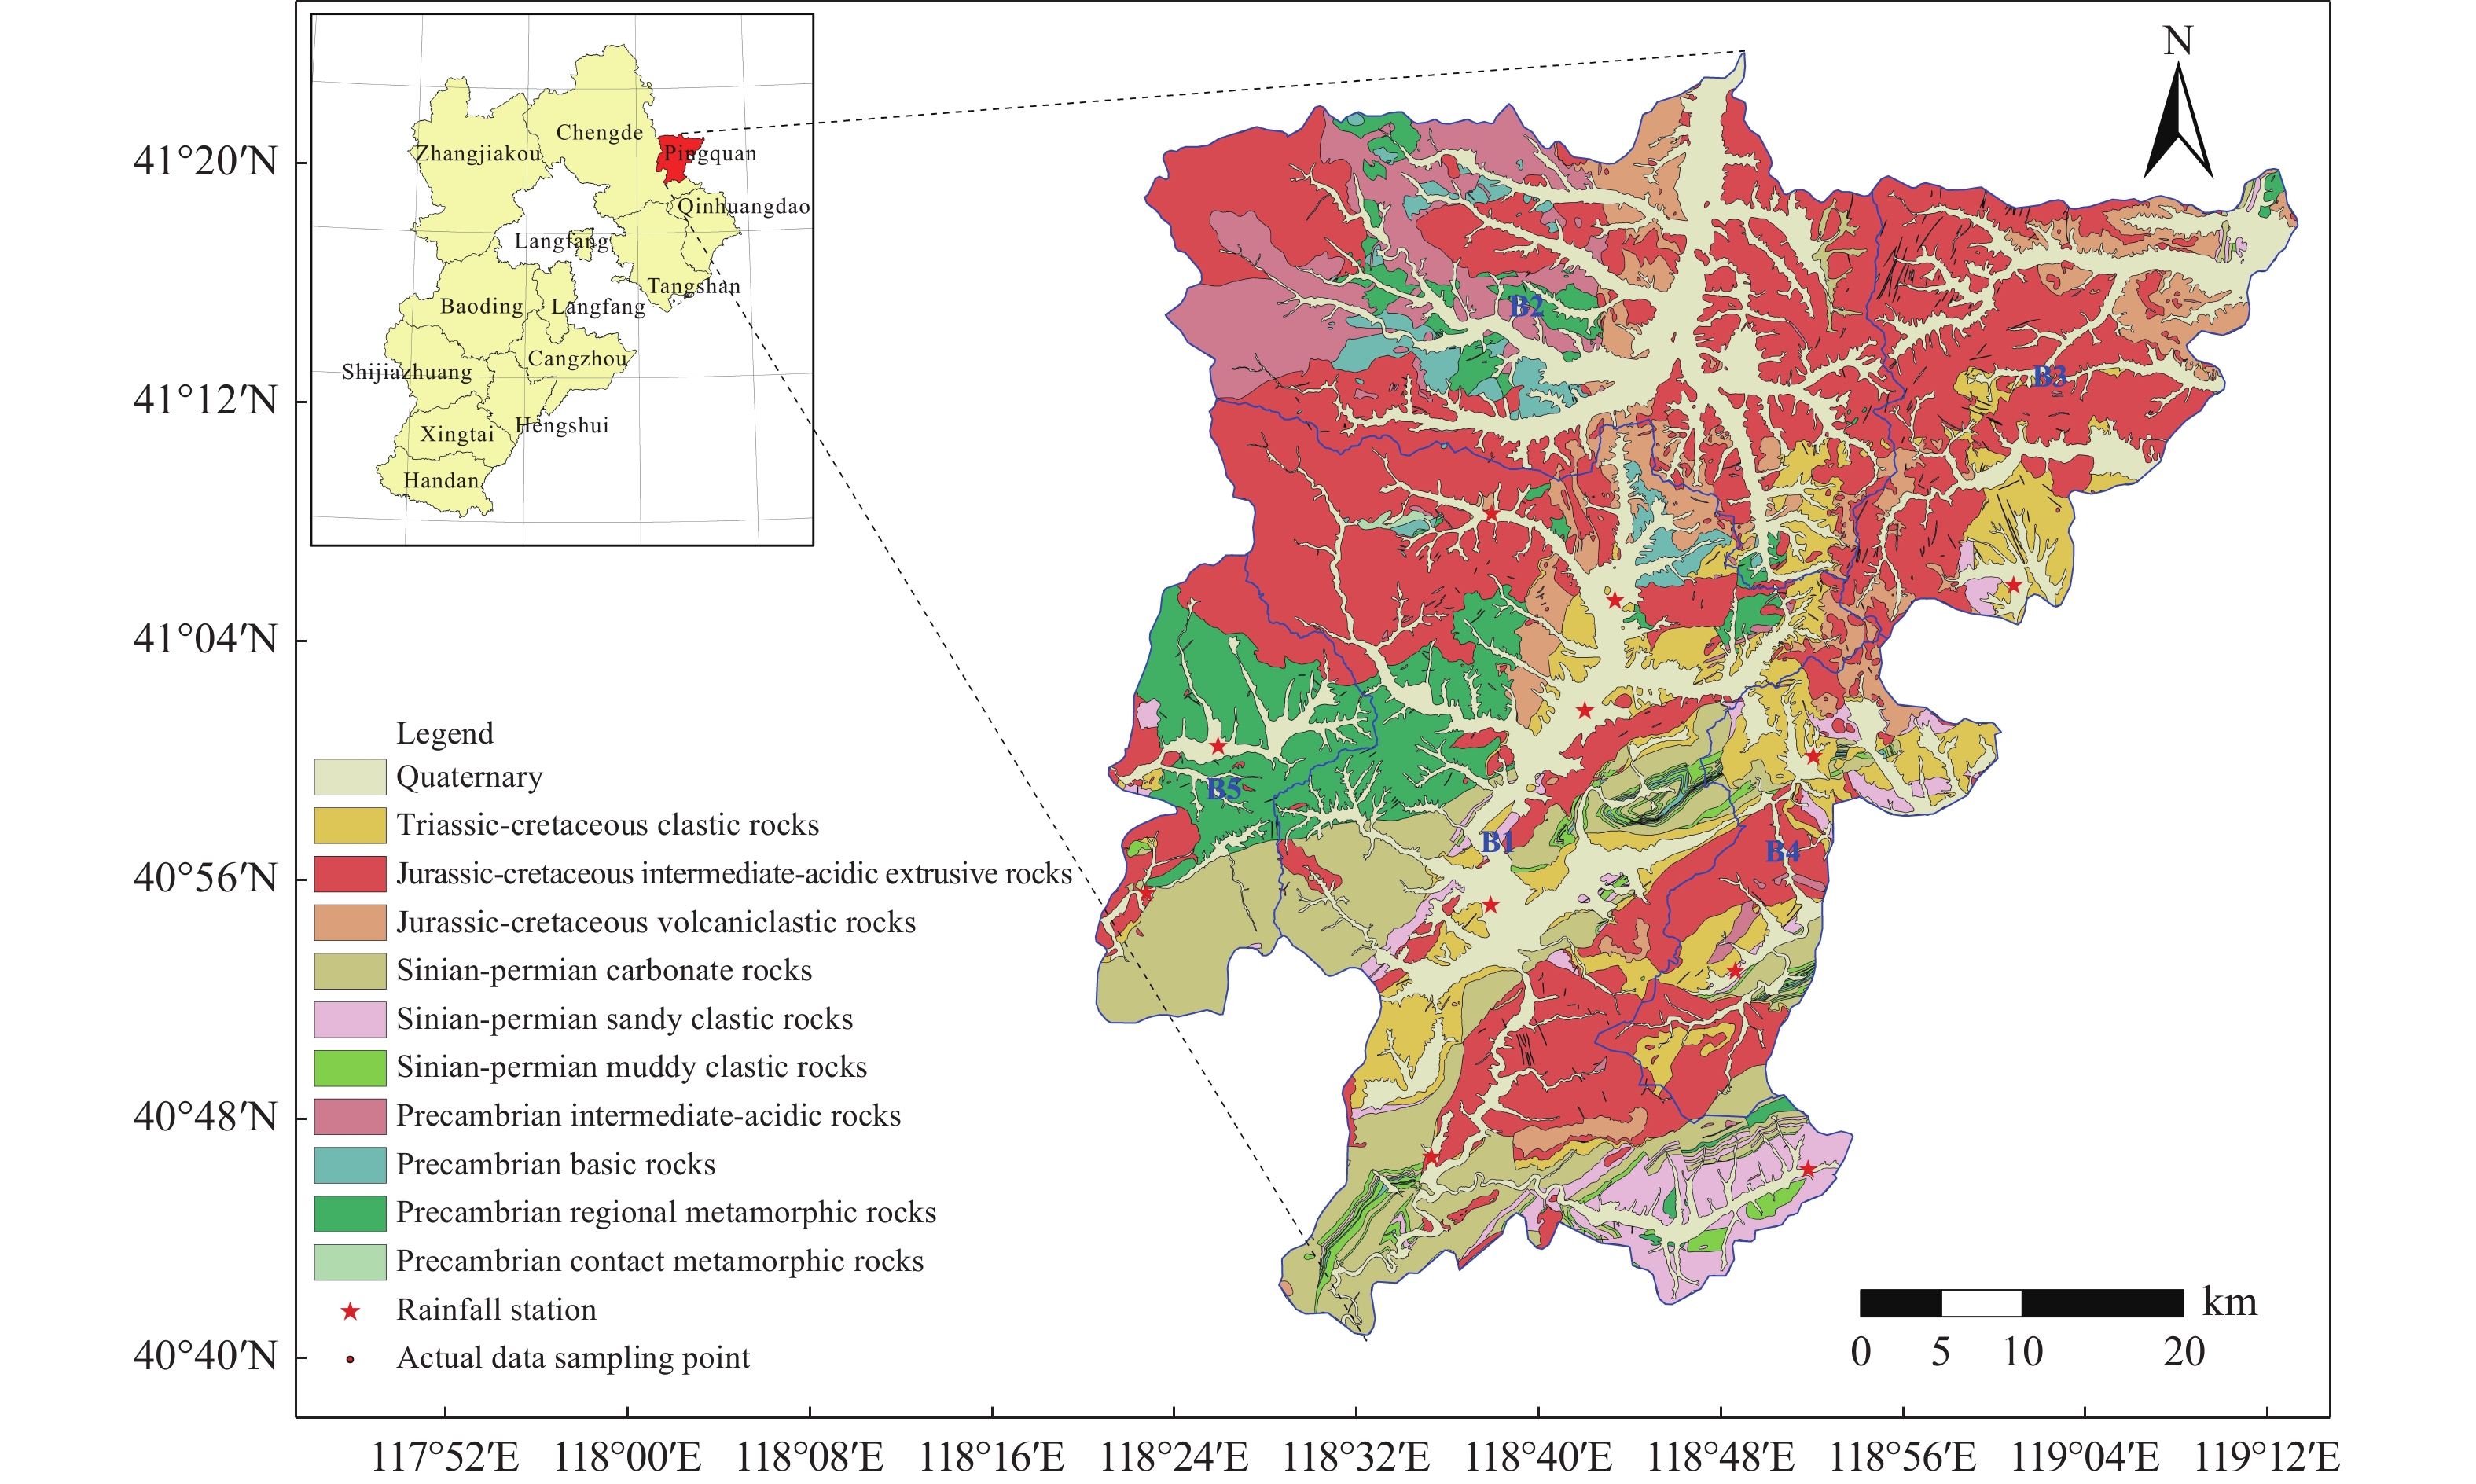
Figure 1. Location and geologic map of the study area (B1: Cascade River Basin; B2: Laoha River Basin; B3: Daling River Basin; B4: Qinglong River Basin; B5: Laoniu River Basin)
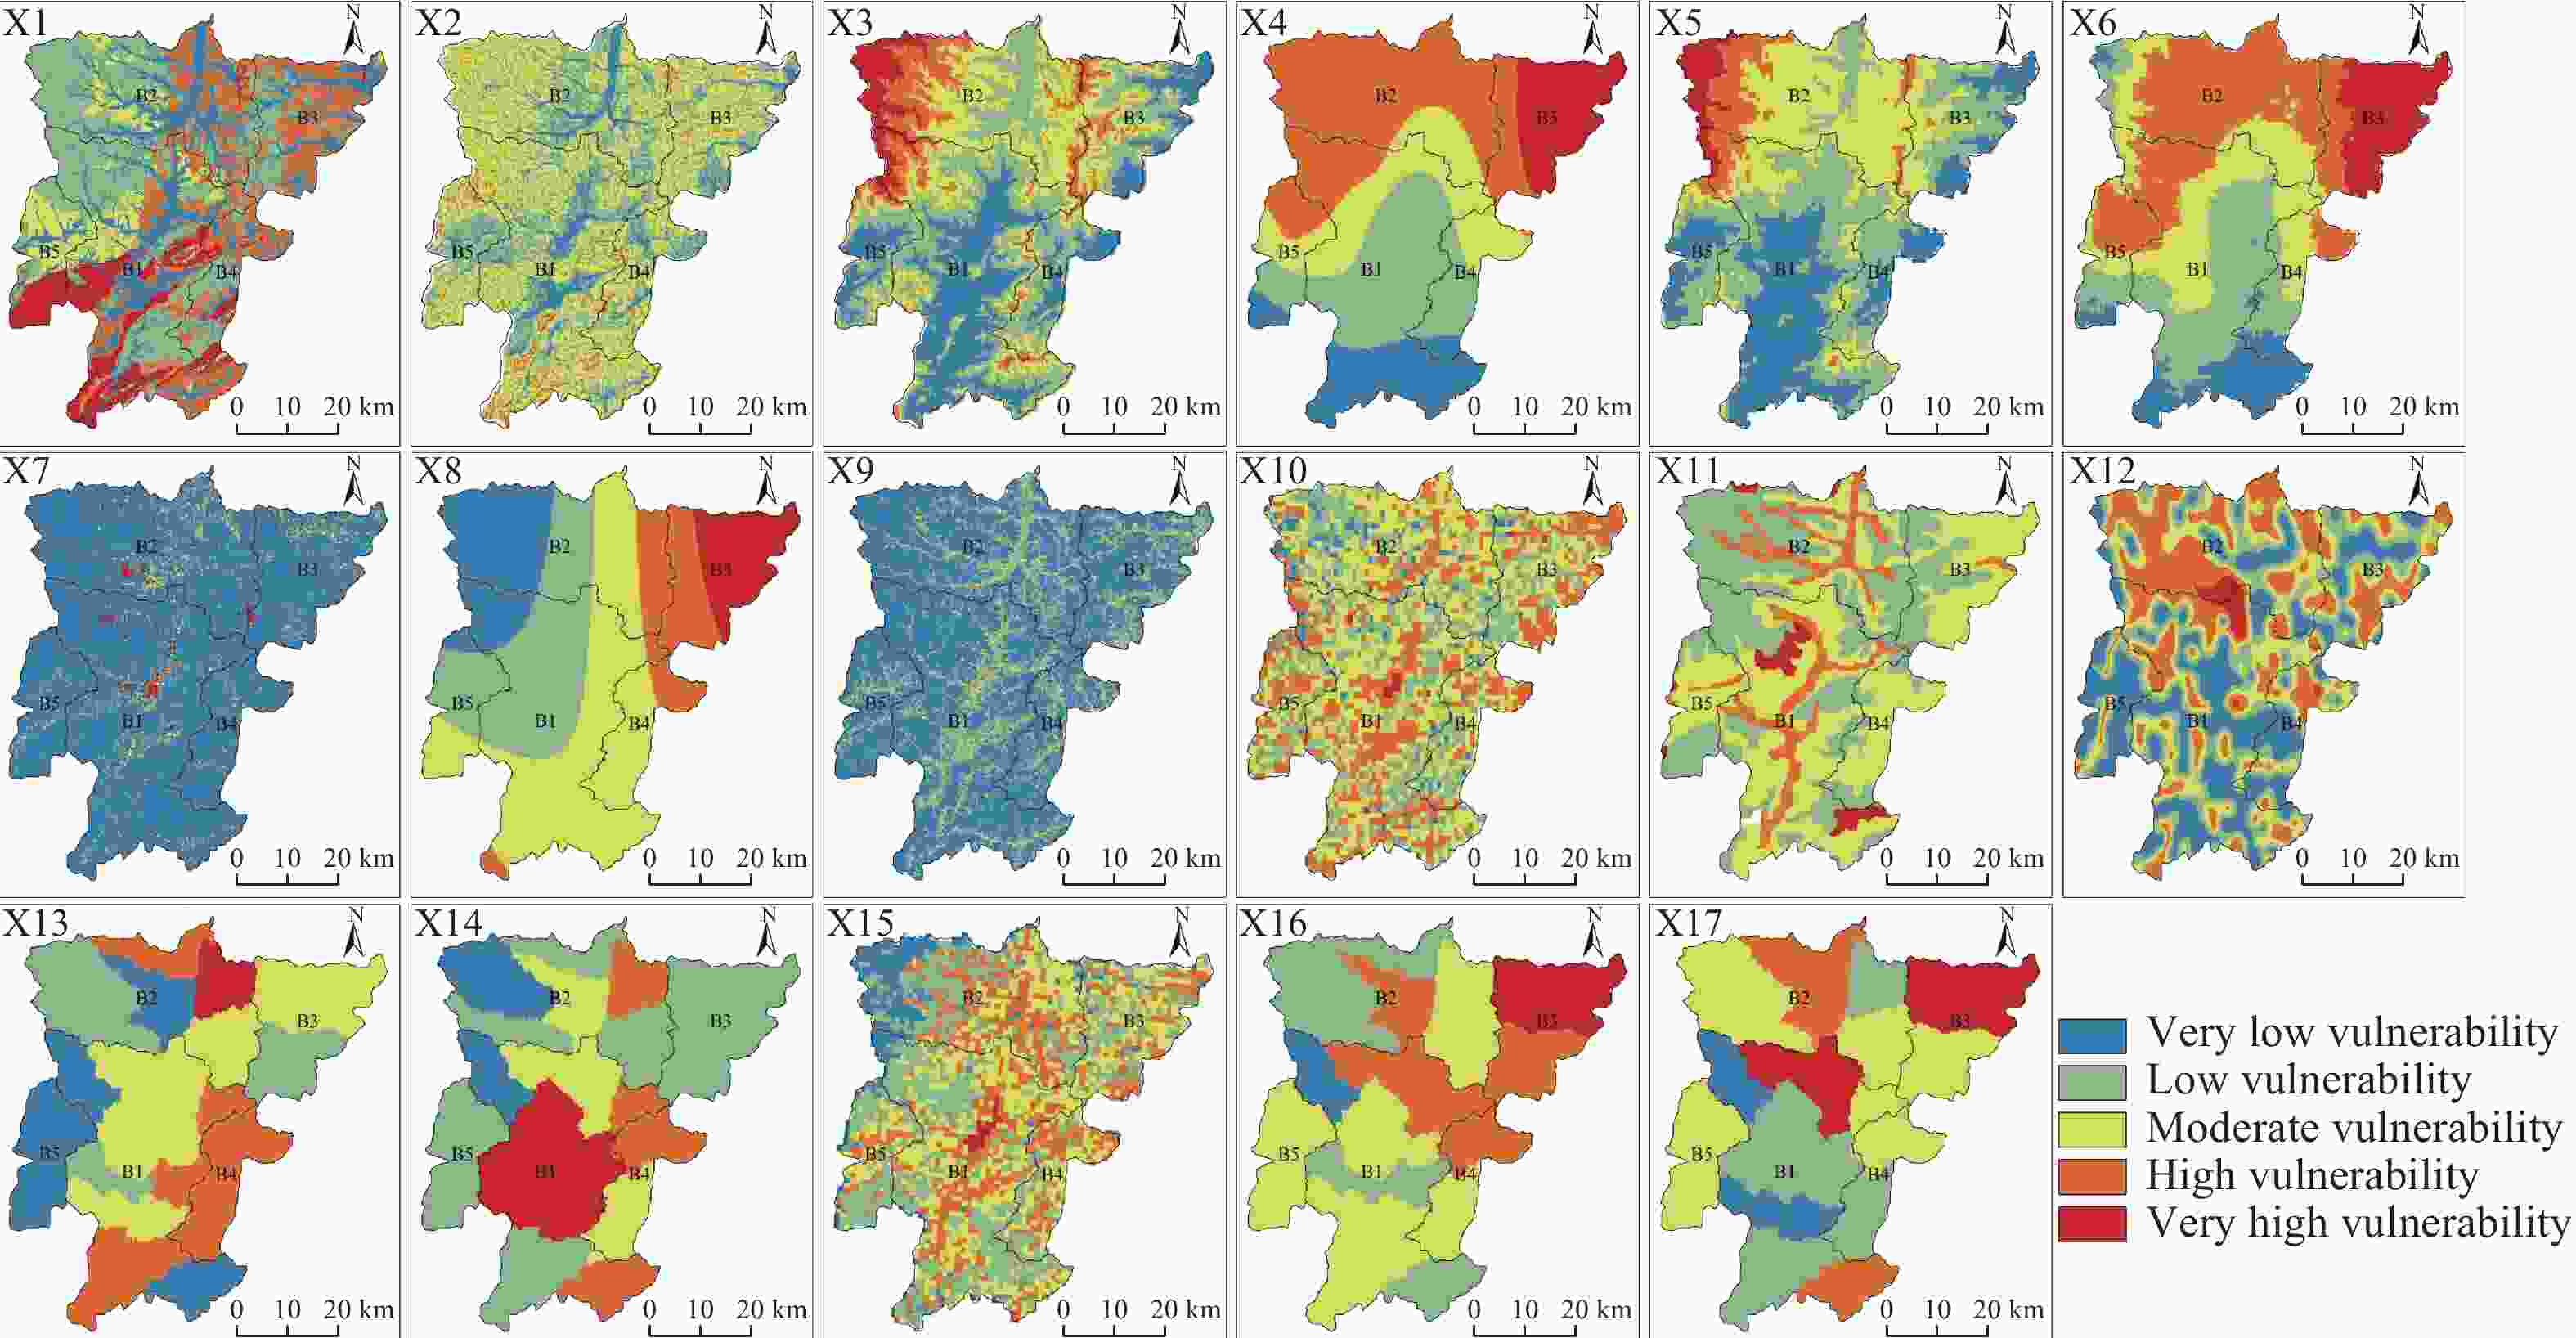
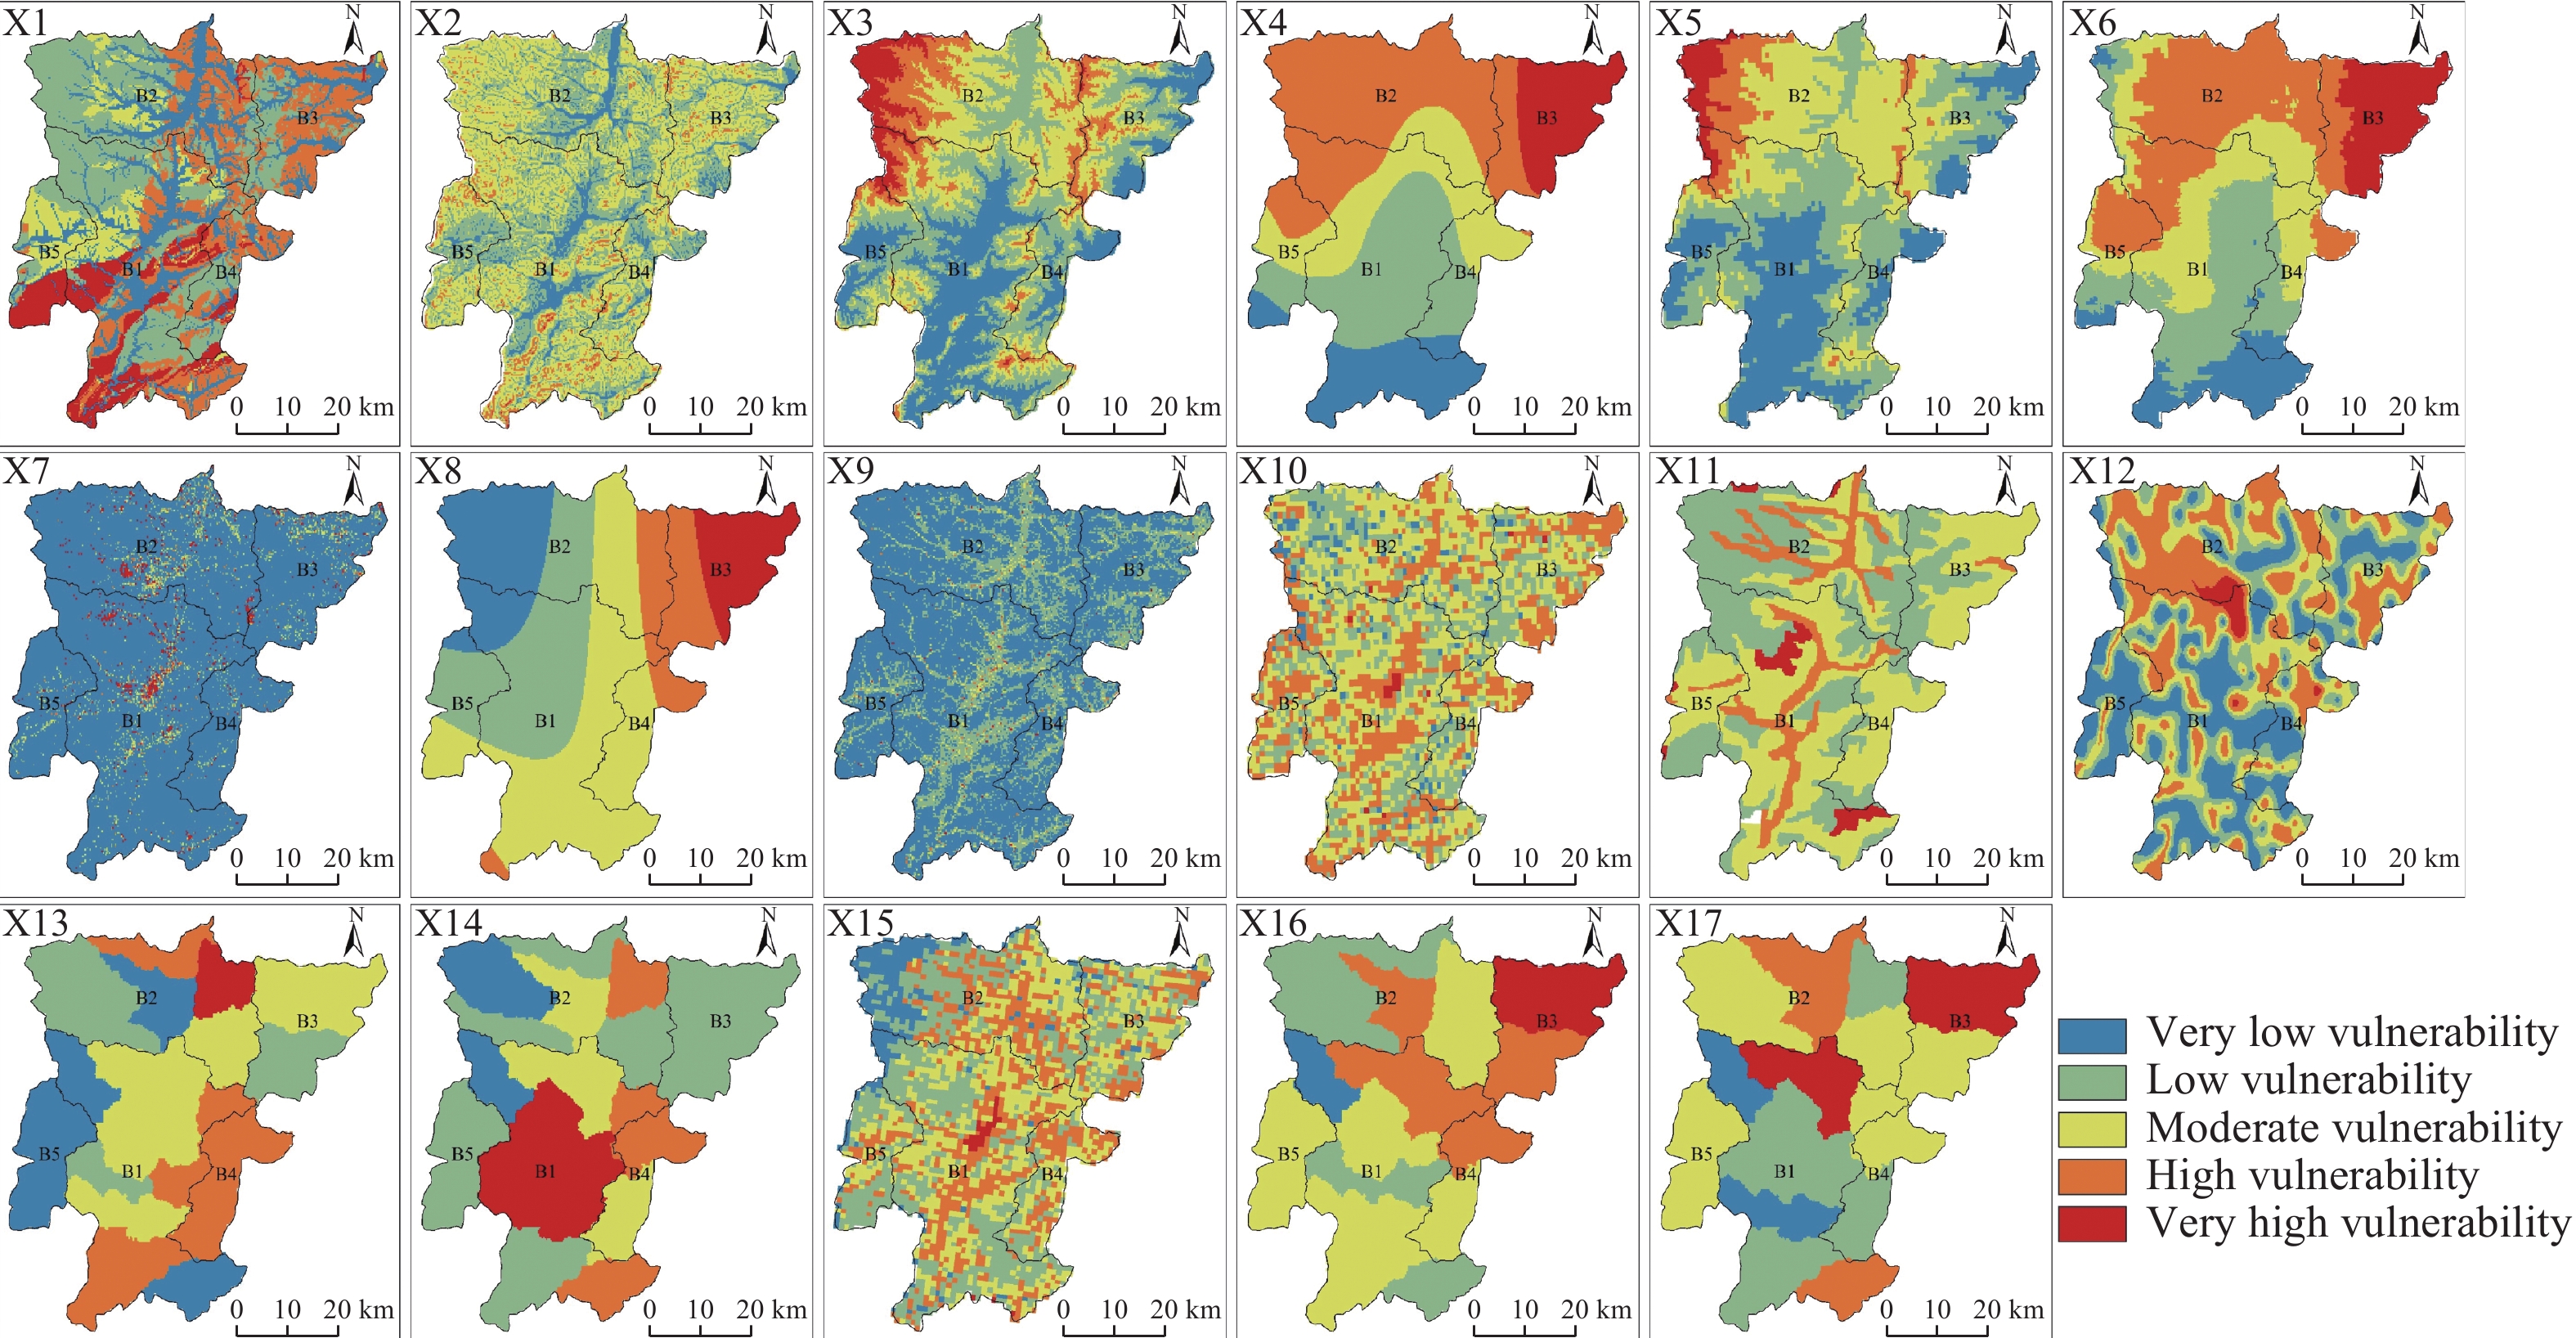
Figure 2. Single-indicator evaluation map of ecological-geological vulnerability in Pingquan City
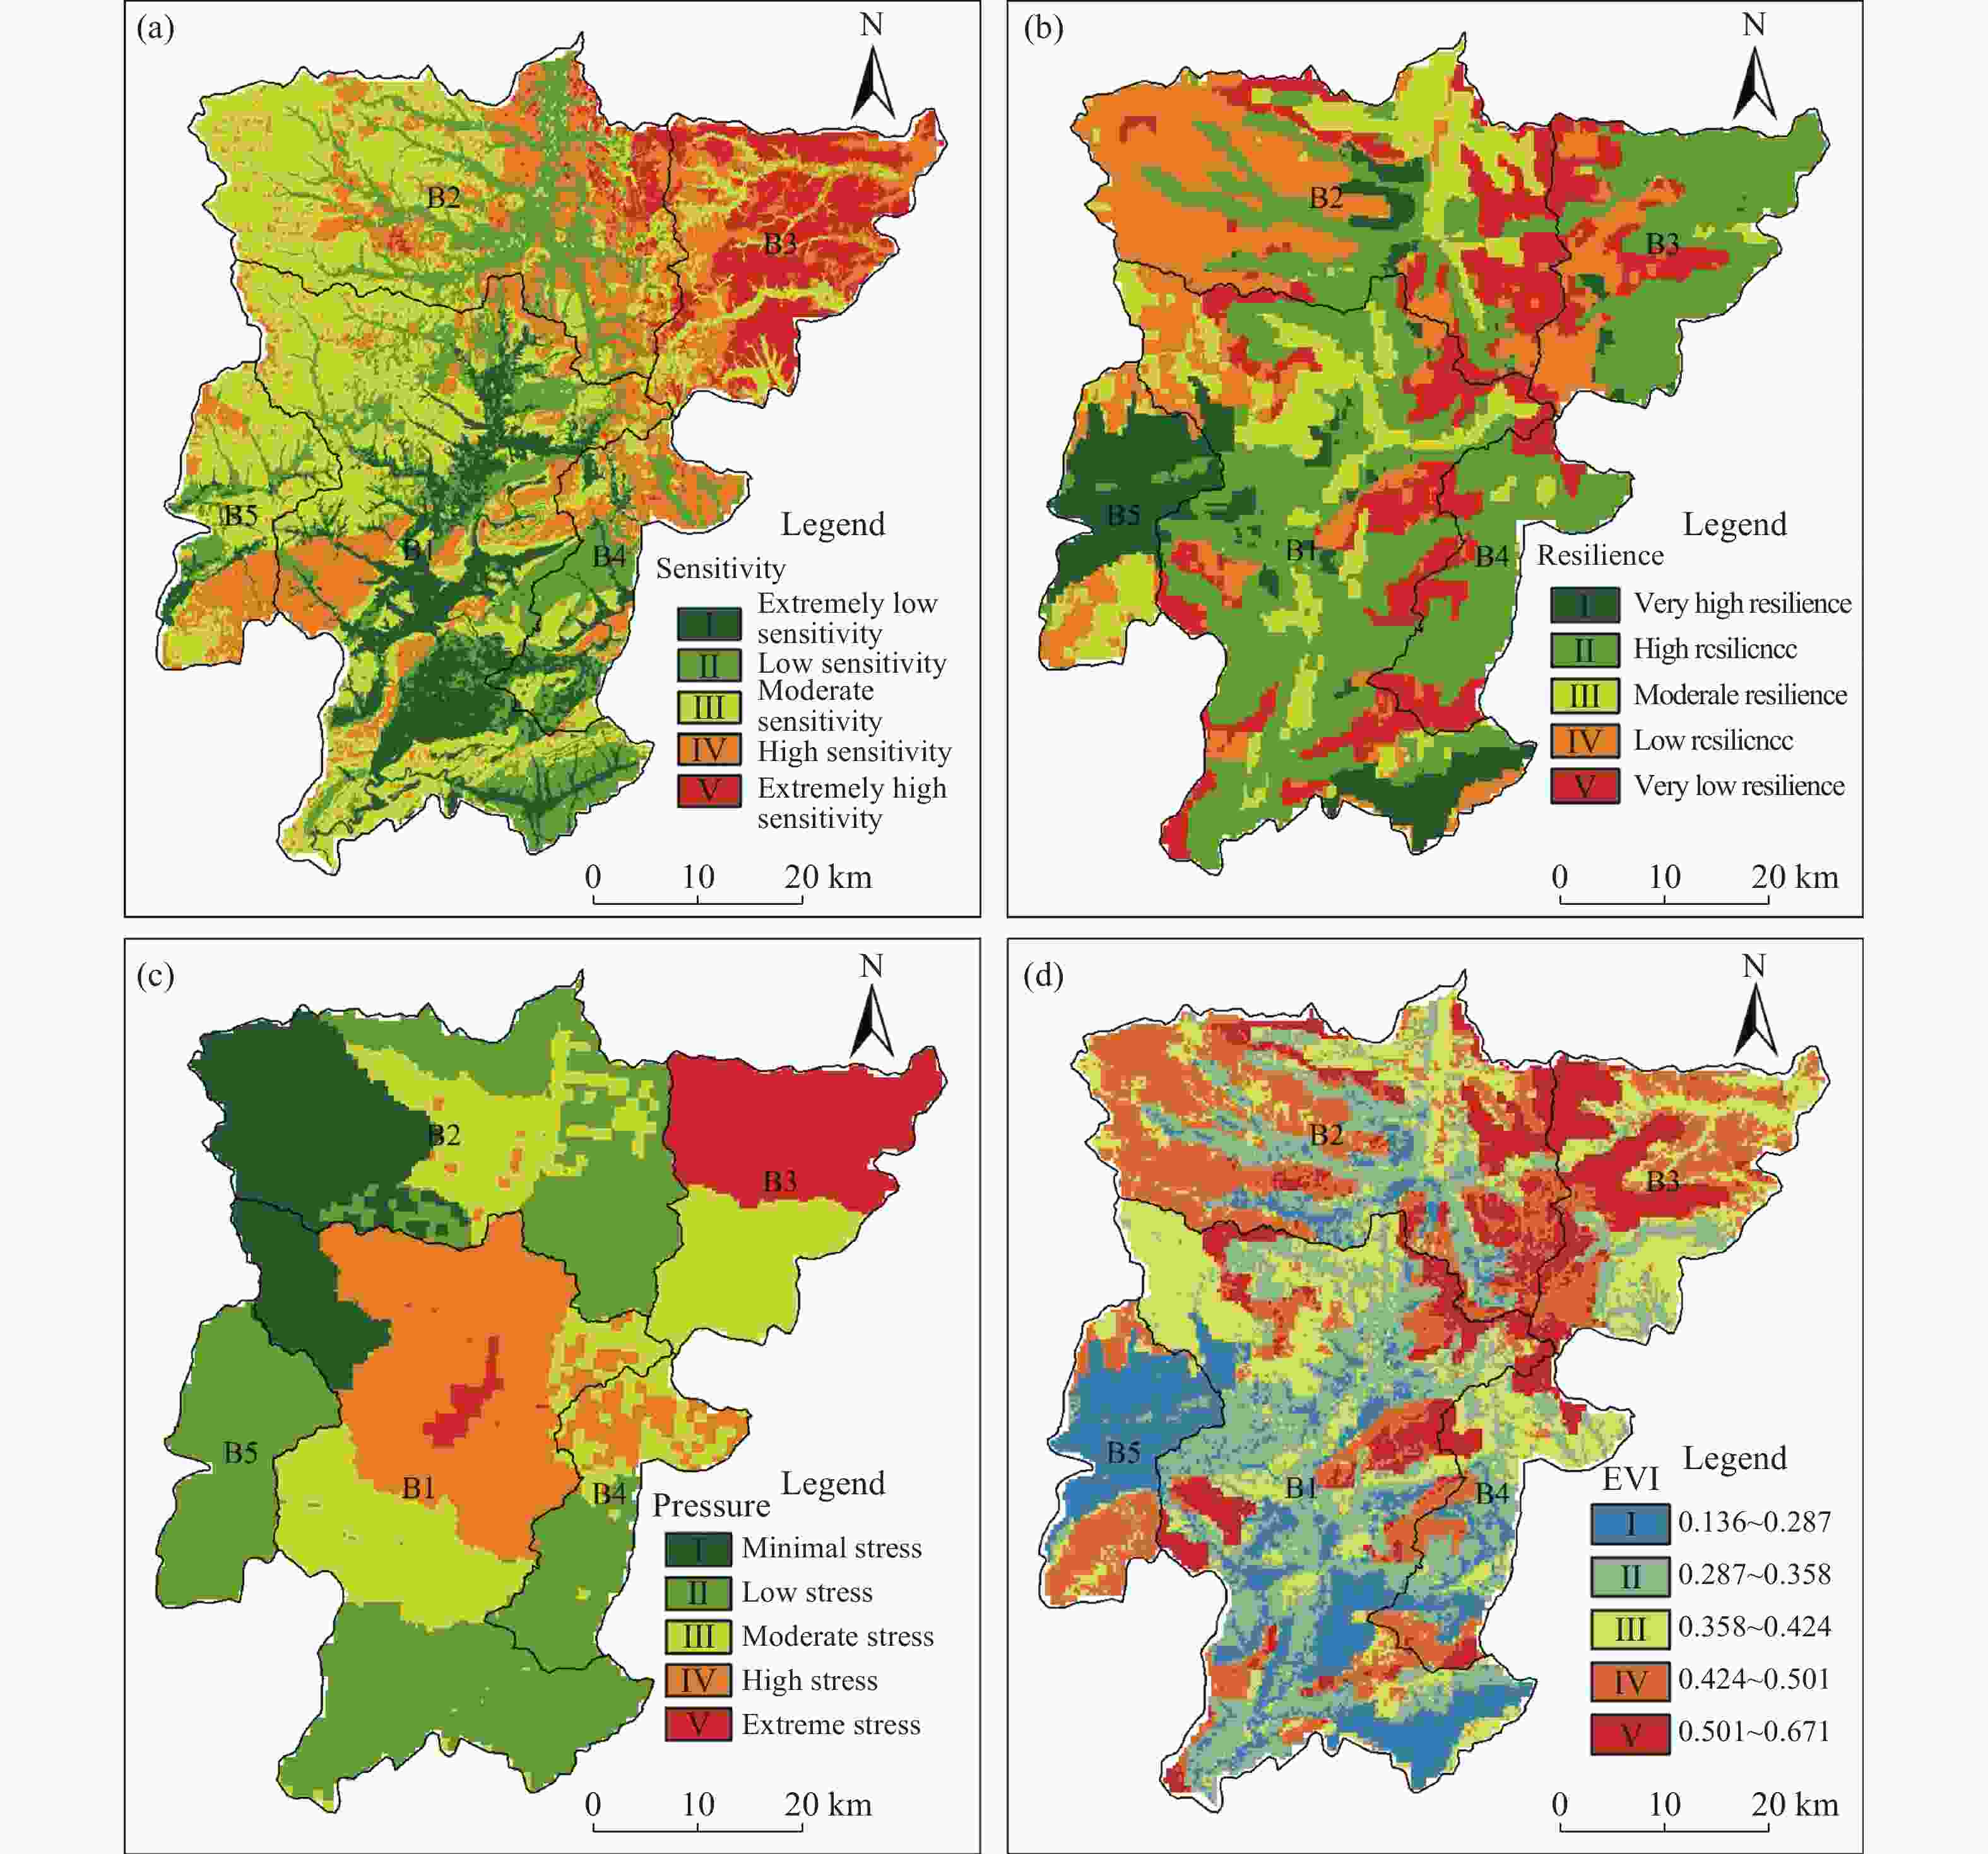
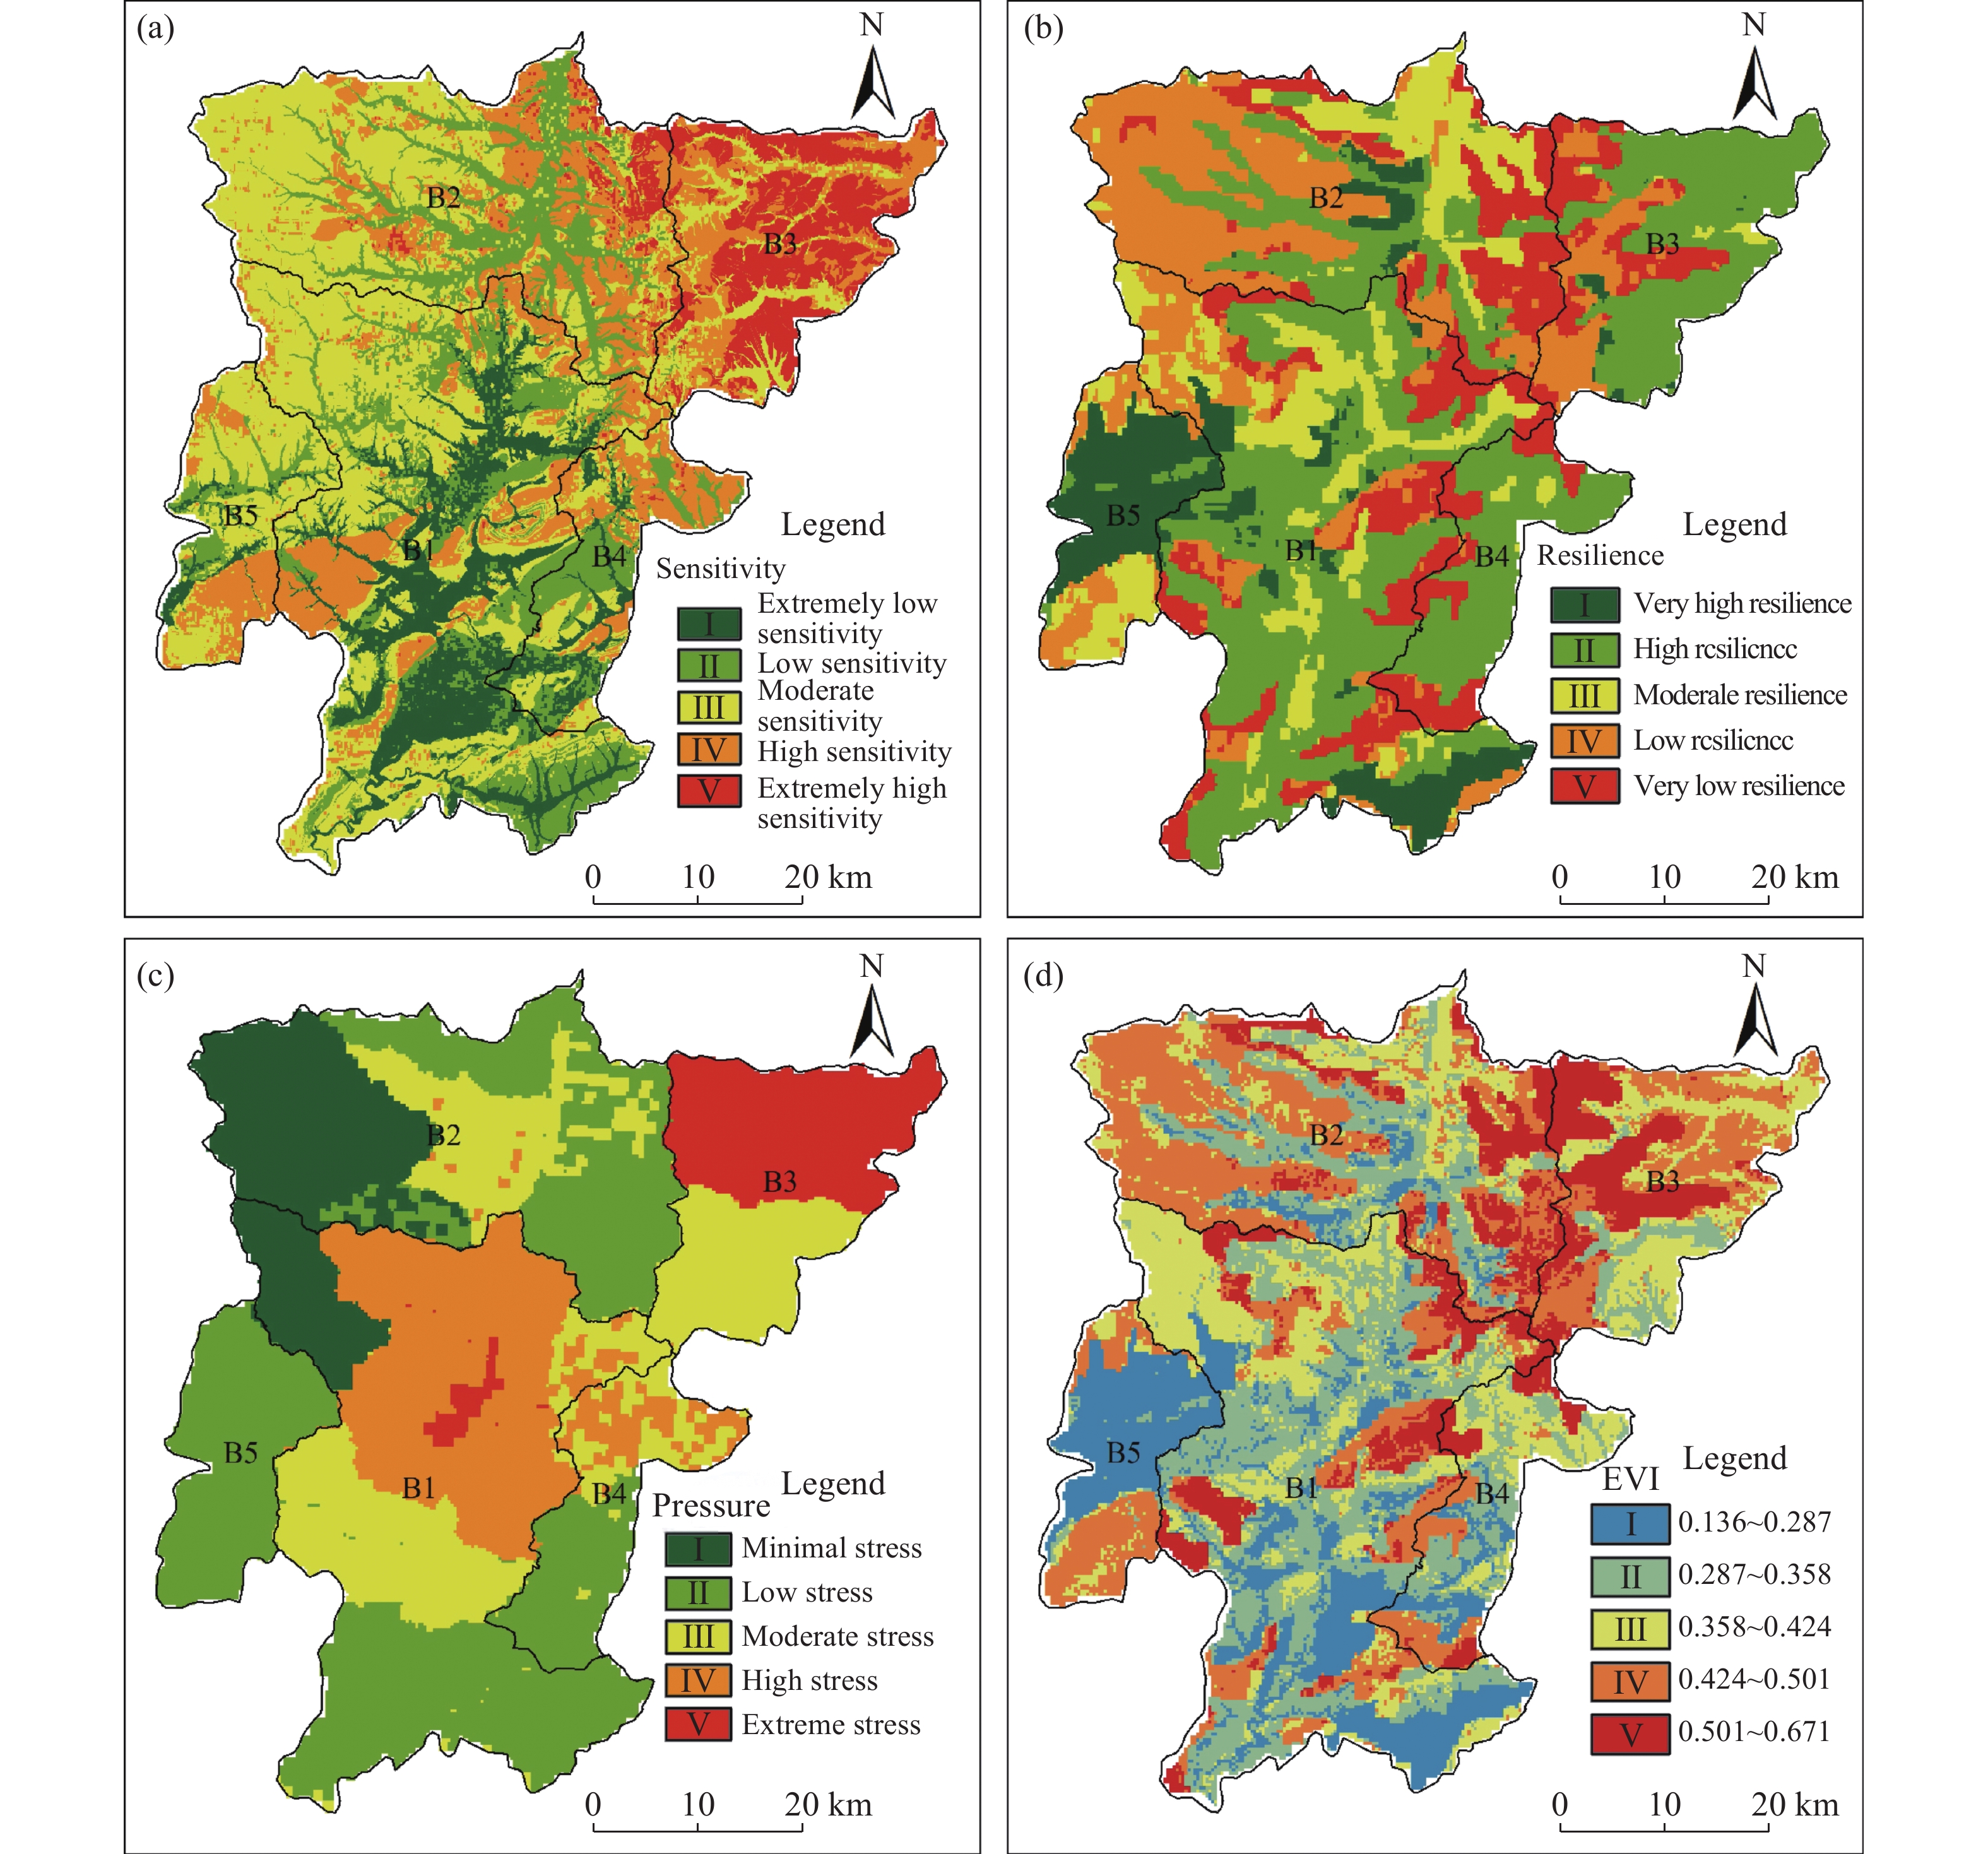
Figure 3. Ecological vulnerability assessment of Pingquan City (a: Ecological sensitivity assessment; b: Ecological resilience assessment; c: Ecological pressure assessment; d: Ecological Vulnerability Assessment)
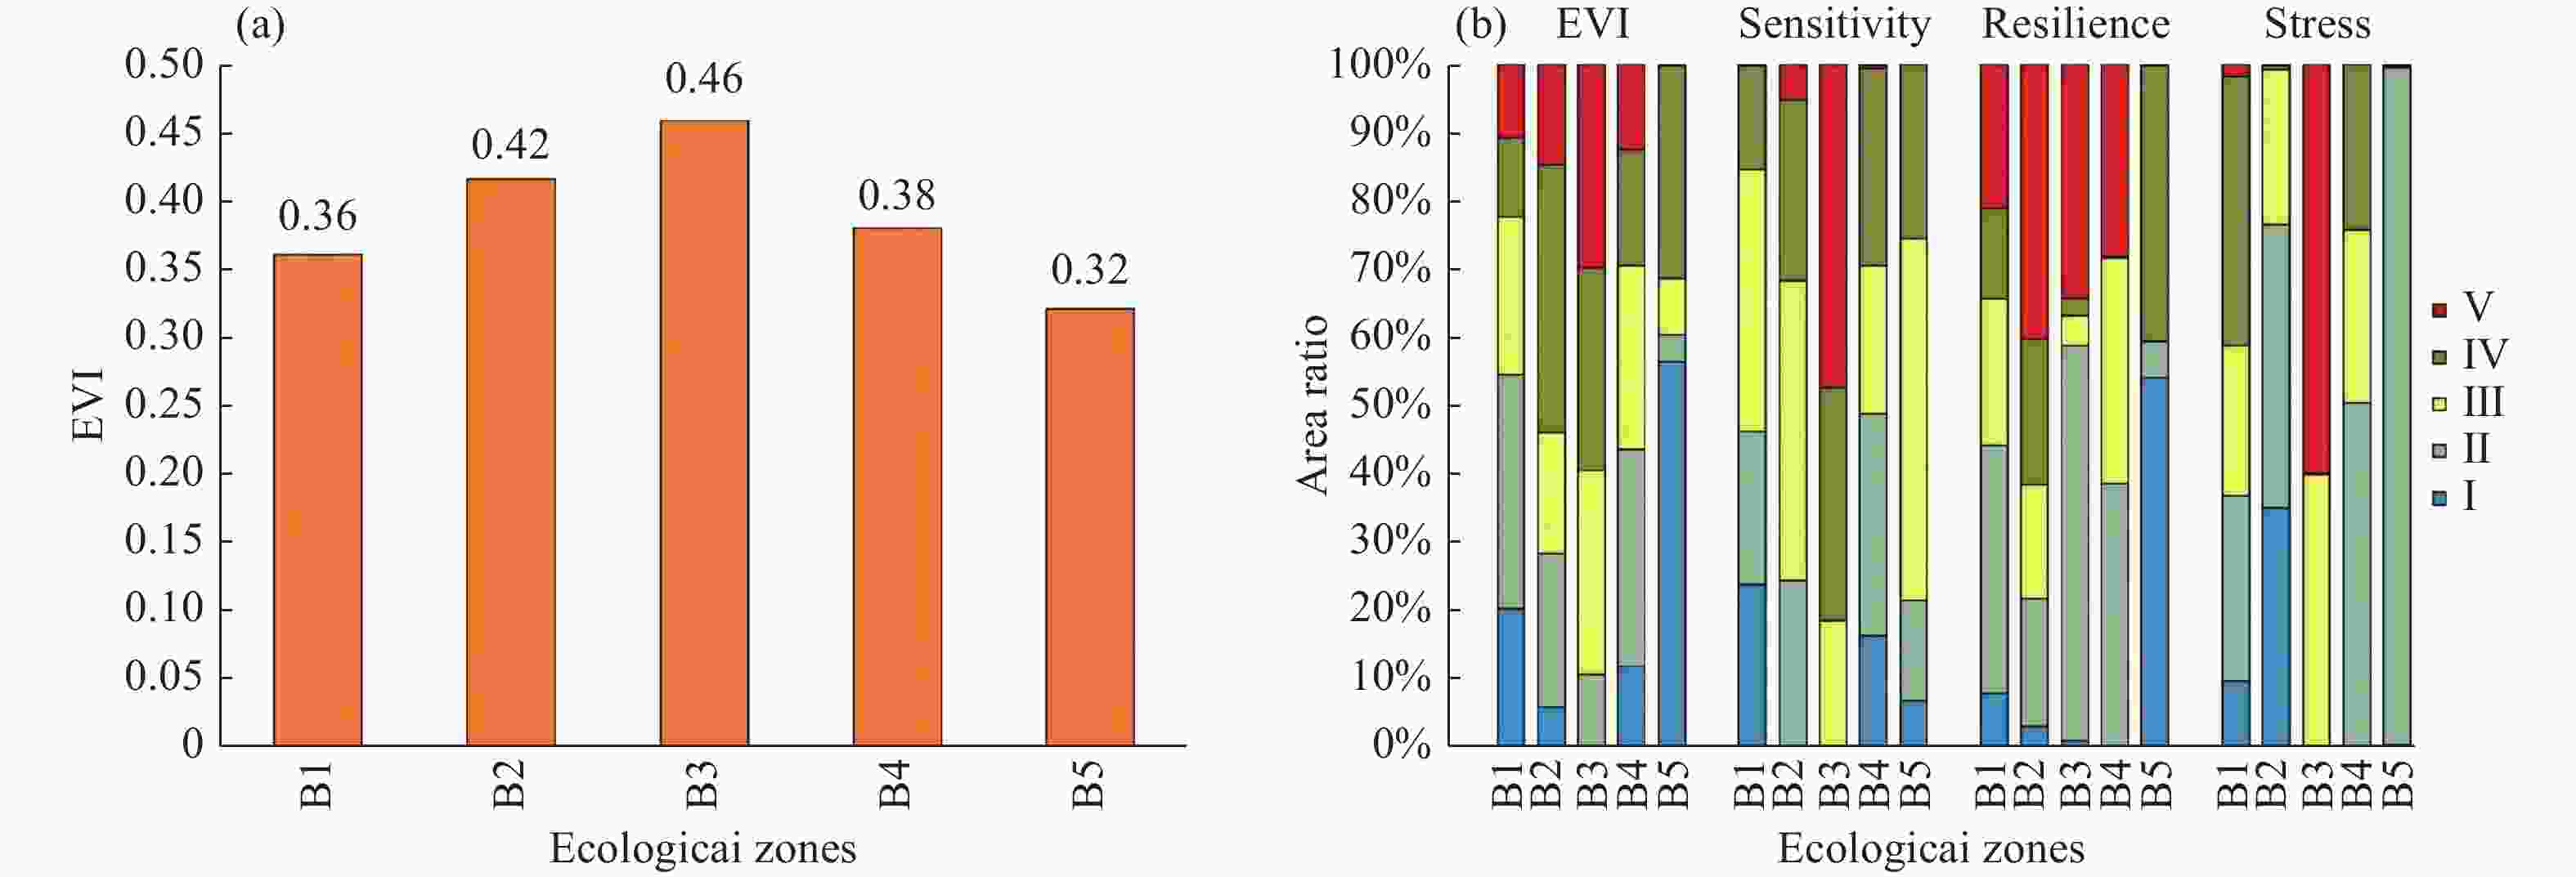
Figure 4. Mean EVI values (a) and area ratios of EVI to each element (b) for different watershed districts in the Pingquan area
Table 1. Evaluation index system of SRP model for ecological vulnerability in Pingquan area
Target level Factor layer Indicator layer Relationship type Ecological vulnerability Ecological sensitivity Geo-construction (X1) Proactively Elevation (X2) Proactively Altitude (X3) Proactively Annual rainfall (X4) Pessimistic Average annual temperature (X5) Pessimistic Dryness index (X6) Pessimistic Vegetation cover (X7) Pessimistic Soil erosion factor (X8) Proactively Landscape fragmentation (X9) Proactively Ecological resilience Vegetation NPP (X10) Pessimistic Soil type (X11) Proactively Soil nutrient synthesis (X12) Pessimistic Ecological richness (X13) Pessimistic Ecological pressure Population density (X14) Proactively GDP (X15) Proactively Food crop production (X16) Proactively Gross output value of agriculture, forestry, livestock and fisheries (X17) Proactively  下载: 导出CSV
Table 2. Soil N, P, K composite nutrient index division
Indicator Ki 100 90 70 50 30 N (g/kg) >2 >1.5–2 >1–1.5 >0.75–1 ≤0.75 P >1 >0.8–1 >0.6–0.8 >0.4–0.6 ≤0.4 K >25 >20–25 >15–20 >10–15 ≤10
下载: 导出CSV
Table 3. Grading criteria for ecological vulnerability assessment in Pingquan City
Factor Indicator Very low vulnerability Low vulnerability Moderate vulnerability High vulnerability Very high vulnerability Grading standard Ecological sensitivity X1 Quaternary terrestrial loose accumulation formation Jurassic-Cretaceous medium-acidic ejecta formation; Precambrian medium-acidic rock formation Precambrian basement rock formation; Precambrian regional metamorphic rock formation; Precambrian contact metamorphic rock formation Triassic-Cretaceous terrestrial clastic formation; Jurassic-Cretaceous volcanic clastic formation; Sinian-Permian sandy clastic formation; Sinian-Carboniferous argillaceous clastic formation Sinian-Permian marine carbonate rock formation Field survey validation X2 (°) <2 [2,6) [6,15) [15,25) ≥25 TD/T1055-2019 X3 (m) <595 [595,741) [741,909) [909,1152) ≥1152 Natural breakpoint method X4 (mm) >582 (528,582] (478,528] (432,478] ≤432 Natural breakpoint method X5 (°C) >9.2 (8.6,9.2] (7.8,8.6] (6.5,7.8] ≤6.5 Natural breakpoint method X6 >30.7 (28.2,30.7] (26.1,28.2] (23.3,26.1] ≤23.3 Natural breakpoint method X7 >0.91 (0.72,0.91] (0.49,0.72] (0.18,0.49] ≤0.18 Natural breakpoint method X8 <0.03052 [0.03052,0.03068) [0.03068,0.03085) [0.03085,0.03110) ≥0.03110 Natural breakpoint method X9 <23.28 [23.28,48.46) [48.46,82.89) [82.89,164.67) ≥164.67 Natural breakpoint method Ecological resilience X10 >557.6 (486.8,557.6] (430.4,486.8] (214.2,430.4] ≤214.2 Natural breakpoint method X11 Brown soil Cinnamon soil Damp soil Coarse aggregate soil Field survey validation X12 (96.6,100] (91.8,96.6] (87.3,91.8] [80,87.3] <80 Natural breakpoint method X13 >86.55 (76.66,86.55] (68.63,76.66] (53.13,68.63] ≤53.13 Natural breakpoint method Ecological pressure X14 (persons/km2) <83 [83,124) [124,141) [141,169) ≥169 Natural breakpoint method X15 (million/km2) <336 [336,374) [374,444) [444,727) ≥727 Natural breakpoint method X16/t <1283 [1283,8022) [8022,12963) [12963,19230) ≥19230 Natural breakpoint method X17/million <9326 [9326,19168) [19168,28566) [28566,38376) ≥38376 Natural breakpoint method
下载: 导出CSV
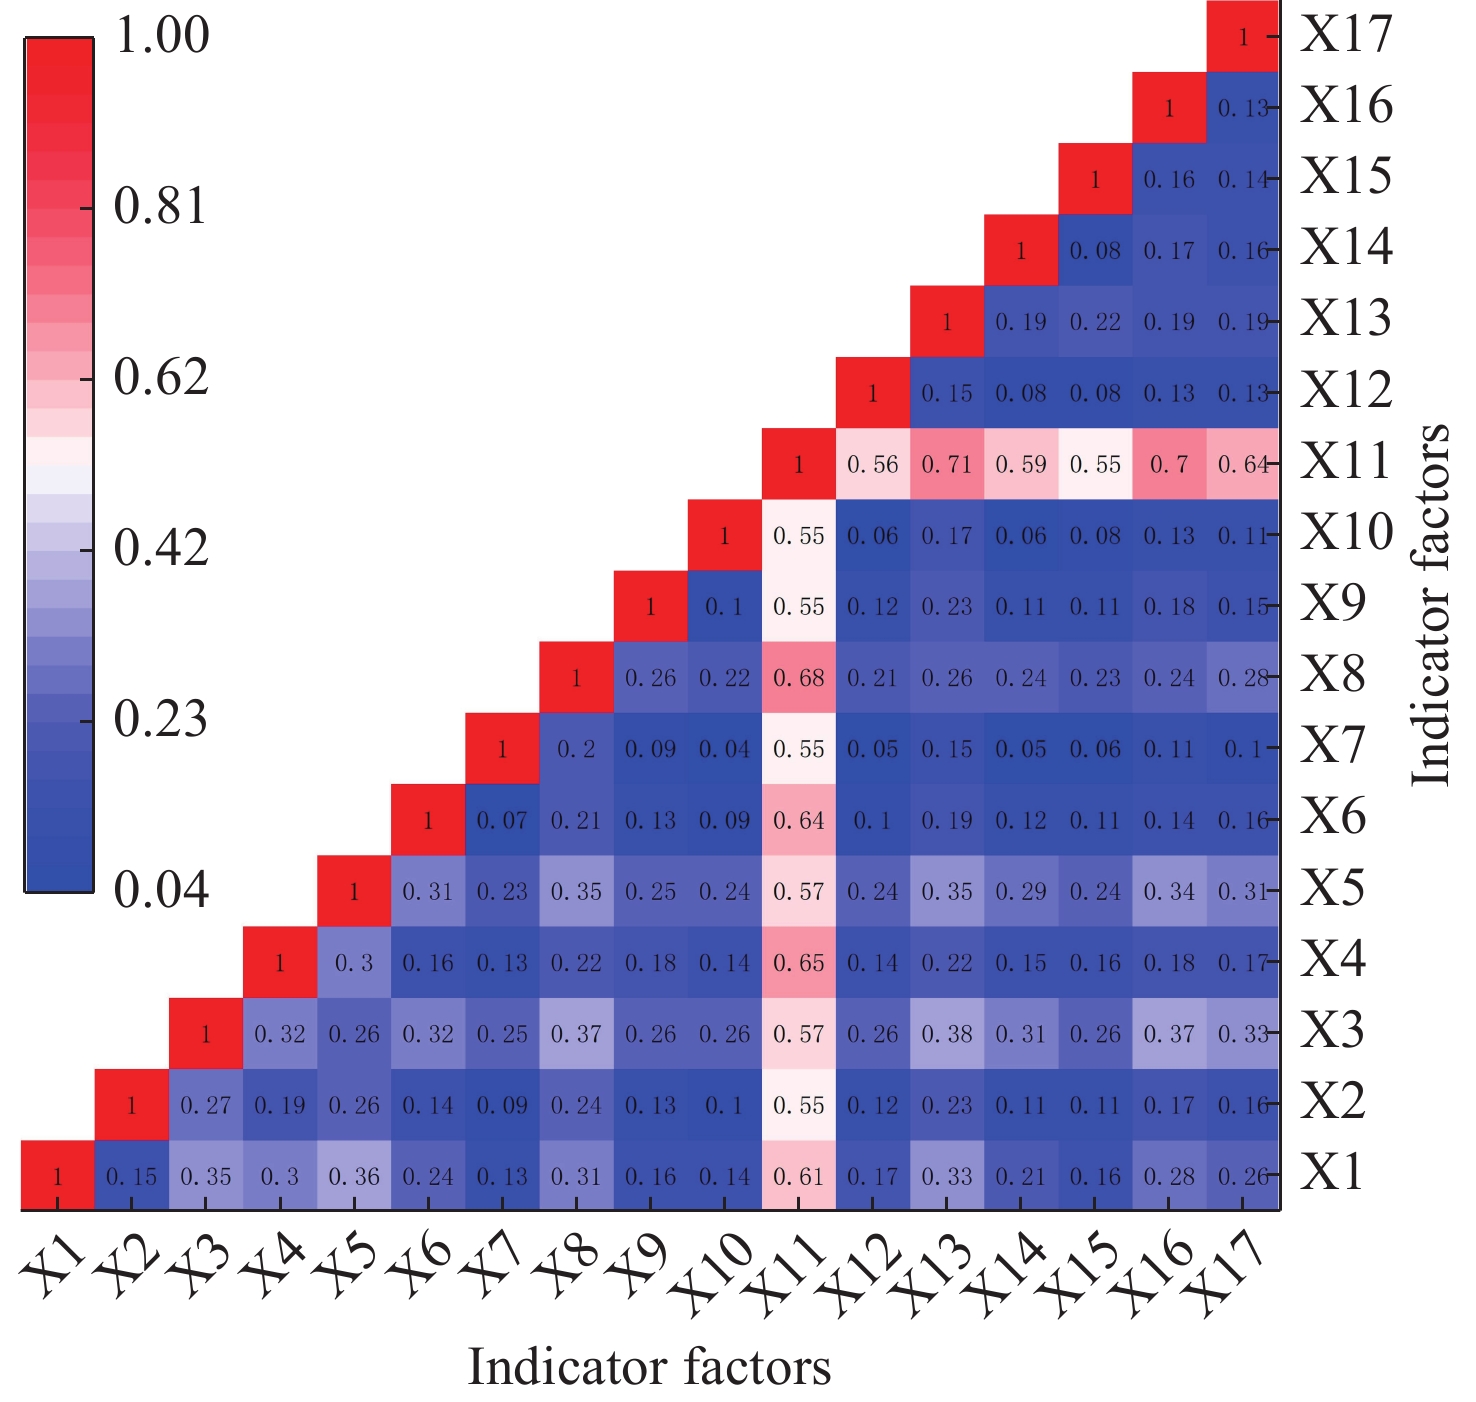
Table 4. The load of each index factor in the study area
Typology F1 F2 F3 Typology F1 F2 F3 Typology F1 F2 F3 Sensitivity −0.070 −0.027 0.997 Resilience 0.926 0.369 0.075 Pressure −0.370 0.929 −0.001 X1 0.846 −0.453 −0.014 X10 0.045 −0.011 −0.043 X14 −0.024 0.983 −0.167 X2 0.111 −0.093 −0.213 X11 0.988 −0.147 0.009 X15 0.015 0.089 0.071 X3 −0.081 −0.174 −0.459 X12 −0.007 −0.002 0.999 X16 0.653 0.136 0.741 X4 0.406 0.637 0.028 X13 0.147 0.989 0.002 X17 0.757 −0.088 −0.646 X5 0.121 0.155 0.455 X6 0.278 0.455 −0.214 X7 0.065 −0.050 −0.136 X8 0.039 −0.296 0.570 X9 0.057 −0.169 −0.383 Eigenvalue 0.073 0.046 0.035 Eigenvalue 0.118 0.036 0.012 Eigenvalue 0.064 0.031 0.006 Variance/% 36.13 22.663 17.52 Variance/% 69.45 21.169 7.027 Variance/% 61.343 30.180 5.790
下载: 导出CSV
Table 5. Judgement matrix for evaluation of ecological sensitivity indicators in Pingquan City
Typology X1 X2 X3 X4 X5 X6 X7 X8 X9 X1 1 X2 1/8 1 X3 1/8 1 1 X4 1/8 1/4 1/4 1 X5 1/8 1/2 1/2 1/2 1 X6 1/9 1/2 1/3 1 1 1 X7 1/2 1 1/2 1/2 1/4 1/3 1 X8 1 1/6 1/6 1/6 1/6 1/6 1/6 1 X9 1/2 1/2 1/6 1/8 1/8 1/6 1/4 1/8 1
下载: 导出CSV
Table 6. Judgement matrix for evaluation of ecological resilience indicators in Pingquan City
Typology X10 X11 X12 X13 X10 1 X11 1/4 1 X12 1/2 1/2 1 X13 1 1/4 1/2 1
下载: 导出CSV
Table 7. Judgement matrix for evaluation of ecological pressure indicators in Pingquan City
Typology X14 X15 X16 X17 X14 1 X15 1 1 X16 1/4 1/2 1 X17 1/4 1/2 1/6 1
下载: 导出CSV
Table 8. Weights of ecological vulnerability evaluation indicators in Pingquan City (wj is the comprehensive weight; w1j is the weight calculated by PCA; w2j is the weight obtained by AHP)
Typology W1j W2j Wj Typology W1j W2j Wj Ecological sensitivity 0.197 0.655 0.416 Ecological resilience 0.690 0.211 0.442 Geo-construction (X1) 0.1 0.349 0.216 Vegetation NPP (X10) 0.098 0.387 0.21 Elevation (X2) 0.051 0.101 0.083 Soil type (X11) 0.425 0.282 0.373 Altitude (X3) 0.001 0.125 0.013 Soil nutrient synthesis (X12) 0.15 0.175 0.174 Annual rainfall (X4) 0.215 0.086 0.157 Ecological richness (X13) 0.327 0.156 0.243 Average annual temperature (X5) 0.152 0.095 0.139 Ecological pressure 0.113 0.134 0.142 Dryness index (X6) 0.157 0.085 0.134 Population density (X14) 0.252 0.4 0.335 Vegetation cover (X7) 0.08 0.07 0.087 GDP (X15) 0.13 0.291 0.205 Soil erosion factor (X8) 0.163 0.061 0.115 Food crop production (X16) 0.405 0.217 0.313 Landscape fragmentation (X9) 0.081 0.028 0.055 Gross output value of agriculture, forestry, livestock and fisheries (X17) 0.213 0.092 0.148
下载: 导出CSV
Table 9. Area ratio of different vulnerability classes of EVI in Pingquan City
Typology Ⅰ Ⅱ Ⅲ Ⅳ Ⅴ Area (km2) 500.91 783.60 680.92 755.50 433.36 Area ratio (%) 16 25 21 24 14
下载: 导出CSV
Table 10. Ratio of EVI to area of each element in different watersheds in Pingquan region
Basin Ecological Vulnerability (%) Ecological sensitivity (%) Ⅰ Ⅱ Ⅲ Ⅳ Ⅴ Ⅰ Ⅱ Ⅲ Ⅳ Ⅴ B1 20.29 34.34 23.10 11.55 10.72 23.80 22.42 38.41 15.26 0.11 B2 5.80 22.60 17.68 39.38 14.53 0.01 24.40 43.94 26.58 5.08 B3 0.00 10.71 29.81 29.85 29.63 0.00 0.21 18.34 34.16 47.29 B4 11.80 31.85 26.96 17.04 12.36 16.41 32.46 21.68 28.93 0.53 B5 56.60 3.87 8.21 31.27 0.06 6.80 14.71 53.01 25.49 0.00 Basin Ecological resilience (%) Ecological pressure (%) Ⅰ Ⅱ Ⅲ Ⅳ Ⅴ Ⅰ Ⅱ Ⅲ Ⅳ Ⅴ B1 7.88 36.41 21.43 13.16 21.12 9.64 27.30 21.91 39.40 1.75 B2 3.05 18.79 16.65 21.26 40.26 35.18 41.42 22.70 0.62 0.09 B3 0.97 57.91 4.43 2.46 34.22 0.00 0.18 39.82 0.08 59.92 B4 0.00 38.62 33.13 0.22 28.03 0.00 50.50 25.40 24.10 0.00 B5 54.15 5.29 0.06 40.43 0.07 0.45 99.10 0.19 0.26 0.00
下载: 导出CSV
Table 11. Detection results of factors in Pingquan area
Indicator q value Indicator q Value Indicator q Value Geo-construction (X1) 0.123 Vegetation cover (X7) 0.014 Ecological richness (X13) 0.120 Elevation (X2) 0.083 Soil erosion factor (X8) 0.188 Population density (X14) 0.027 Altitude (X3) 0.248 Landscape fragmentation (X9) 0.084 GDP (X15) 0.051 Annual rainfall (X4) 0.105 Vegetation NPP (X10) 0.025 Food crop production (X16) 0.084 Average annual temperature (X5) 0.220 Soil type (X11) 0.543 Gross output value of agriculture, forestry, livestock and fisheries (X17) 0.070 Dryness index (X6) 0.040 Soil nutrient synthesis (X12) 0.035
下载: 导出CSV
-
Cui C. 2012. The study of ecological environment evolution and countermeasures in source area of the Three Rivers. In Proceedings of the 5th International Yellow River Forum on Ensuring Water Right of the River's Demand and Healthy River Basin maintenance, Minist Water Resources, Yellow River Conservancy Commiss, Zhengzhou, China, 24–28 September. De Lange HJ, Sala S, Vighi M, et al. 2010. Ecological vulnerability in risk assessment—A review and perspectives. Science of the Total Environment, 408(18): 3871−3879. DOI: 10.1016/j.scitotenv.2009.11.009. Fan ZW, Liu MS, Shen WQ, et al. 2009. GIS-based assessment on eco-vulnerability of Jiangxi Province. In 2009 International Conference on Environmental Science and Information Application Technology (Vol. 3, pp. 426–431). IEEE. DOI: 10.1109/ESIAT.2009.321. Gao Y, Zhang H. 2018. The study of ecological environment fragility based on remote sensing and GIS. Journal of the Indian Society of Remote Sensing, 46, 793–799. DOI: 10.1007/s12524-018-0759-1. Hou K, Li X, Wang J, et al. 2016. Evaluating ecological vulnerability using the GIS and Analytic Hierarchy Process (AHP) Method in Yan'an, China. Polish Journal of Environmental Studies, 25(2). DOI: 10.15244/pjoes/61312. Hou K, Li X, Zhang J. 2015. GIS analysis of changes in ecological vulnerability using a SPCA model in the Loess plateau of Northern Shaanxi, China. International Journal of Environmental Research and Public Health, 12(4): 4292−4305. DOI: 10.3390/ijerph120404292. Hu X, Ma C, Huang P, et al. 2021. Ecological vulnerability assessment based on AHP-PSR method and analysis of its single parameter sensitivity and spatial autocorrelation for ecological protection–A case of Weifang City, China. Ecological Indicators, 125: 107464. DOI: 10.1016/j.ecolind.2021.107464. Ippolito A, Sala S, Faber JH, et al. 2010. Ecological vulnerability analysis: A river basin case study. The Science of the Total Environment 408 (18): 3880–3890. DOI: 10.1016/j.scitotenv.2009.10.002. Jiang W, Deng L, Chen L, et al. 2009. Risk assessment and validation of flood disaster based on fuzzy mathematics. Progress in Natural Science, 19(10): 1419−1425. DOI: 10.1016/j.pnsc.2008.12.010. Lan G, Jiang X, Xu D, et al. 2023. Ecological vulnerability assessment based on remote sensing ecological index (RSEI): A case of Zhongxian County, Chongqing. Frontiers in Environmental Science, 10: 1074376. DOI: 10.3389/fenvs.2022.1074376. Leitao AB, Ahern J, 2002. Applying landscape ecological concepts and metrics in sustainable landscape planning. Landscape and Urban Planning, 59(2): 65–93. DOI: 10.1016/S0169-2046(02)00005-1. Li A, Wang A, Liang S, et al. 2006. Eco-environmental vulnerability evaluation in mountainous region using remote sensing and GIS—A case study in the upper reaches of Minjiang River, China. Ecological Modelling, 192(1-2): 175−187. DOI: 10.1016/j.ecolmodel.2005.07.005. Li AN, Wang AS, He XR, et al. 2006. Integrated evaluation model for eco-environmental quality in mountainous region Based on Remote Sensing and GIS. Wuhan University Journal of Natural Sciences, 11(4): 969−976. DOI: 10.1007/BF02830196. Li L, Shi ZH, Yin W, et al. 2009. A fuzzy analytic hierarchy process (FAHP) approach to eco-environmental vulnerability assessment for the danjiangkou reservoir area, China. Ecological Modelling, 220(23): 3439−3447. DOI: 10.1016/j.ecolmodel.2009.09.005. Li Y, Huang S, 2015. Landscape ecological risk responses to land use change in the Luanhe River Basin, China. Sustainability, 7(12): 16631–16652. DOI: 10.3390/su71215835. Liu JY, Nie HF, Xu L, et al. 2025. Assessment of ecological geological vulnerability in Mu Us Sandy Land based on GIS and suggestions of ecological protection and restoration. China Geology, 8(1): 117−140. DOI:10.31035/ cg20230027. Luo M, Jia X, Zhao Y, et al. 2024. Ecological vulnerability assessment and its driving force based on ecological zoning in the Loess Plateau, China. Ecological Indicators, 159: 111658. DOI: 10.1016/j.ecolind.2024.111658. Qiu PH, Xu XJ, Xie GZ, et al. 2007. Analysis of the ecological vulnerability of the western Hainan Island based on its landscape pattern and ecosystem sensitivity. Acta Ecologica Sinica, 27(4): 1257−1264. DOI: 10.1016/S1872-2032(07)60026-2. Sahoo S, Dhar A, Kar A. 2016. Environmental vulnerability assessment using Grey Analytic Hierarchy Process based model. Environmental Impact Assessment Review, 56: 145−154. DOI: 10.1016/j.eiar.2015.10.002. Shan C, Dong Z, Lu D, et al. 2021. Study on river health assessment based on a fuzzy matter-element extension model. Ecological Indicators, 127: 107742. DOI: 10.1016/j.ecolind.2021.107742. Shi JT, Liu JJ, Zhang JC, et al. 2024. Analysis of soil heavy metal influencing factors and sources in typical small watersheds in shallow mountainous area. Geophysical and Geochemical Exploration, 48(3): 834−846. (in Chinese) DOI: 10.11720/wtyht.2024.1270. Wang XD, Zhang XH, Gao P. 2010. A GIS-based decision support system for regional eco-security assessment and its application on the Tibetan Plateau. Journal of Environmental Management, 91(10): 1981−1990. DOI: 10.1016/j.jenvman.2010.05.006. Wang Z, Su Y. 2002. Analysis of Eco-environment vulnerability characteristics of Hanzhong City, near the water source midway along the route of the south-to-north water transfer project, China. Acta Ecologica Sinica, 38(02): 432–442. DOI: 10.5846/stxb201609261944. Wu C, Liu G, Huang C, et al. 2018. Ecological vulnerability assessment based on fuzzy analytical method and analytic hierarchy process in Yellow River Delta. International Journal of Environmental Research and Public Health, 15(5): 855. DOI: 10.3390/ijerph15050855. Xu W, Dong Z, Li D, et al. 2017. River health evaluation based on the Fuzzy matter-element extension assessment model. Polish Journal of Environmental Studies, 26(3). DOI: 10.15244/pjoes/67369. Xu X, Yang H, Yang D, et al. 2013. Assessing the impacts of climate variability and human activities on annual runoff in the Luan River basin, China. Hydrology Research, 44(5): 940−952. DOI: 10.2166/nh.2013.144. Xue LQ, Wang J, Zhang L, et al. 2019. Spatiotemporal analysis of ecological vulnerability and management in the Tarim River Basin, China. Science of the Total Environment, 649: 876−888. DOI: 10.1016/j.scitotenv.2018.08.321. Yang L, Cheng YP, Wen XR, et al. 2024. Development, hotspots and trend directions of groundwater numerical simulation: A bibliometric and visualization analysis. Journal of Groundwater Science and Engineering, 12(4): 411−427. DOI: 10.26599/JGSE.2024.9280031. Zhang F, Liu X, Zhang J, et al. 2017. Ecological vulnerability assessment based on multi-sources data and SD model in Yinma River Basin, China. Ecological Modelling, 349: 41−50. DOI: 10.1016/j.ecolmodel.2017.01.016. Zhang H, Lin X, Yu G, et al. 2009. Ecological vulnerability assessment in the middle and lower reaches of the Hanjiang river basin. In 2009 3rd International Conference on Bioinformatics and Biomedical Engineering: 1-4. DOI: 10.1109/ICBBE.2009.5162677. Zhang XL, Yu WB, Cai HS, et al. 2018. Review of the evaluation methods of regional eco-environmental vulnerability. Acta Ecologica Sinica, 38: 5970−5981. DOI: 10.5846/stxb201708211502. Zhang XQ, Wang LK, Fu XS, et al. 2017. Ecological vulnerability assessment based on PSSR in Yellow River Delta. Journal of Cleaner Production, 167: 1106−1111. DOI: 10.1016/j.jclepro.2017.04.106. Zhang XY, Liu K, Wang S, et al. 2022. Spatiotemporal evolution of ecological vulnerability in the Yellow River Basin under ecological restoration initiatives. Ecological Indicators, 135: 108586. DOI: 10.1016/j.ecolind.2022.108586. Zhao Y, Liu L, Kang S, et al. 2021. Quantitative analysis of factors influencing spatial distribution of soil erosion based on geo-detector model under diverse geomorphological types. Land, 10(6): 604. DOI: 10.3390/land10060604. Zou T, Yoshino K, 2017. Environmental vulnerability evaluation using a spatial principal components approach in the Daxing'anling region, China. Ecological Indicators, 78, 405–415. DOI: 10.1016/j.ecolind.2017.03.039. Zou T, Chang Y, Chen P, et al. 2021. Spatial-temporal variations of ecological vulnerability in Jilin Province (China), 2000 to 2018. Ecological Indicators, 133: 108429. DOI: 10.1016/j.ecolind.2021.108429. -

 点击查看大图
计量
- 文章访问数: 459
- HTML全文浏览量: 179
- PDF下载量: 308
- 被引次数: 0


