 E-mail alert
 Rss
Rss

-
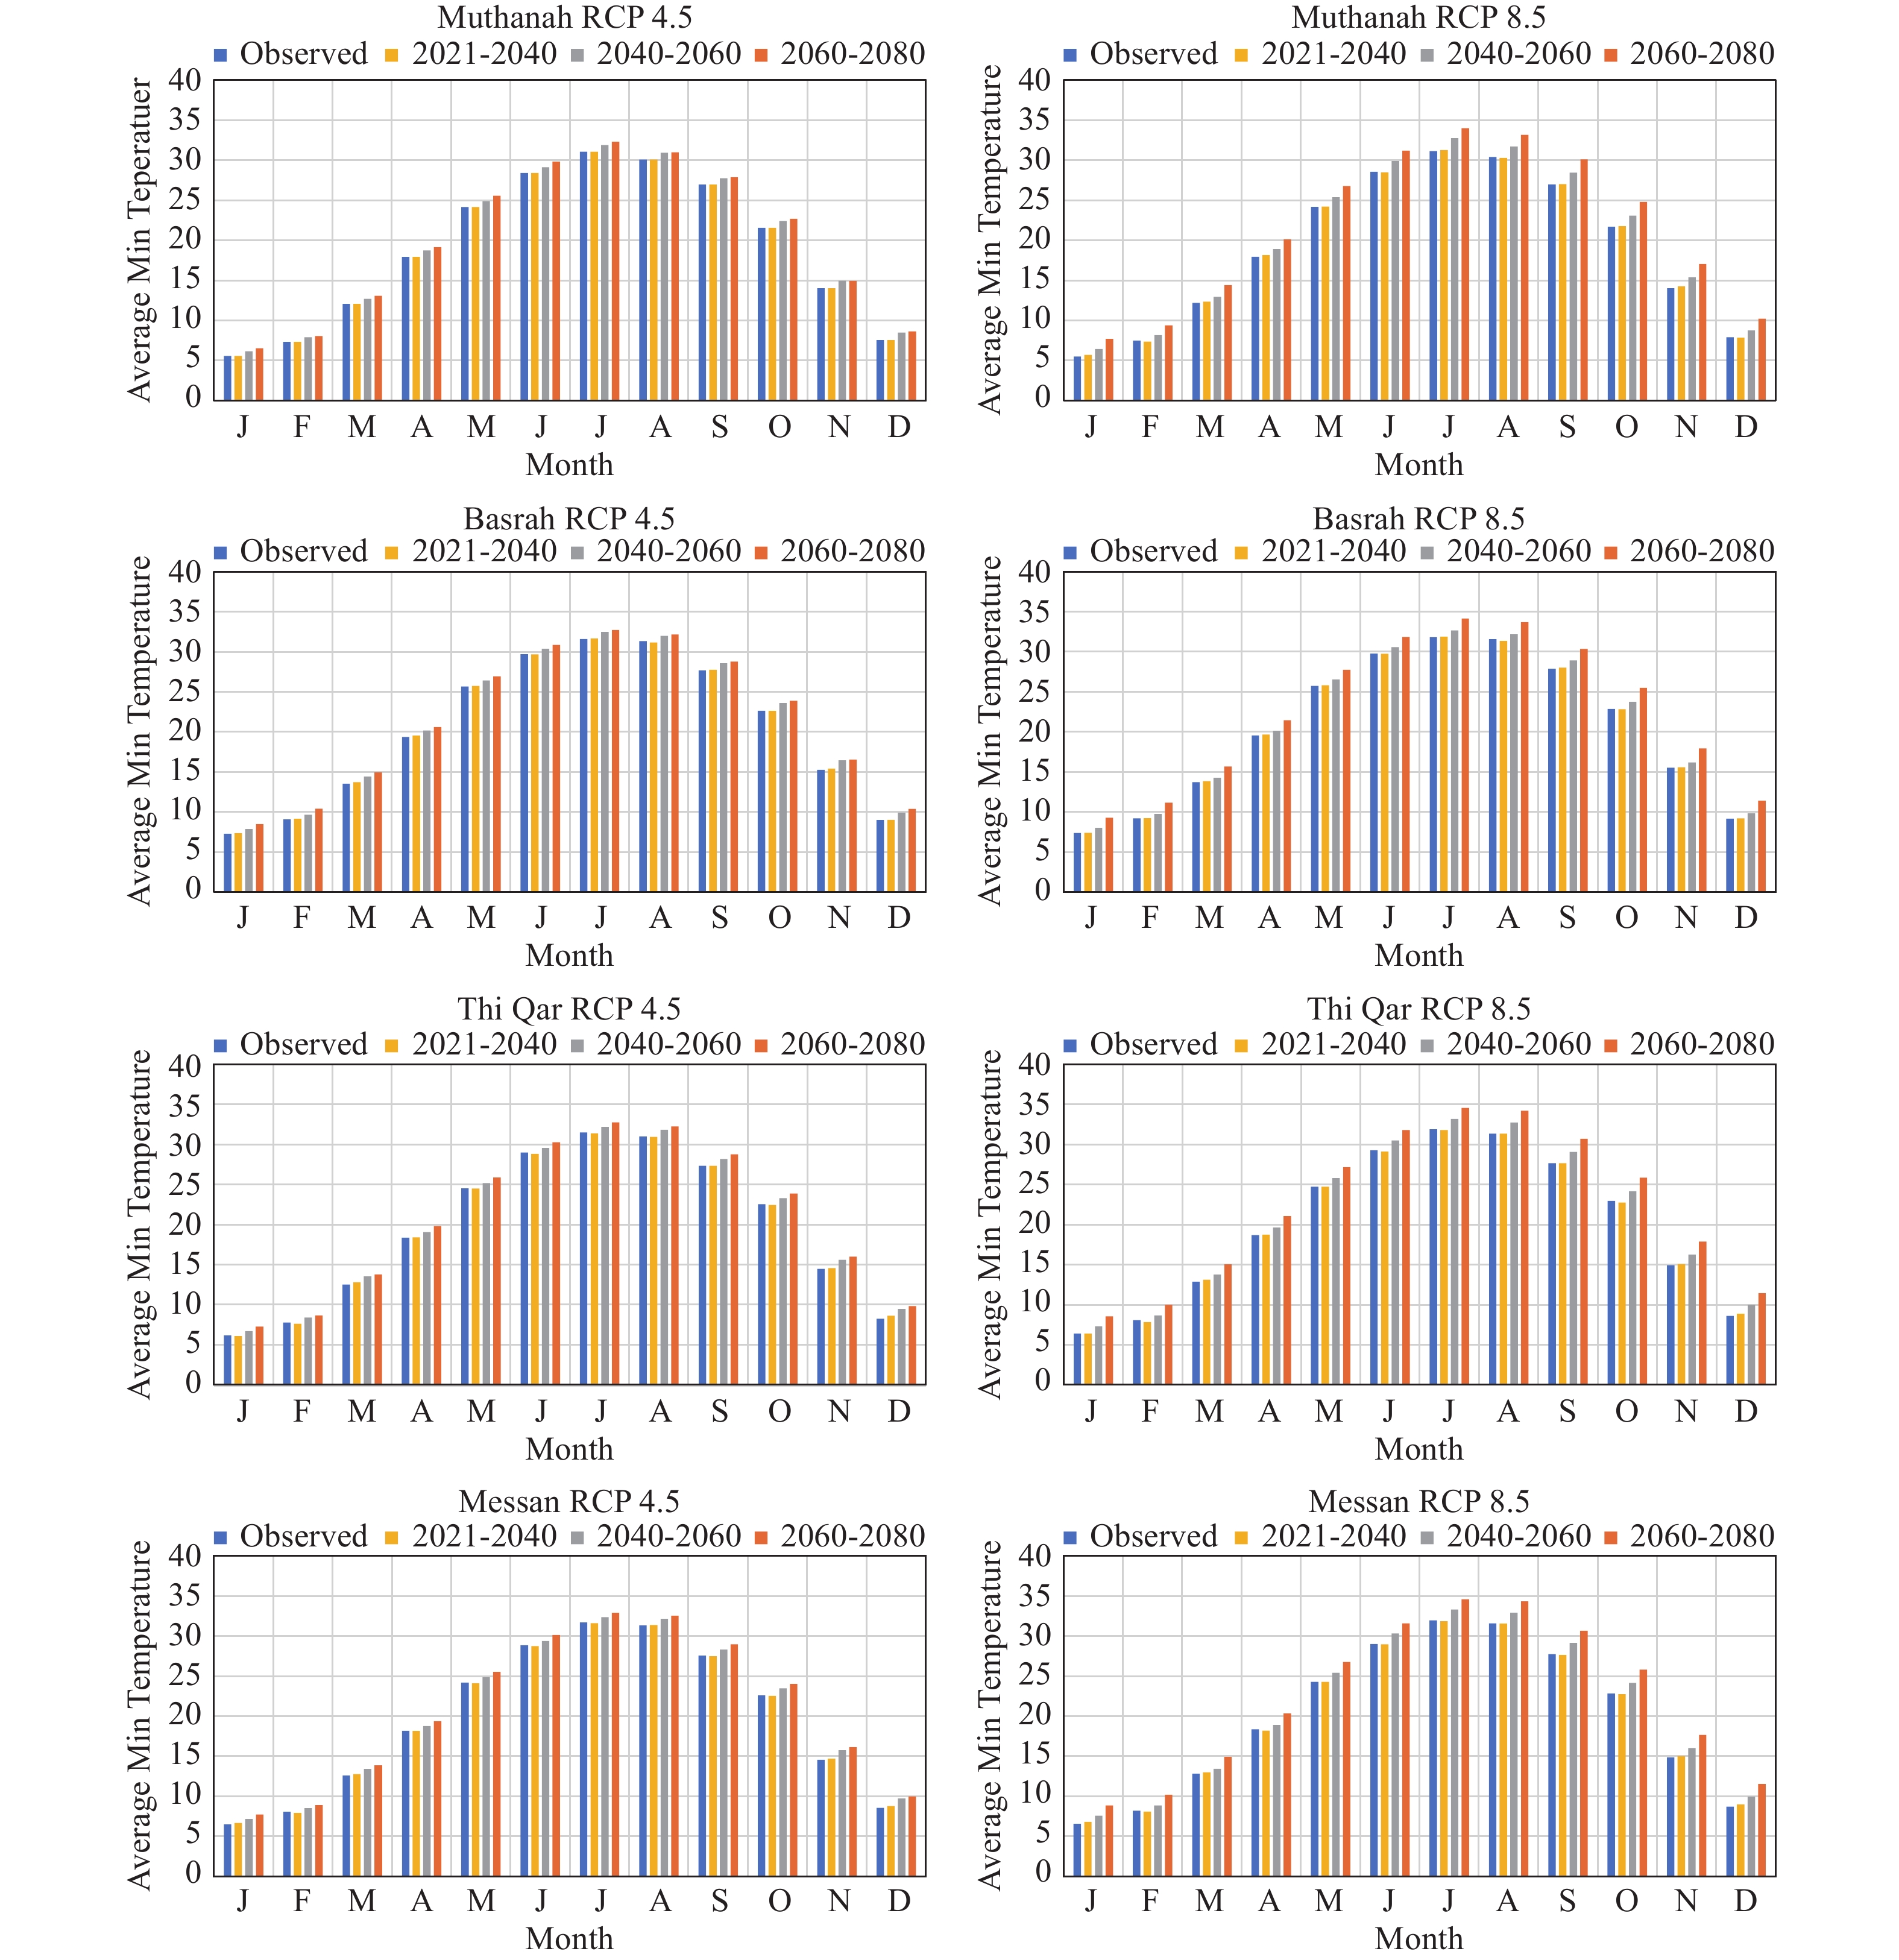
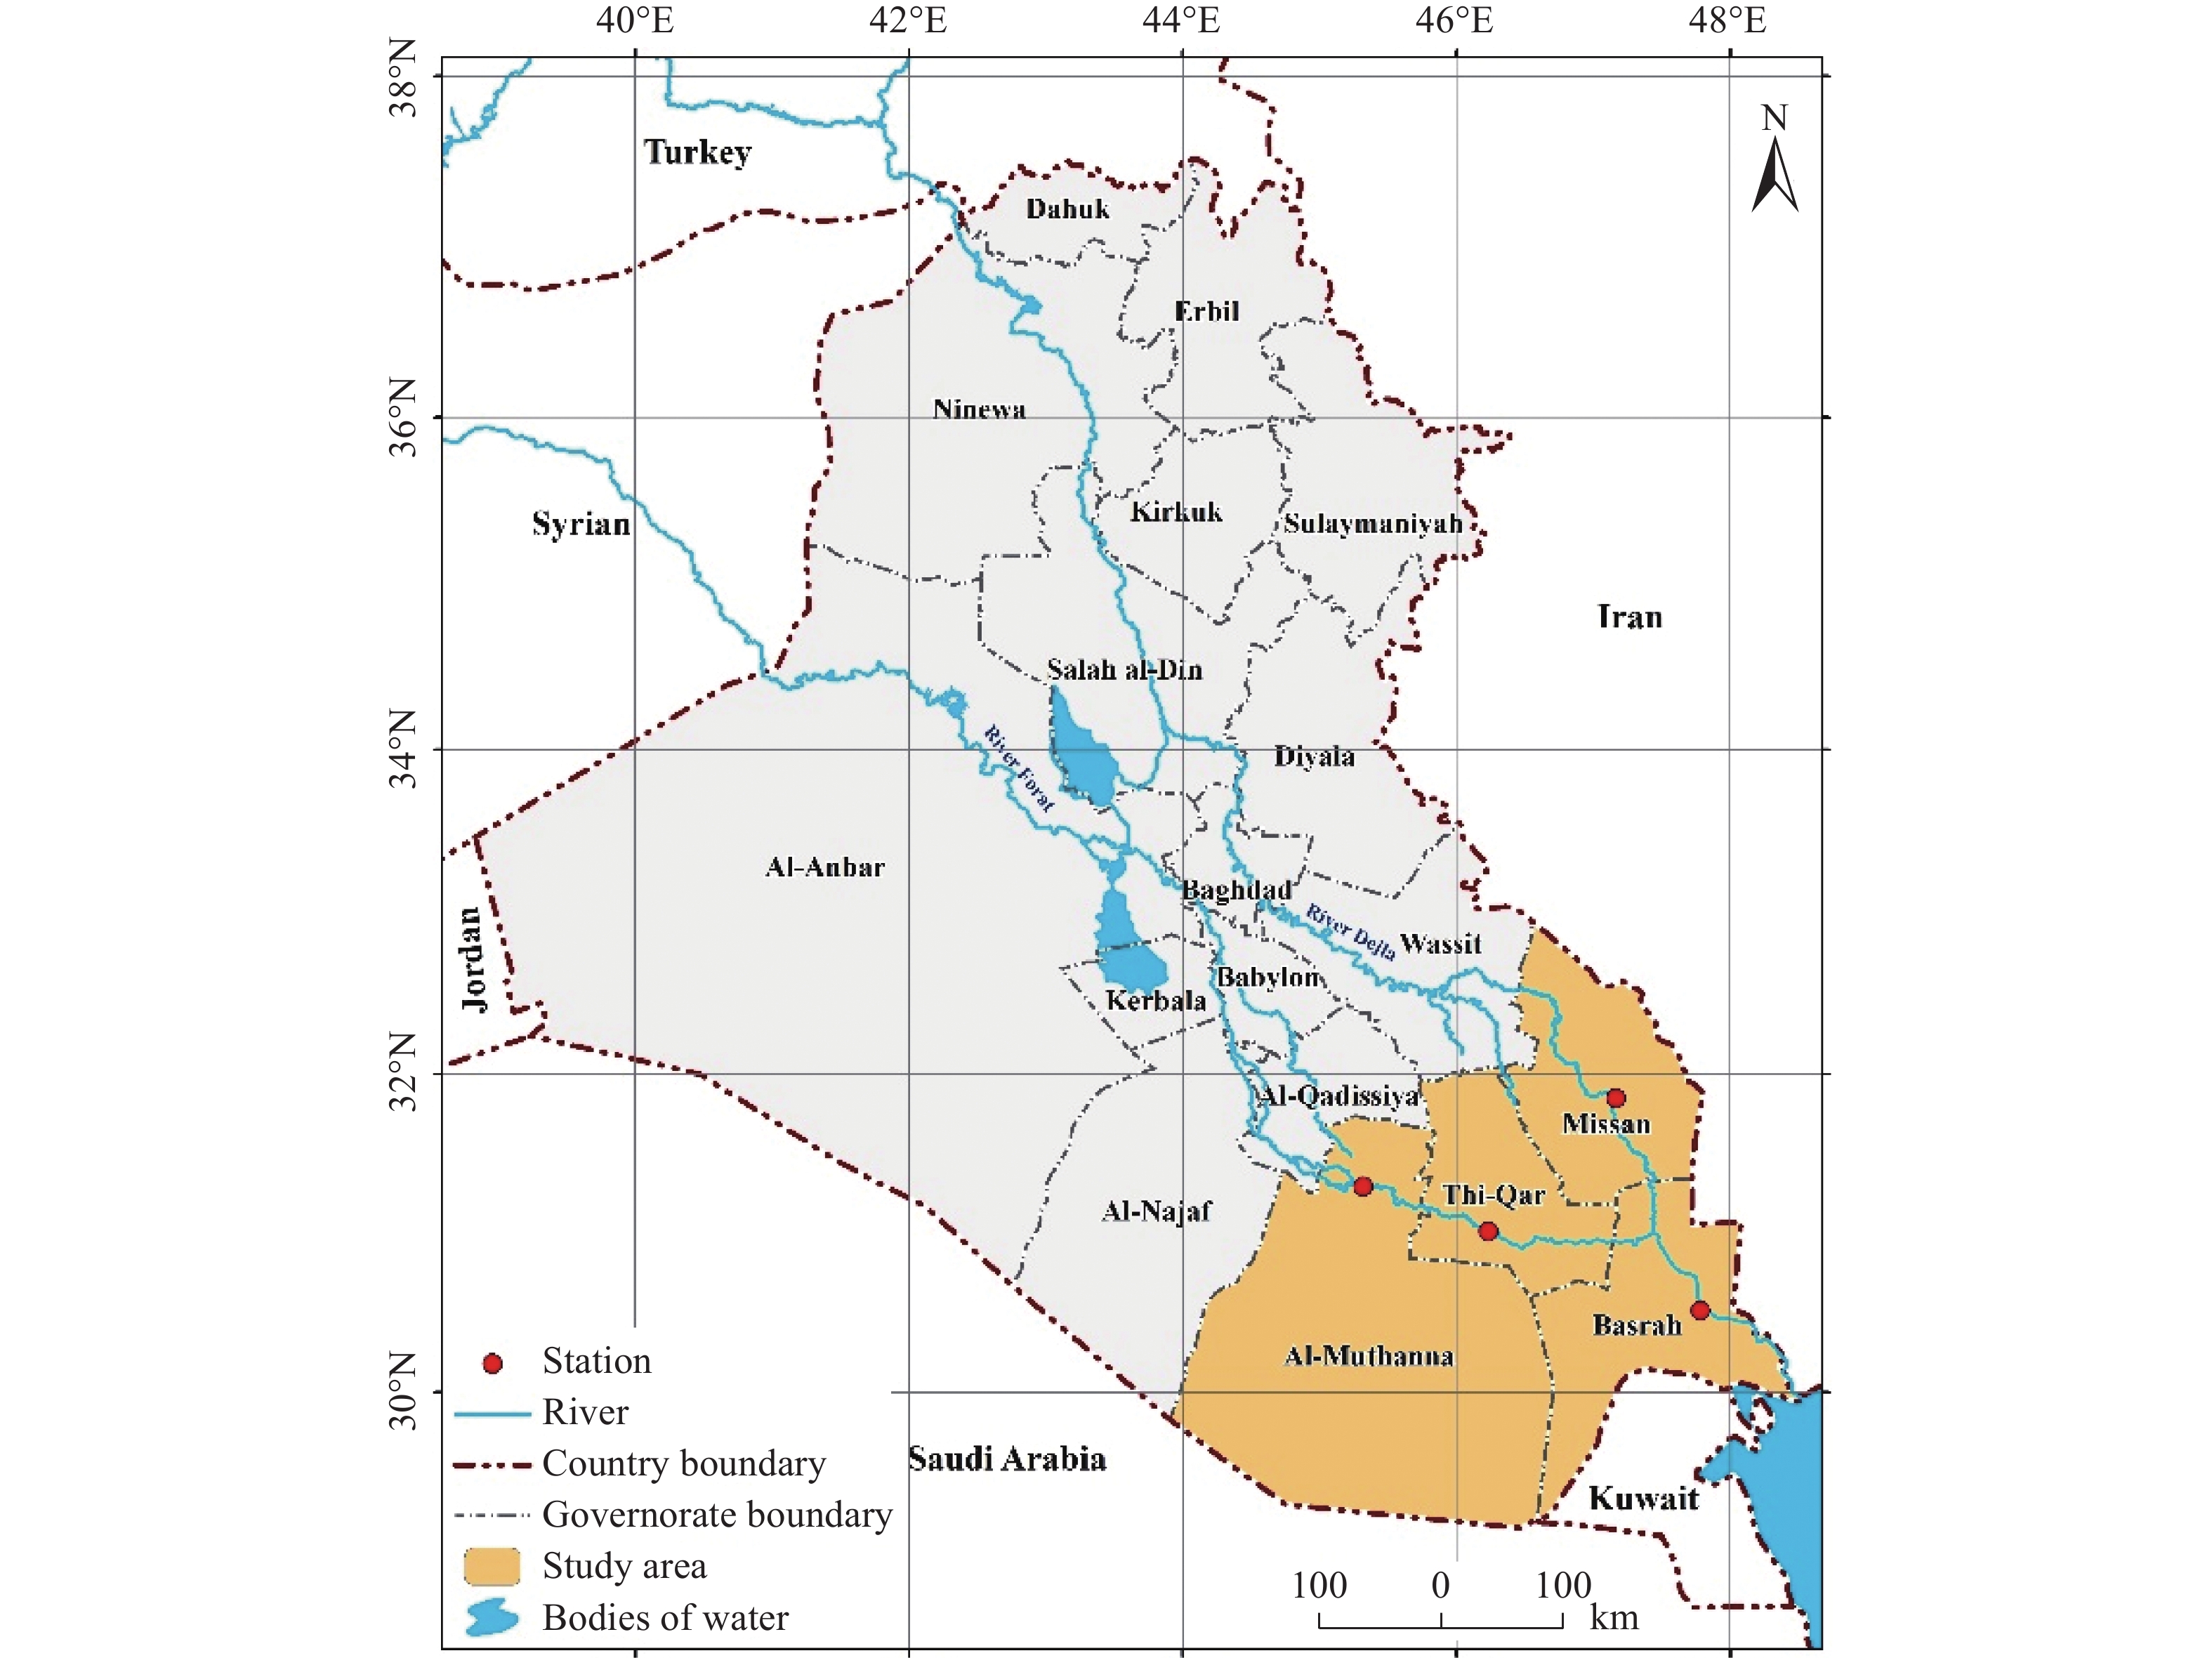
Abstract: This study investigates the impacts of climate change on temperature and precipitation patterns across four governorates in southern Iraq—Basrah, Thi Qar, Al Muthanna, and Messan—using an integrated modeling framework that combines the Long Ashton Research Station Weather Generator (LARS-WG) with three CMIP5-based Global Climate Models (Hadley Centre Global Environmental Model version 2 - Earth System (HadGEM2-ES)), European Community Earth-System Model (EC-Earth), and Model for Interdisciplinary Research on Climate version 5 (MIROC5). Projections were generated for three future time periods (2021–2040, 2041–2060, and 2061–2080) under two Representative Concentration Pathways (RCP4.5 and RCP8.5). By integrating high-resolution climate simulations with localized drought risk analysis, this study provides a detailed outlook on climate change trends in the region. The novelty of this research lies in its high-resolution, station-level analysis and its integration of localized statistical downscaling techniques to enhance the spatial applicability of coarse GCM outputs. Model calibration and validation were performed using historical climate data (1990–2020), resulting in high accuracy across all stations (R2 = 0.91–0.99; RMSE = 0.19–2.78), thus reinforcing the robustness of the projections. Results indicate a significant rise in average annual maximum and minimum temperatures, with increases ranging from 0.88°C to 3.68°C by the end of the century, particularly under the RCP8.5 scenario. Precipitation patterns exhibit pronounced interannual variability, with the highest predicted increases reaching up to 19.26 mm per season, depending on the model and location. These shifts suggest heightened vulnerability to drought and water scarcity, particularly in already arid regions such as Muthanna and Thi Qar. The findings underscore the urgent need for adaptive strategies in water resource management and agricultural planning, providing decision-makers with region-specific climate insights critical for sustainable development under changing climate conditions.
-

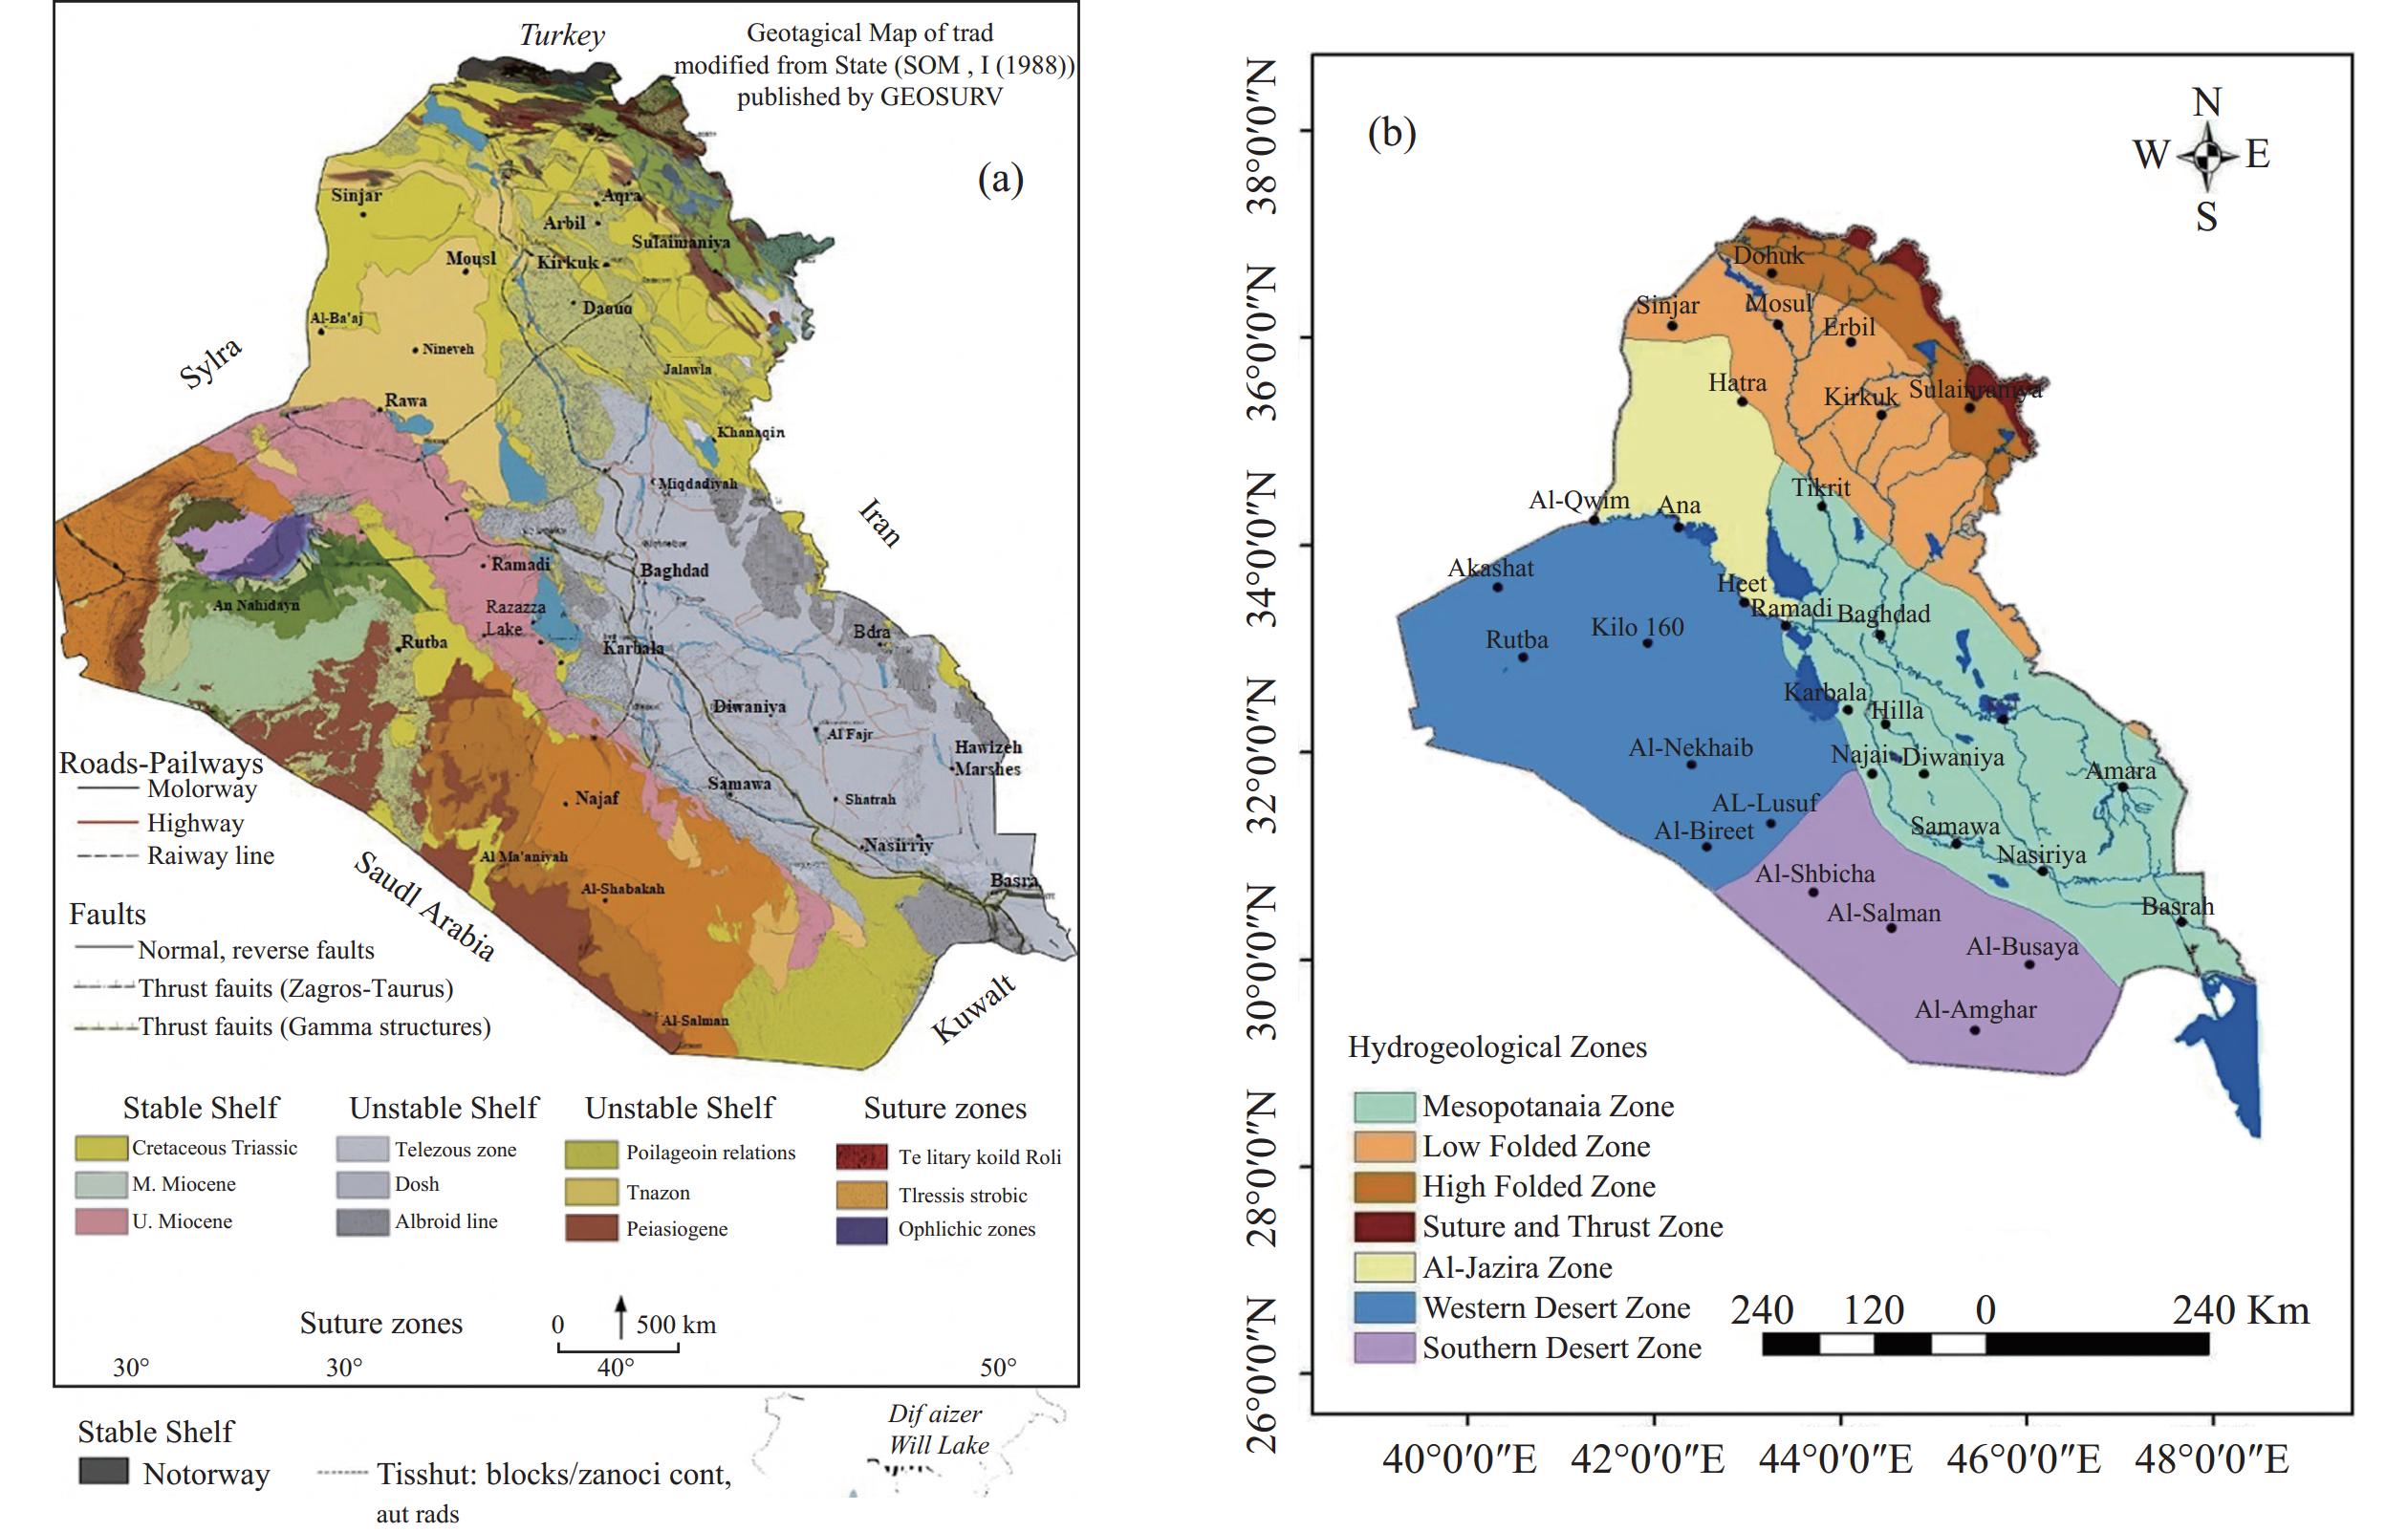
Figure 2. Geological map of Iraq (Al-Ansari et al. 2021)

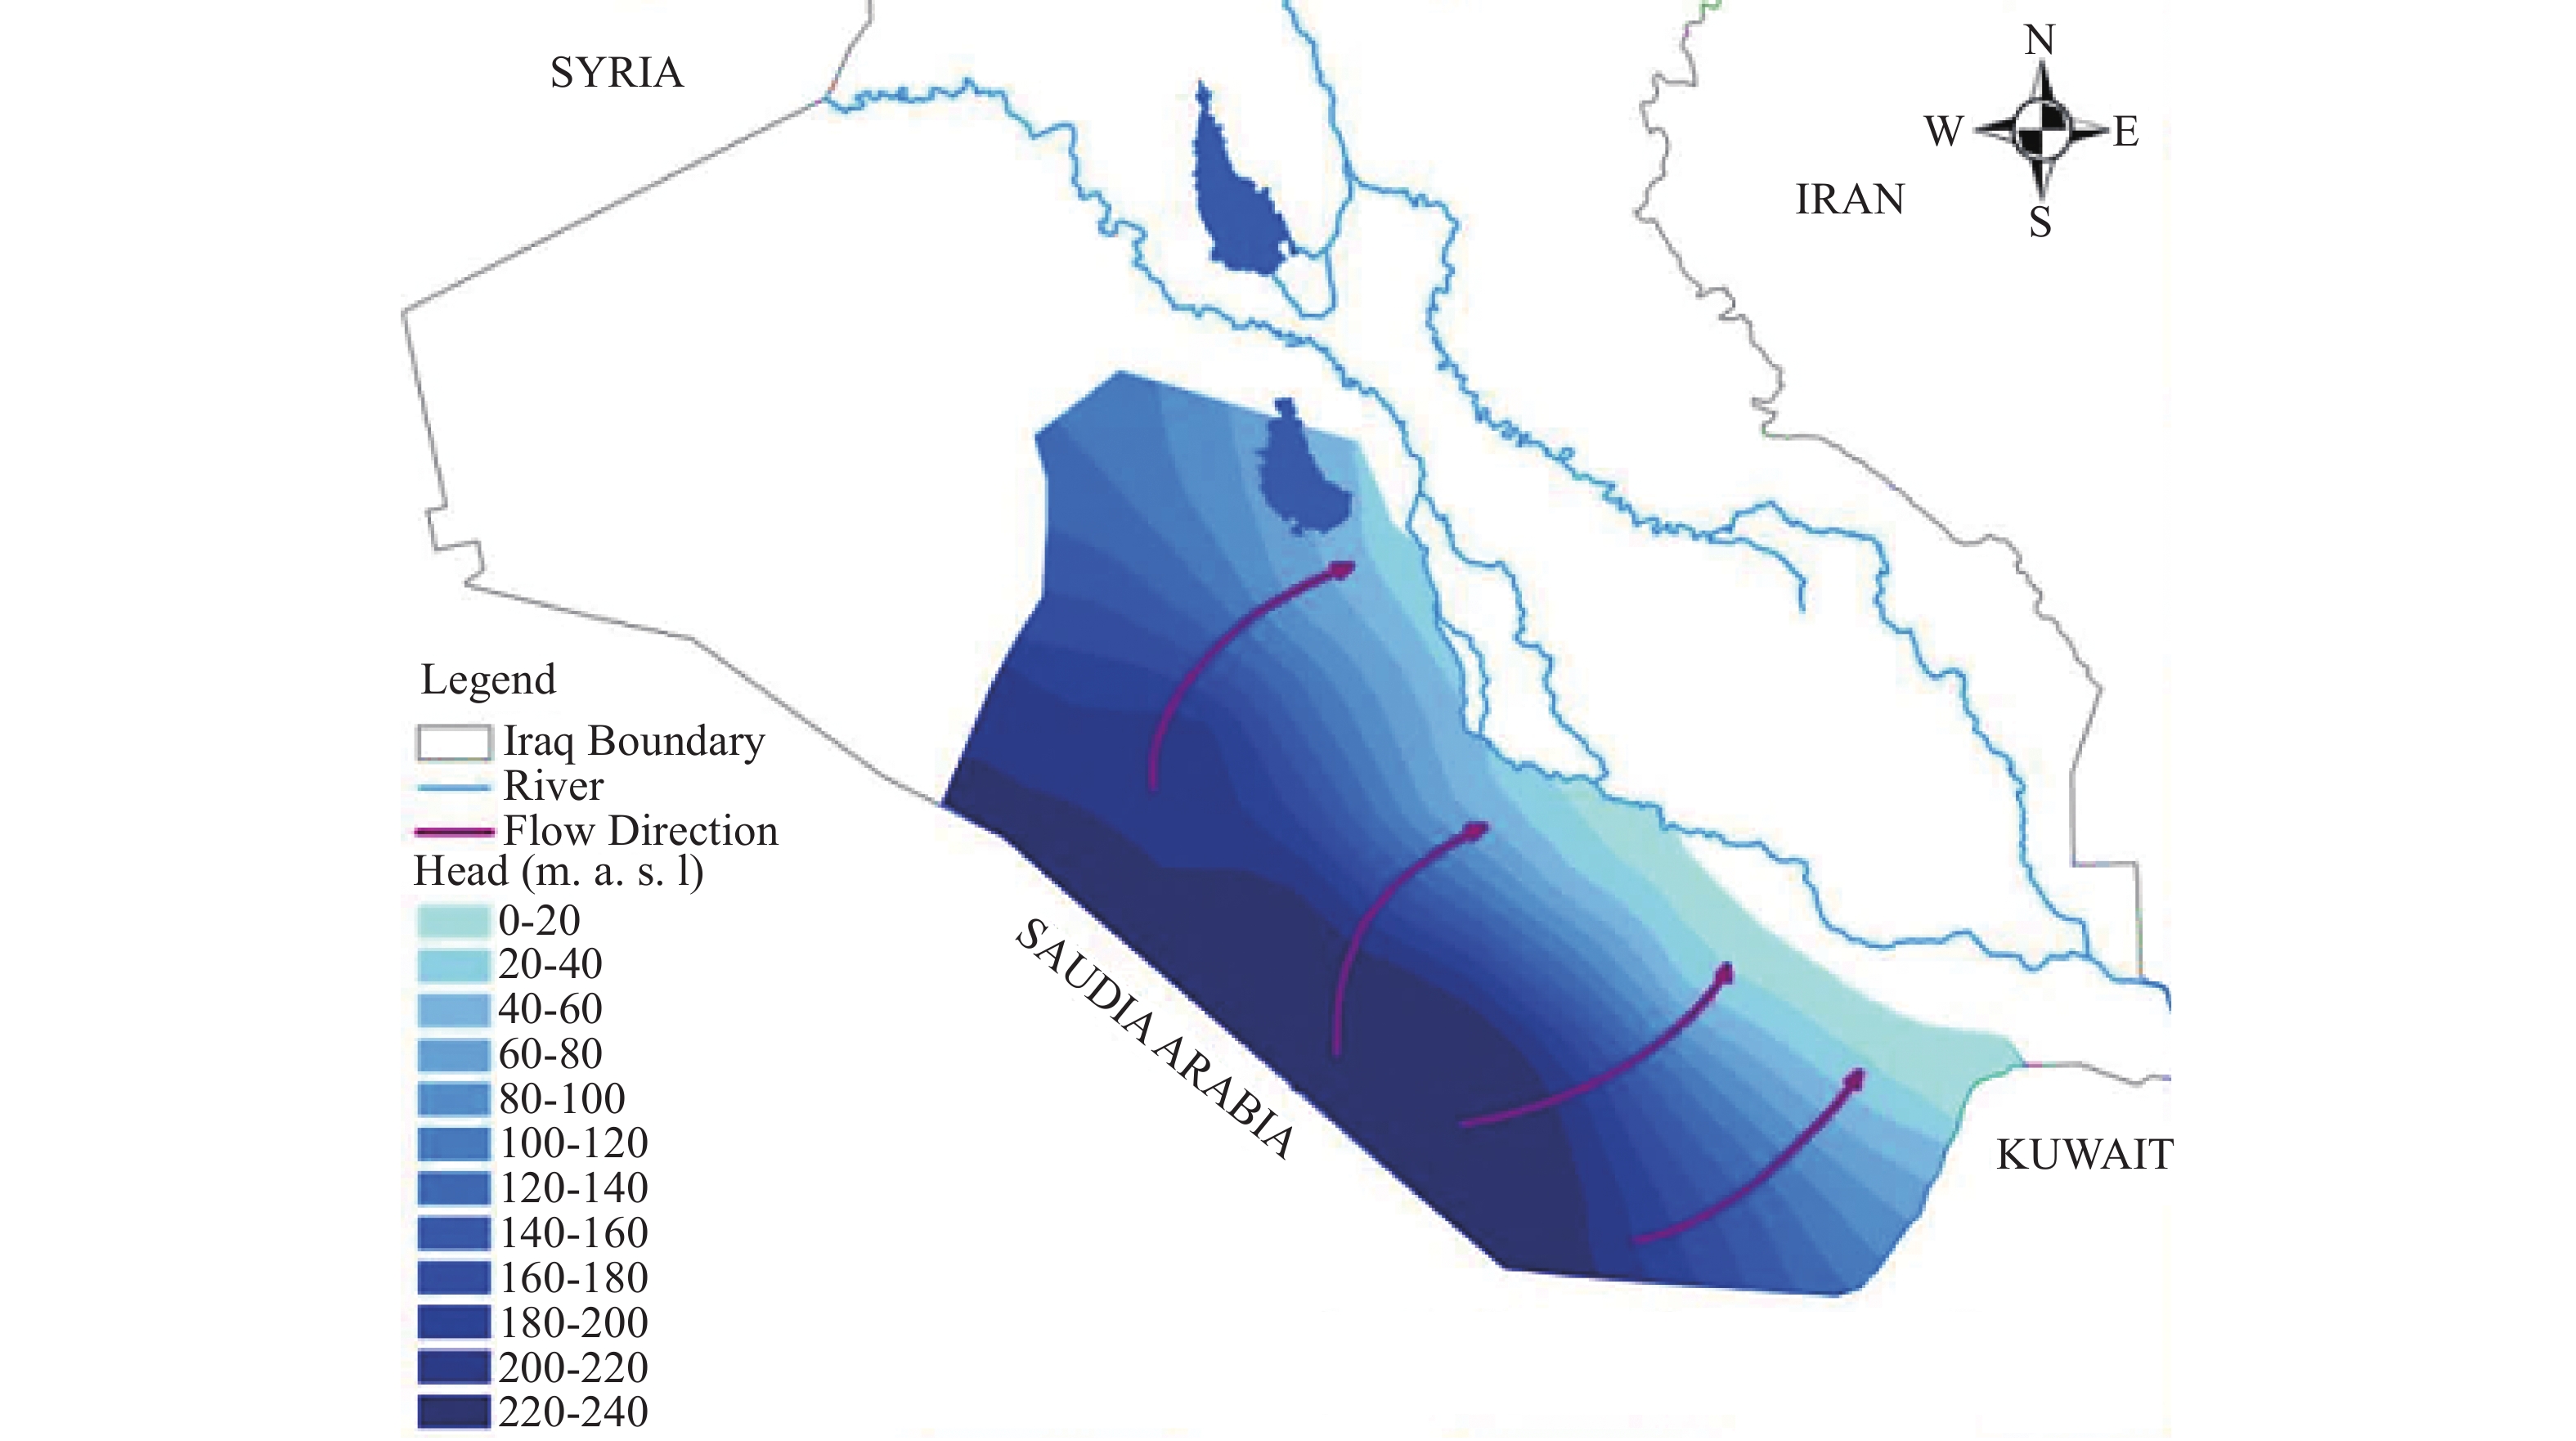
Figure 3. Groundwater movement in the Southeast part of Iraq (Al-Bahrani et al. 2022)
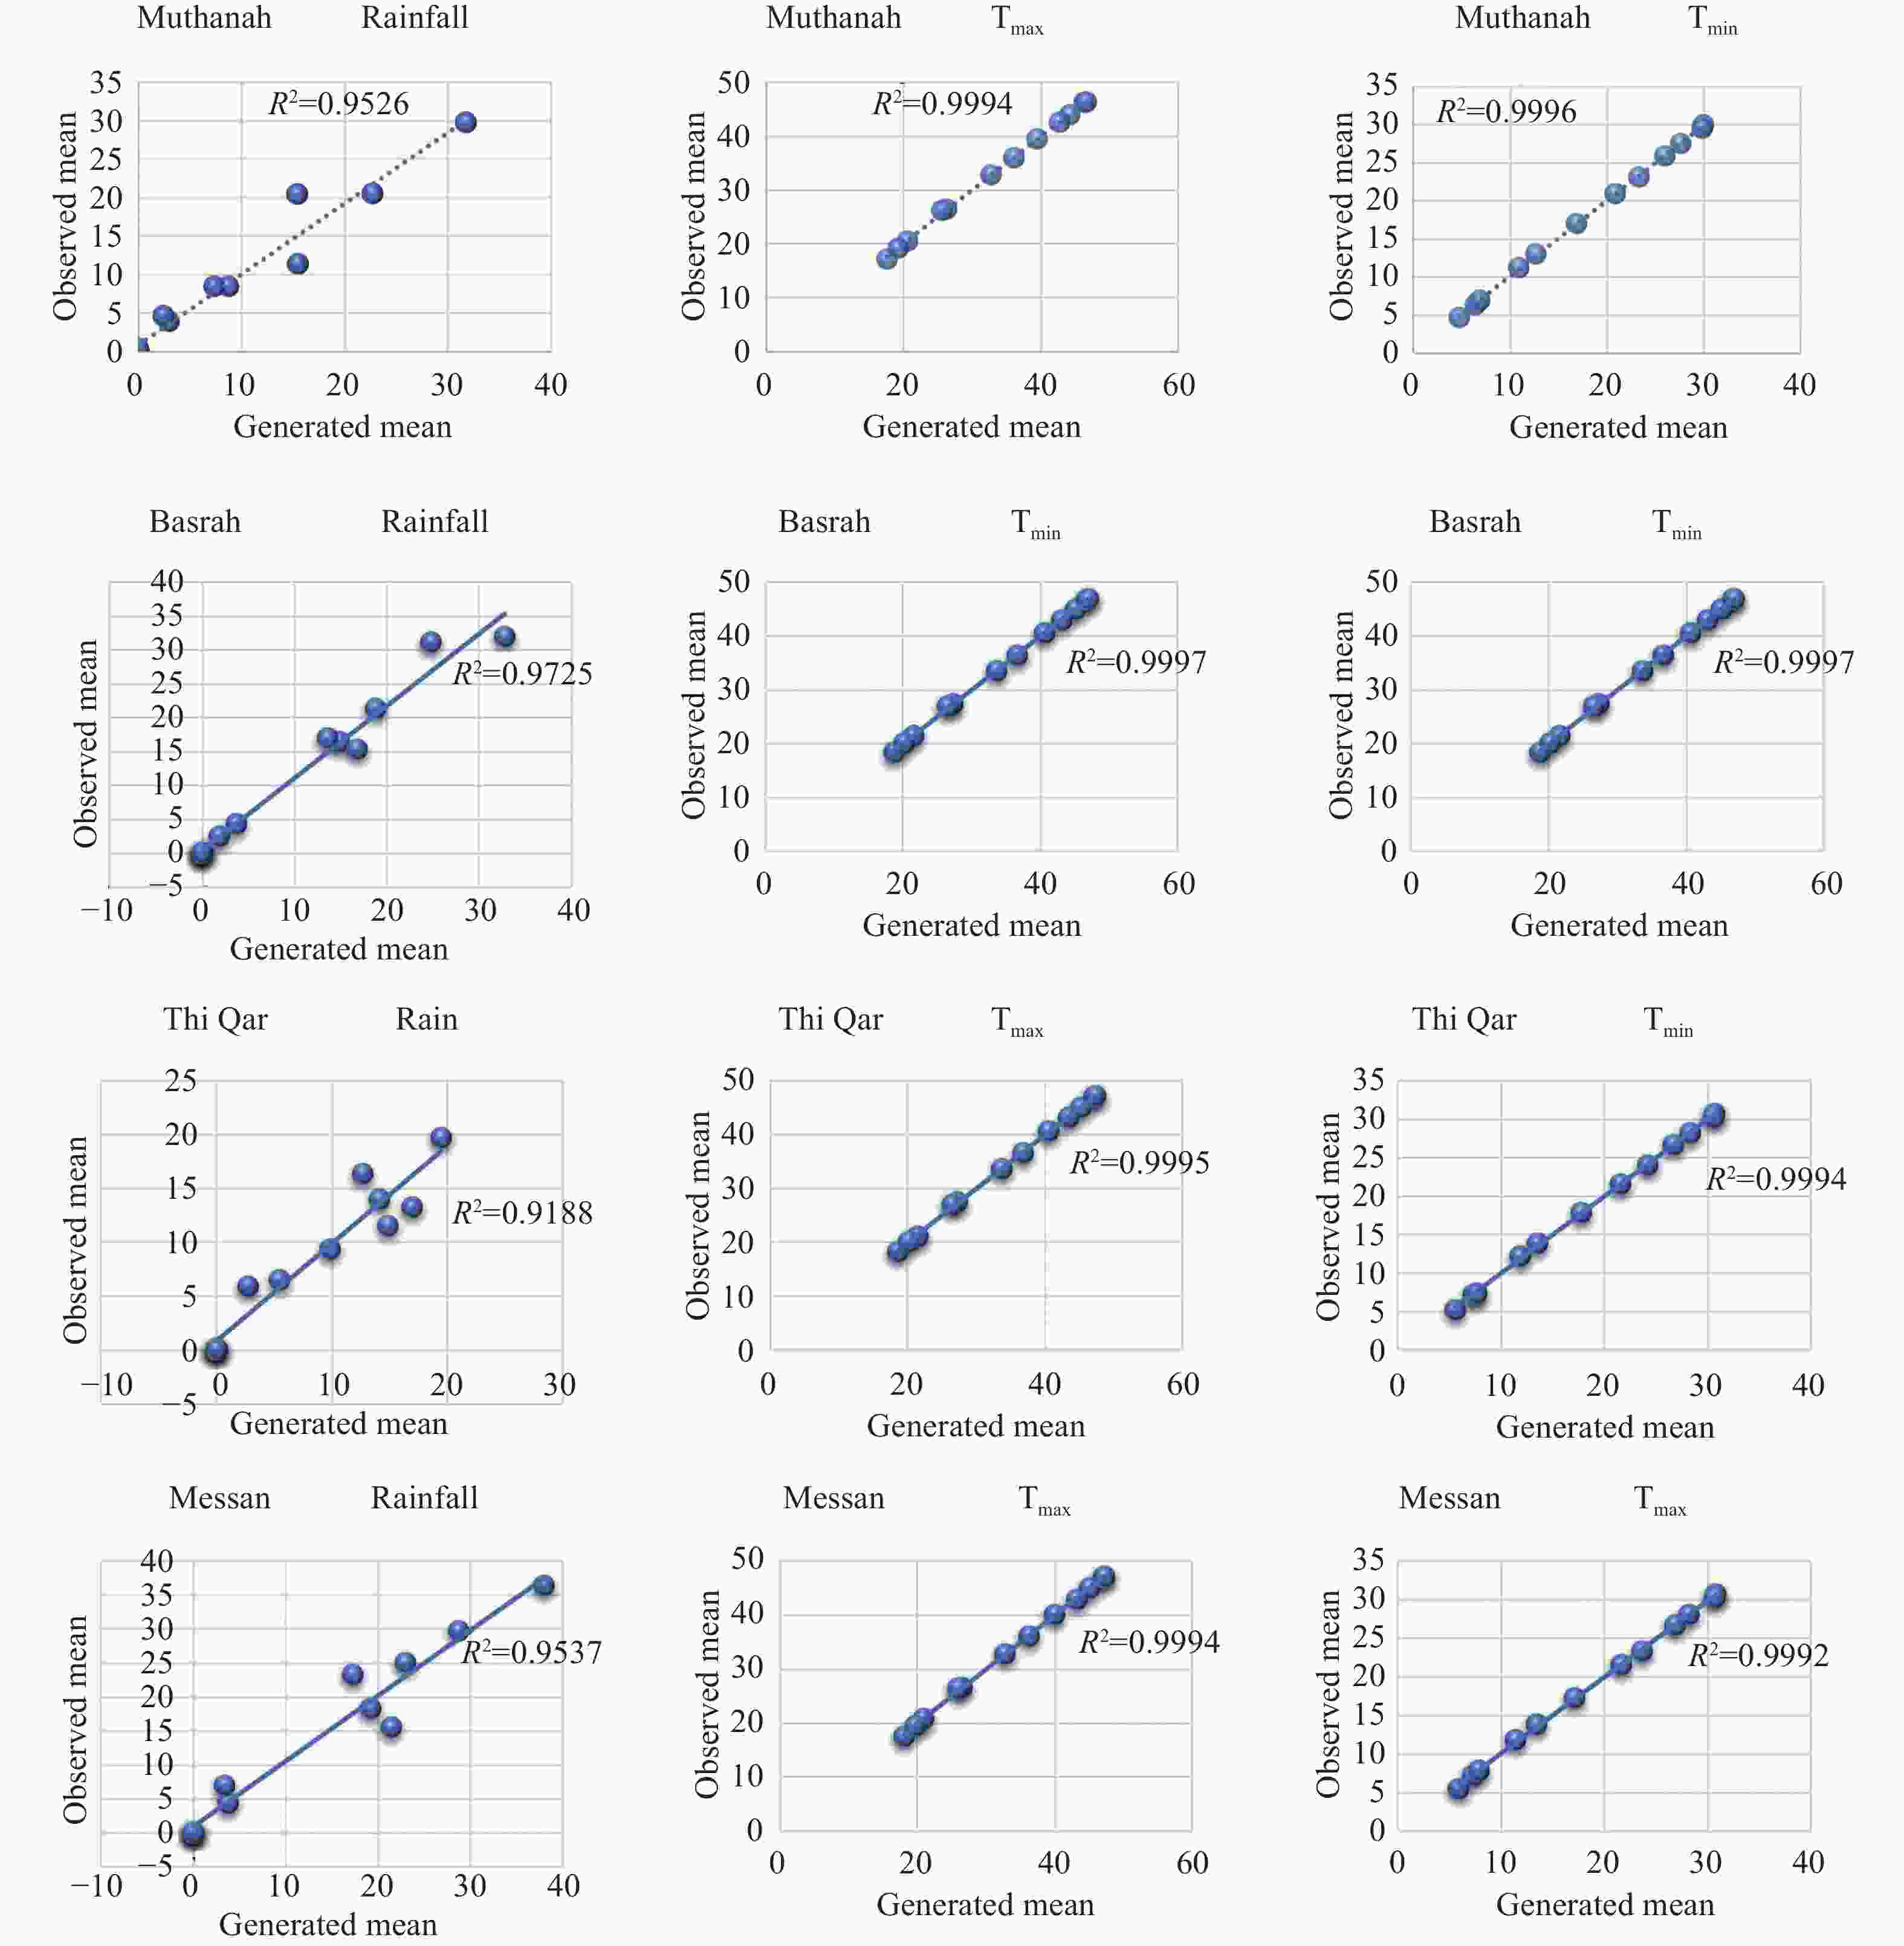
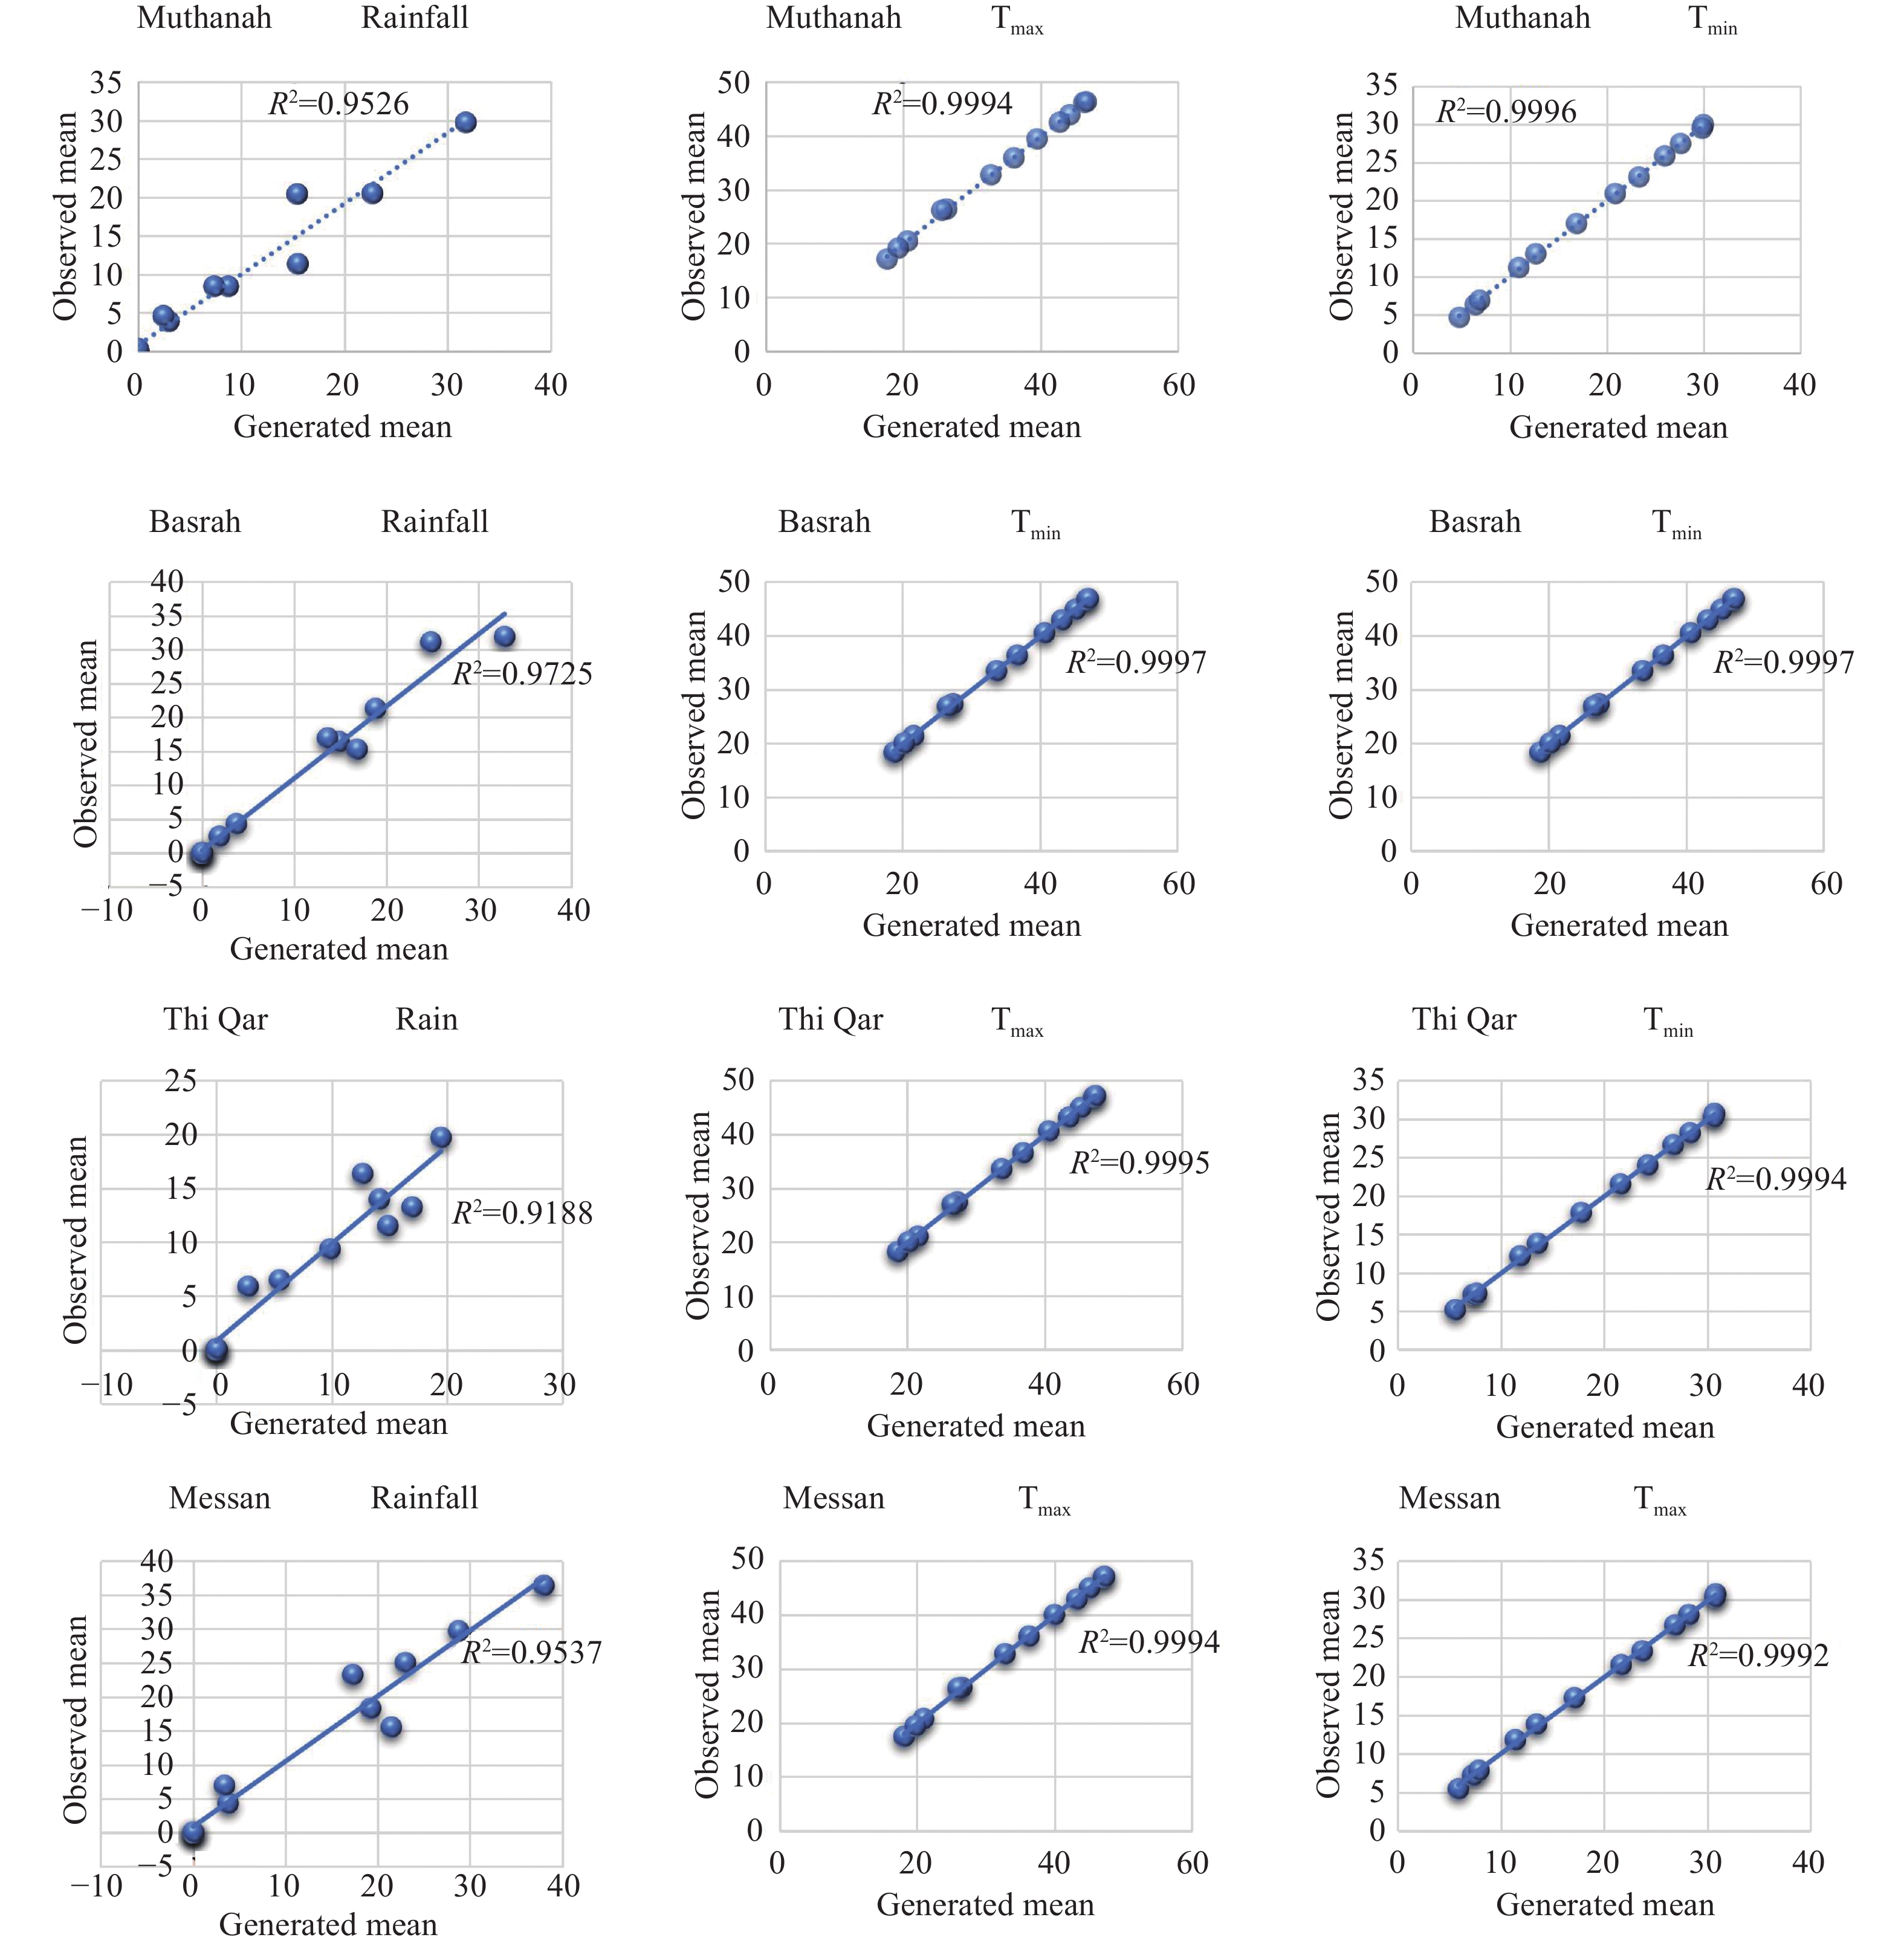
Figure 5. The coefficient of determination (R2) between the observed and the simulated data for rainfall, maximum and minimum temperature

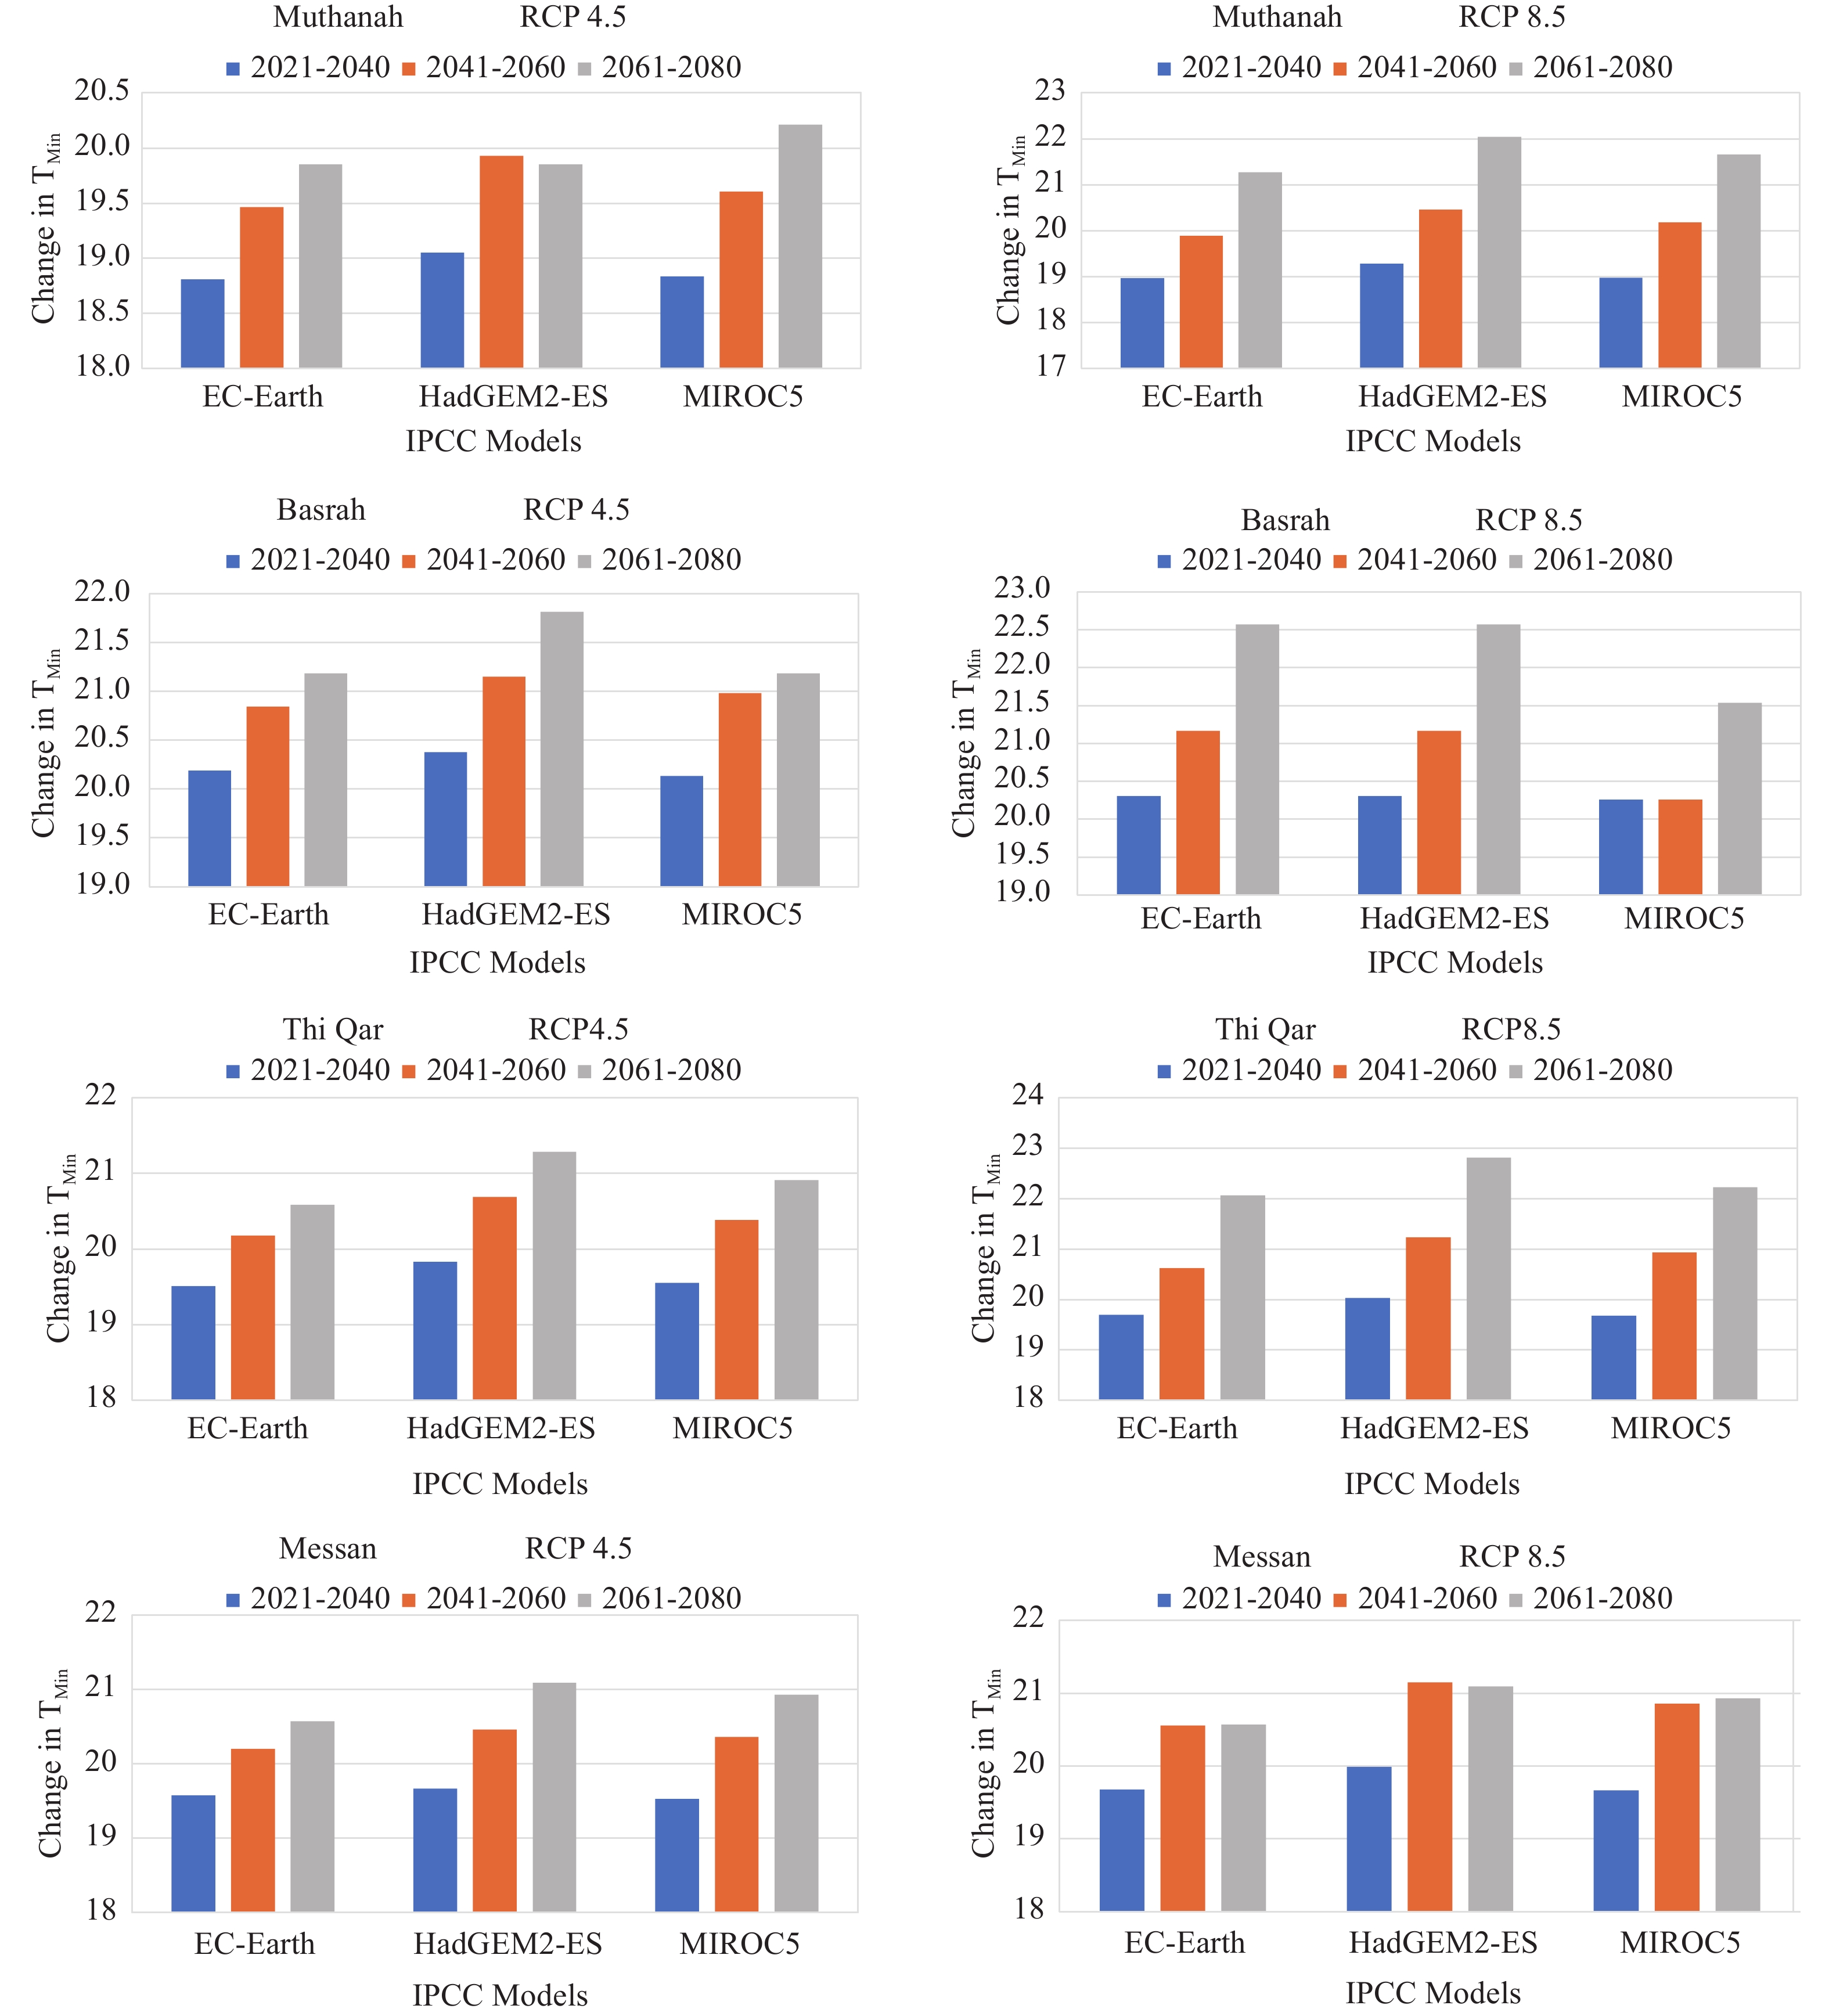
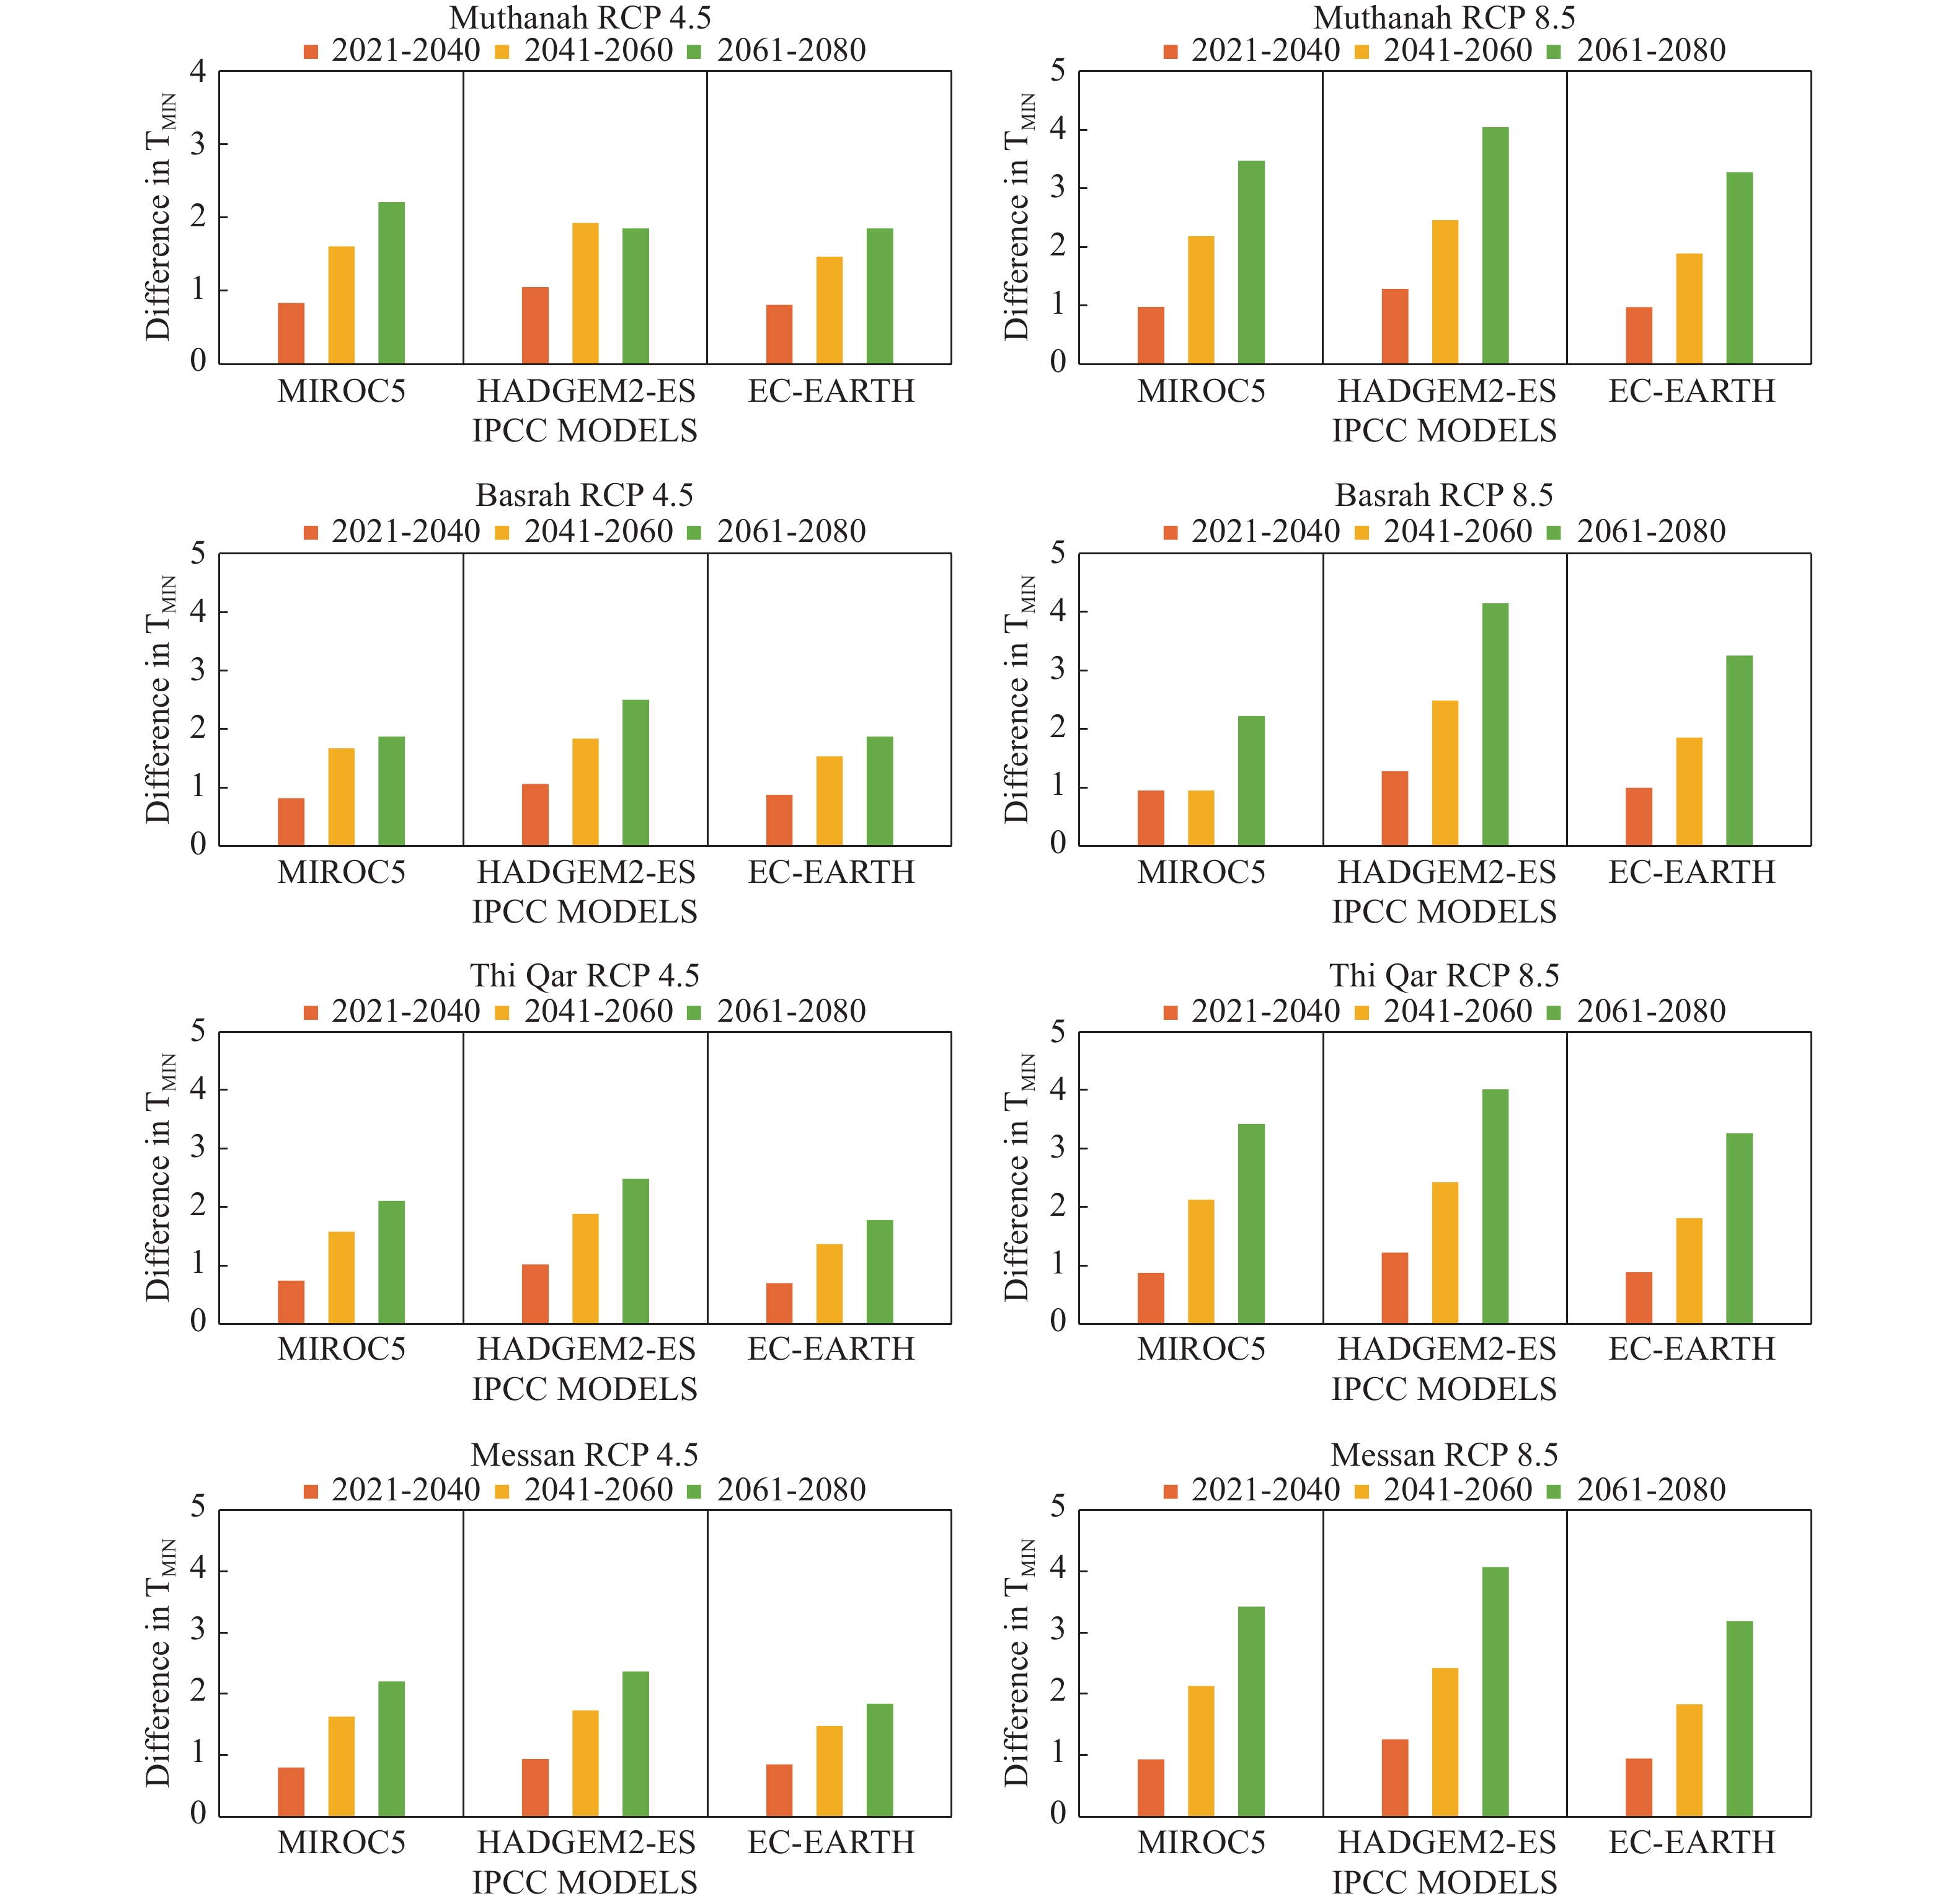
Figure 10. Annual minimum temperature difference between the simulated values for the three periods and the observed value
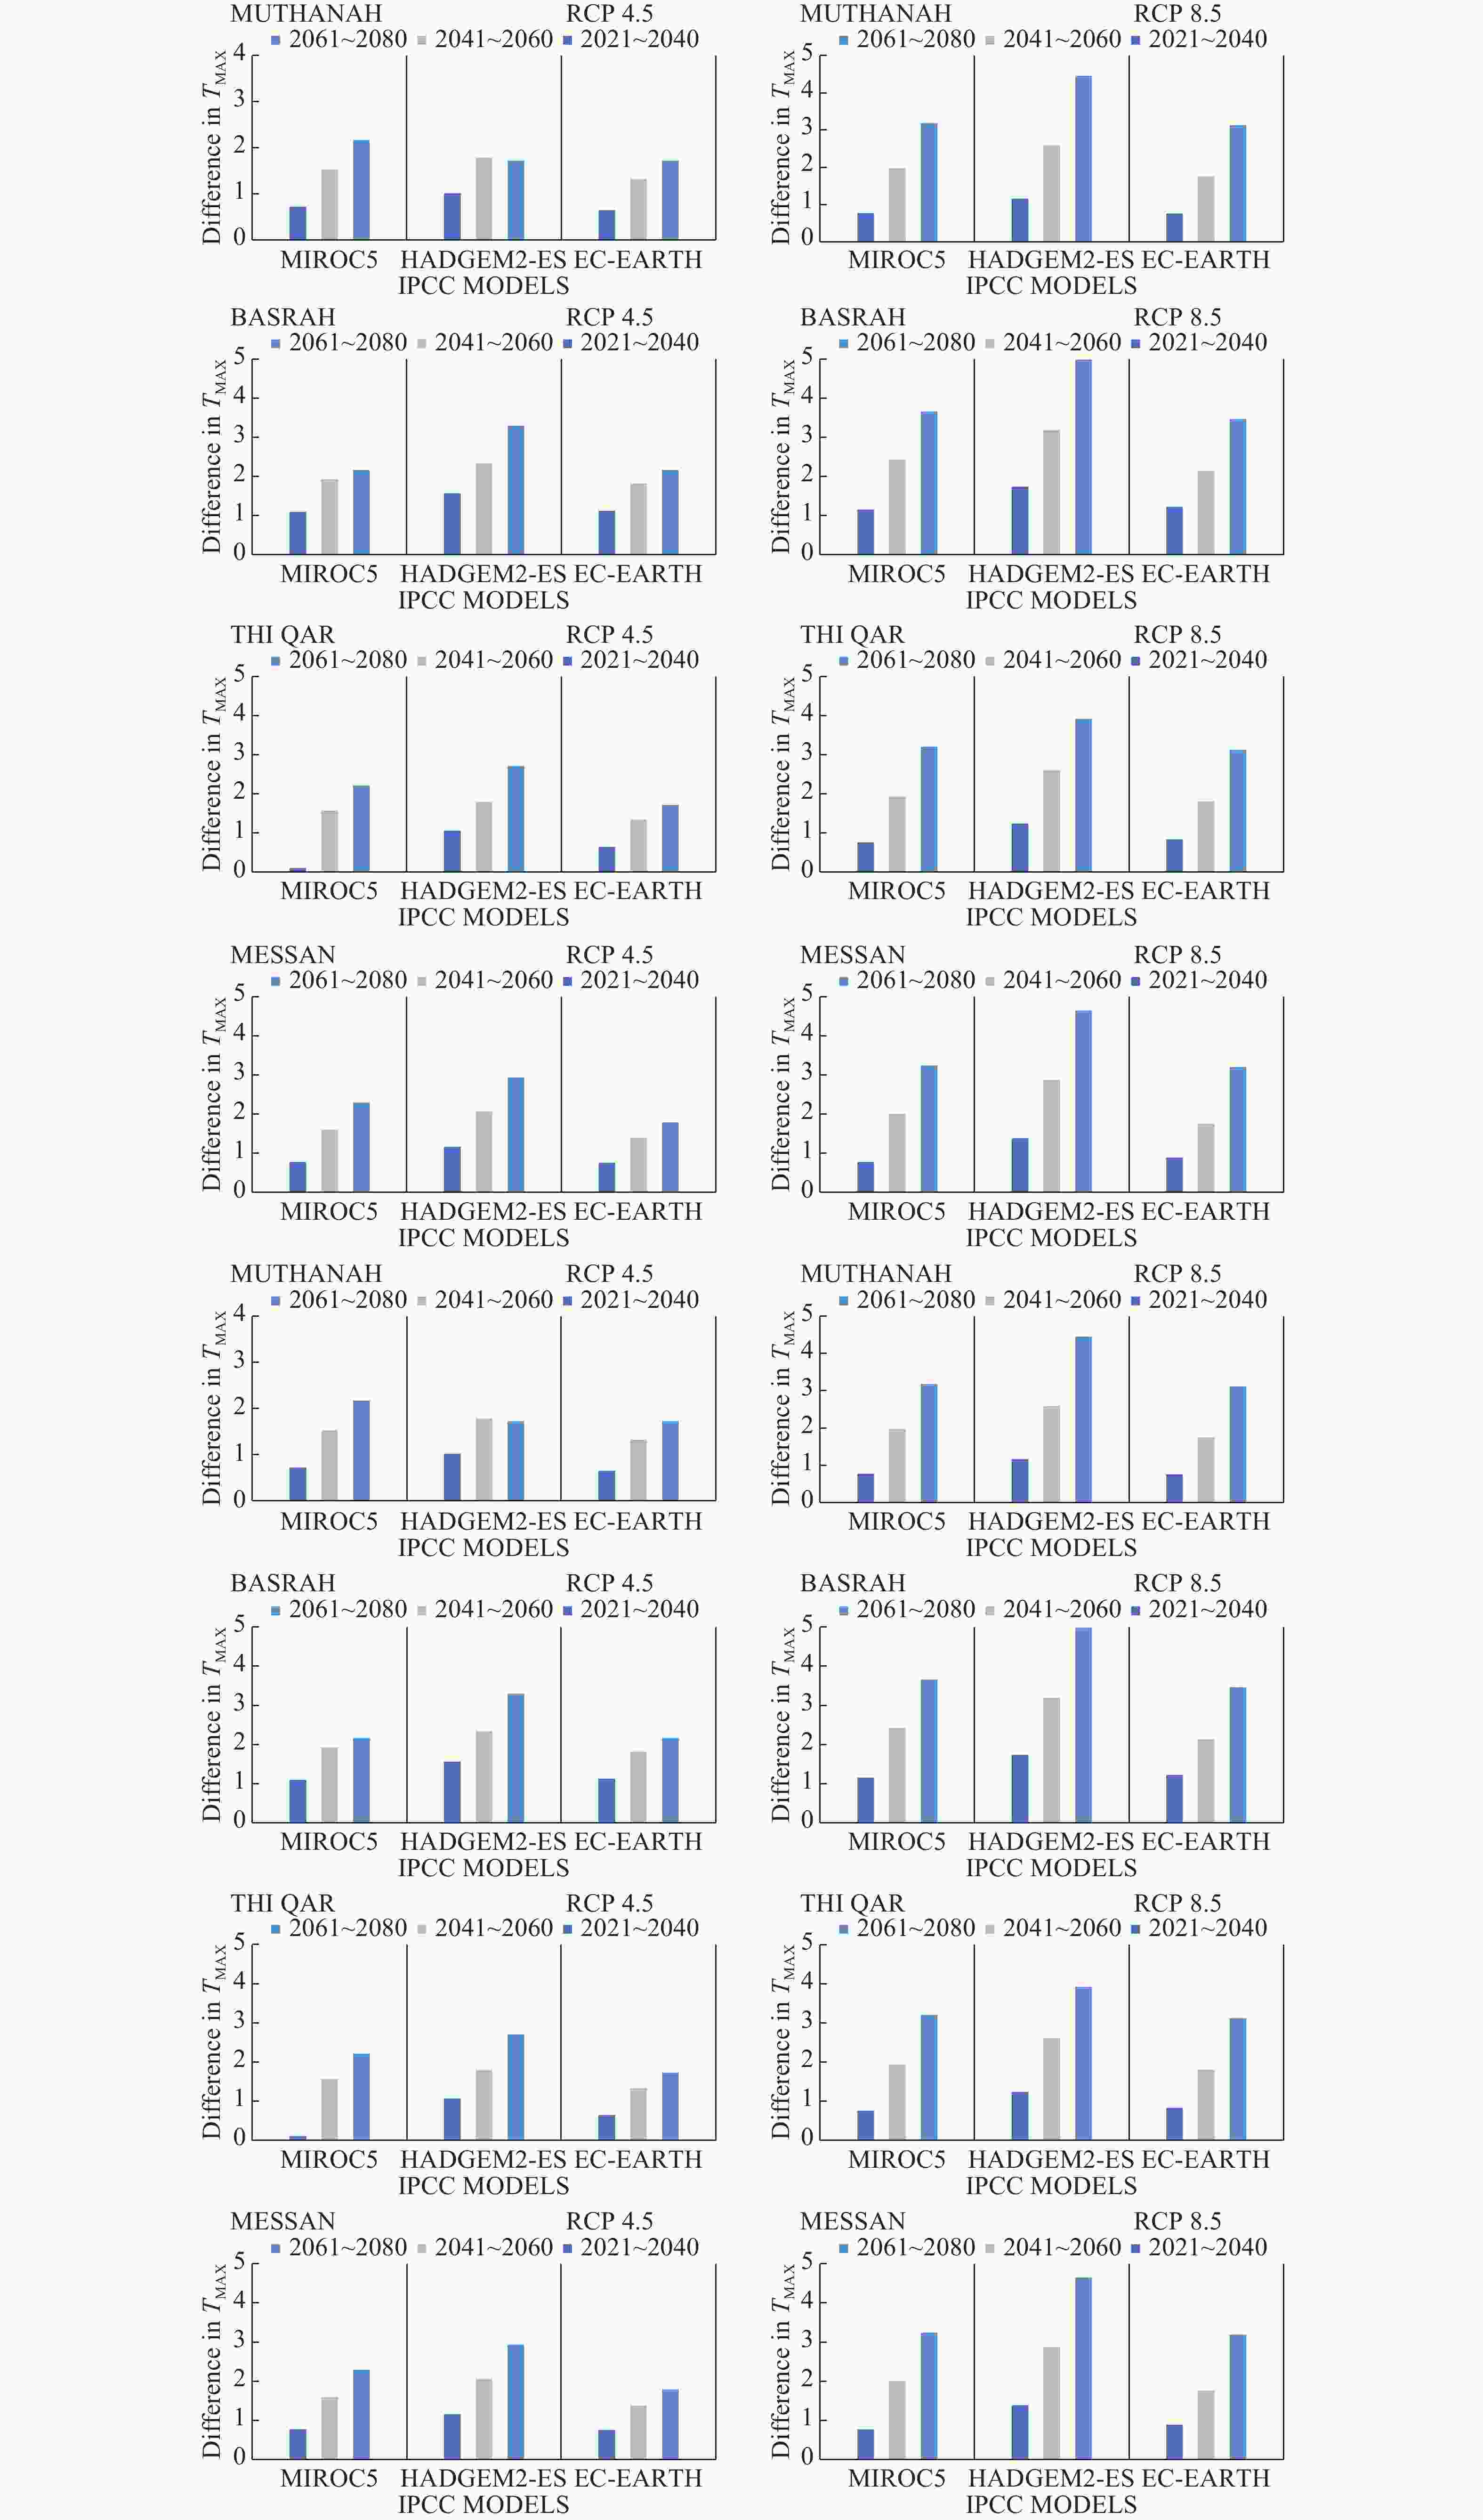
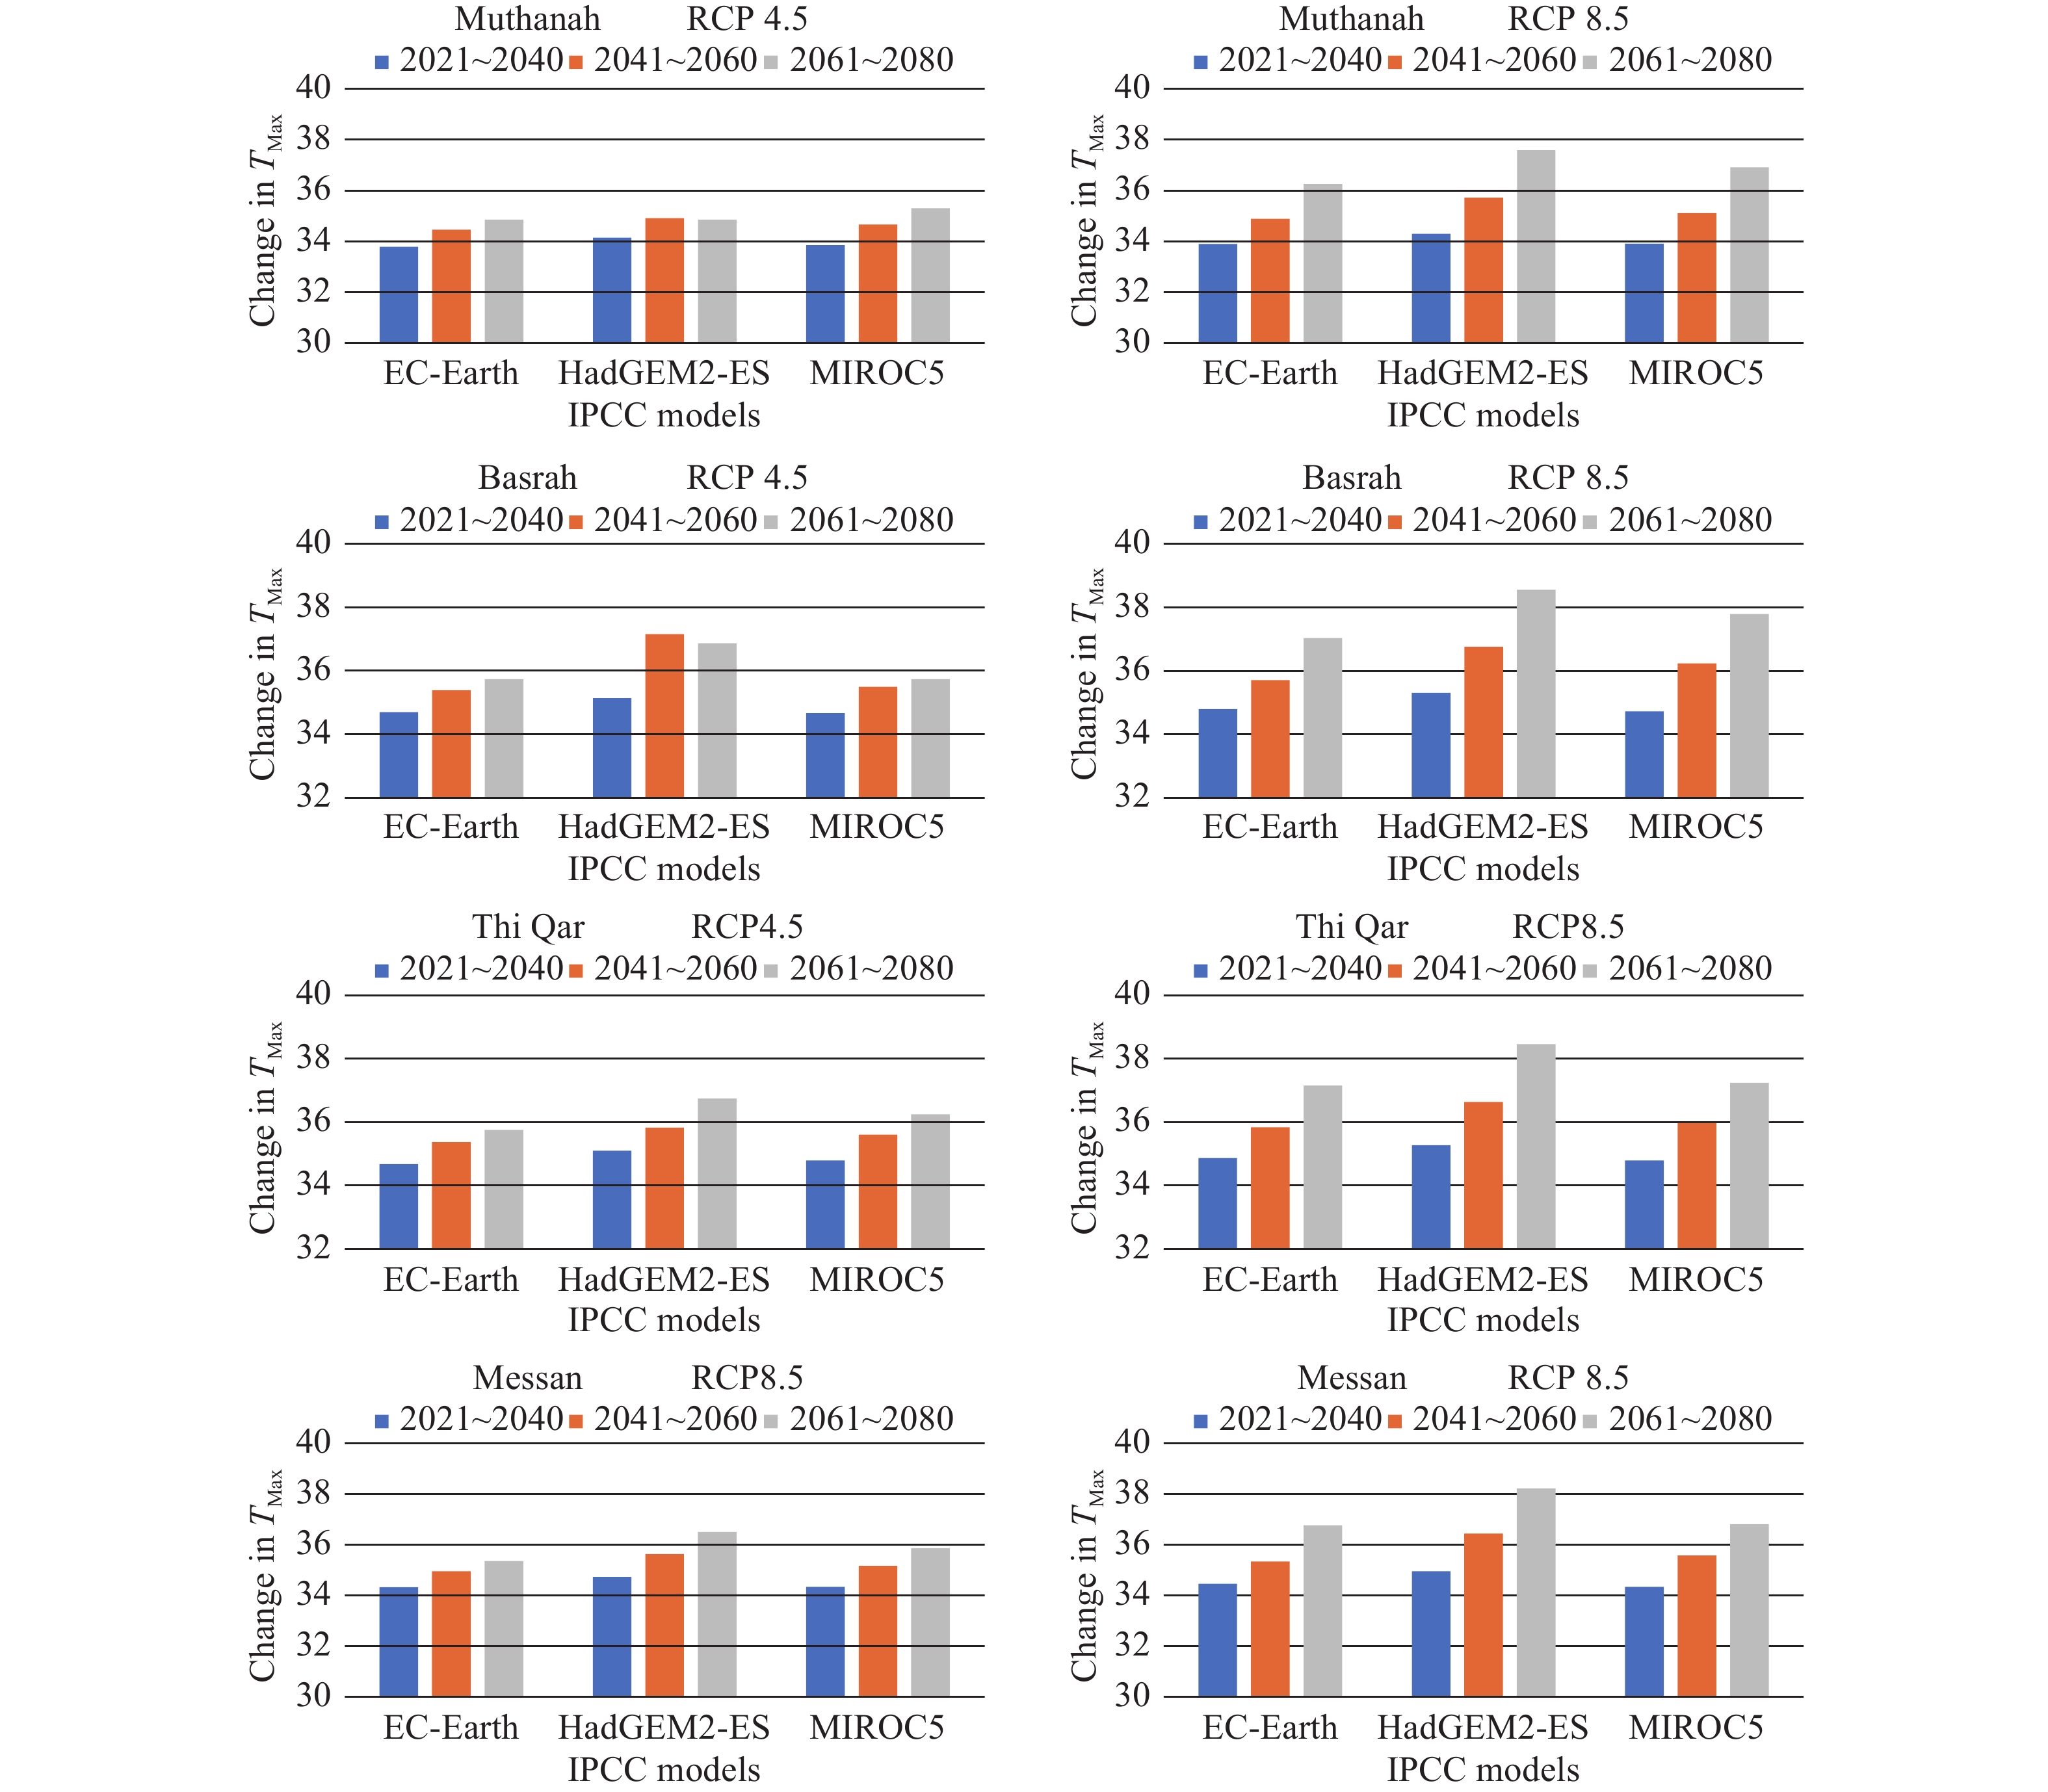
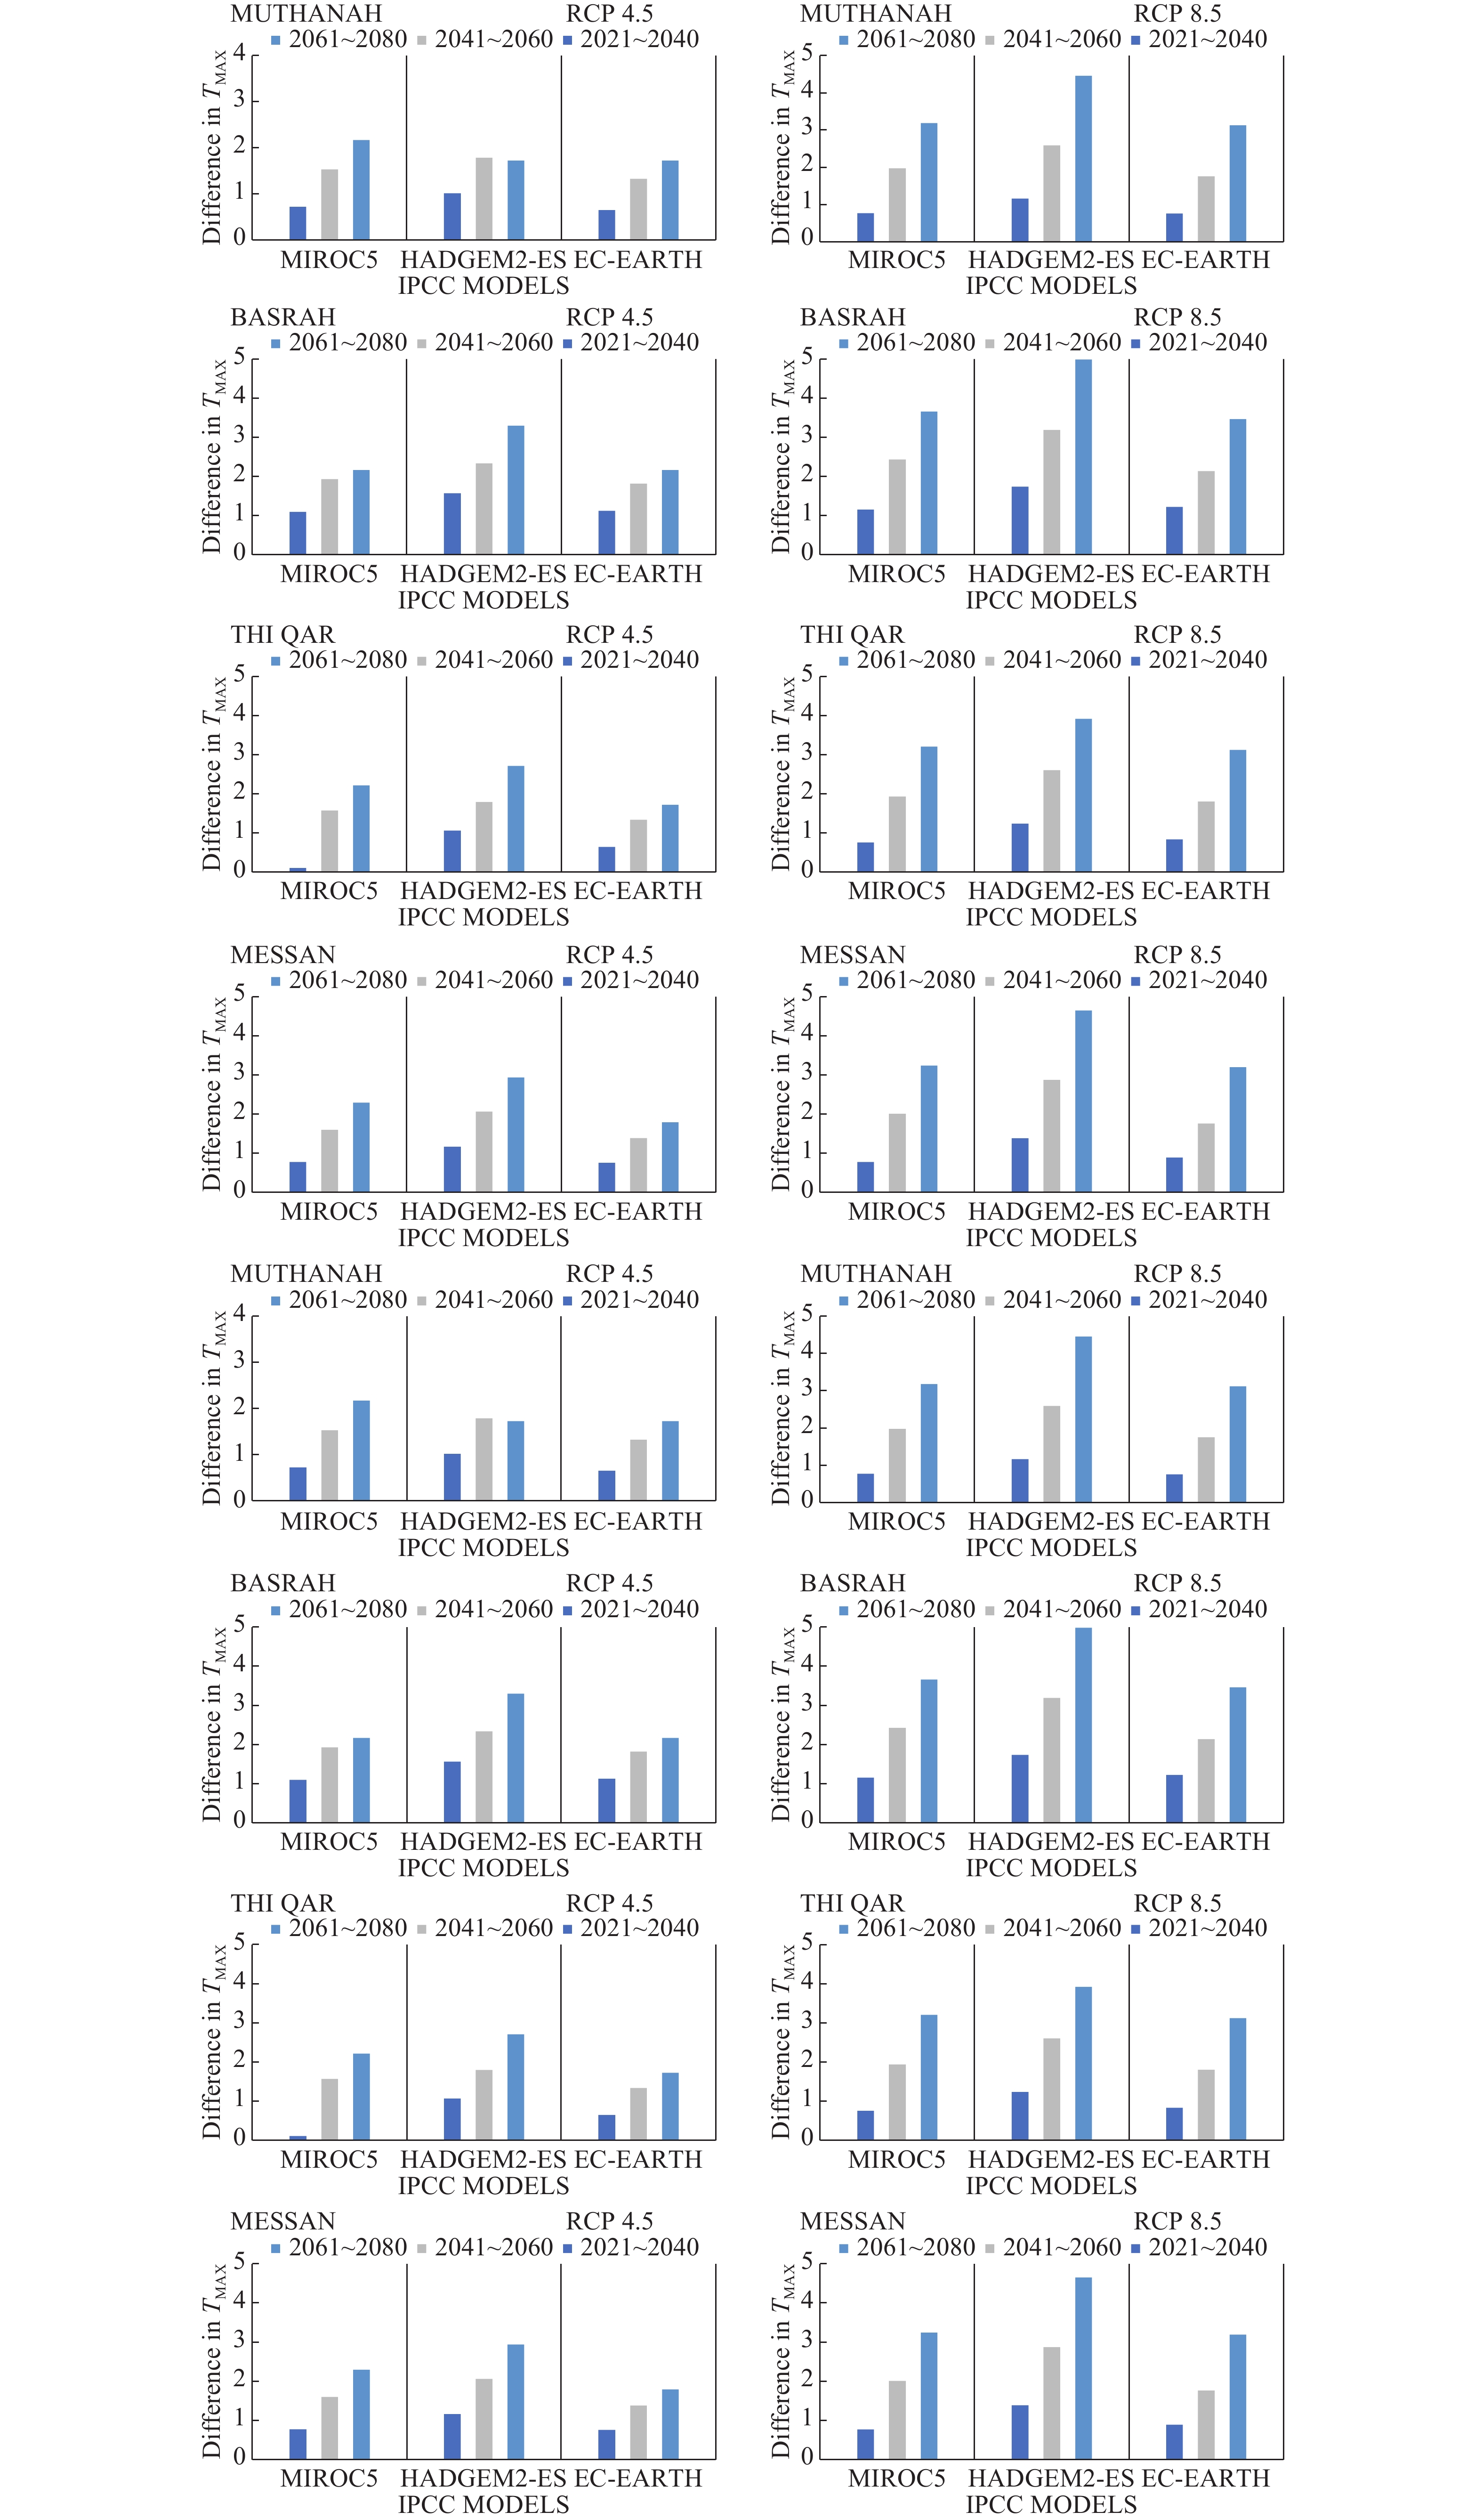
Figure 11. Annual maximum temperature difference between the simulated values for the three periods and the observed value

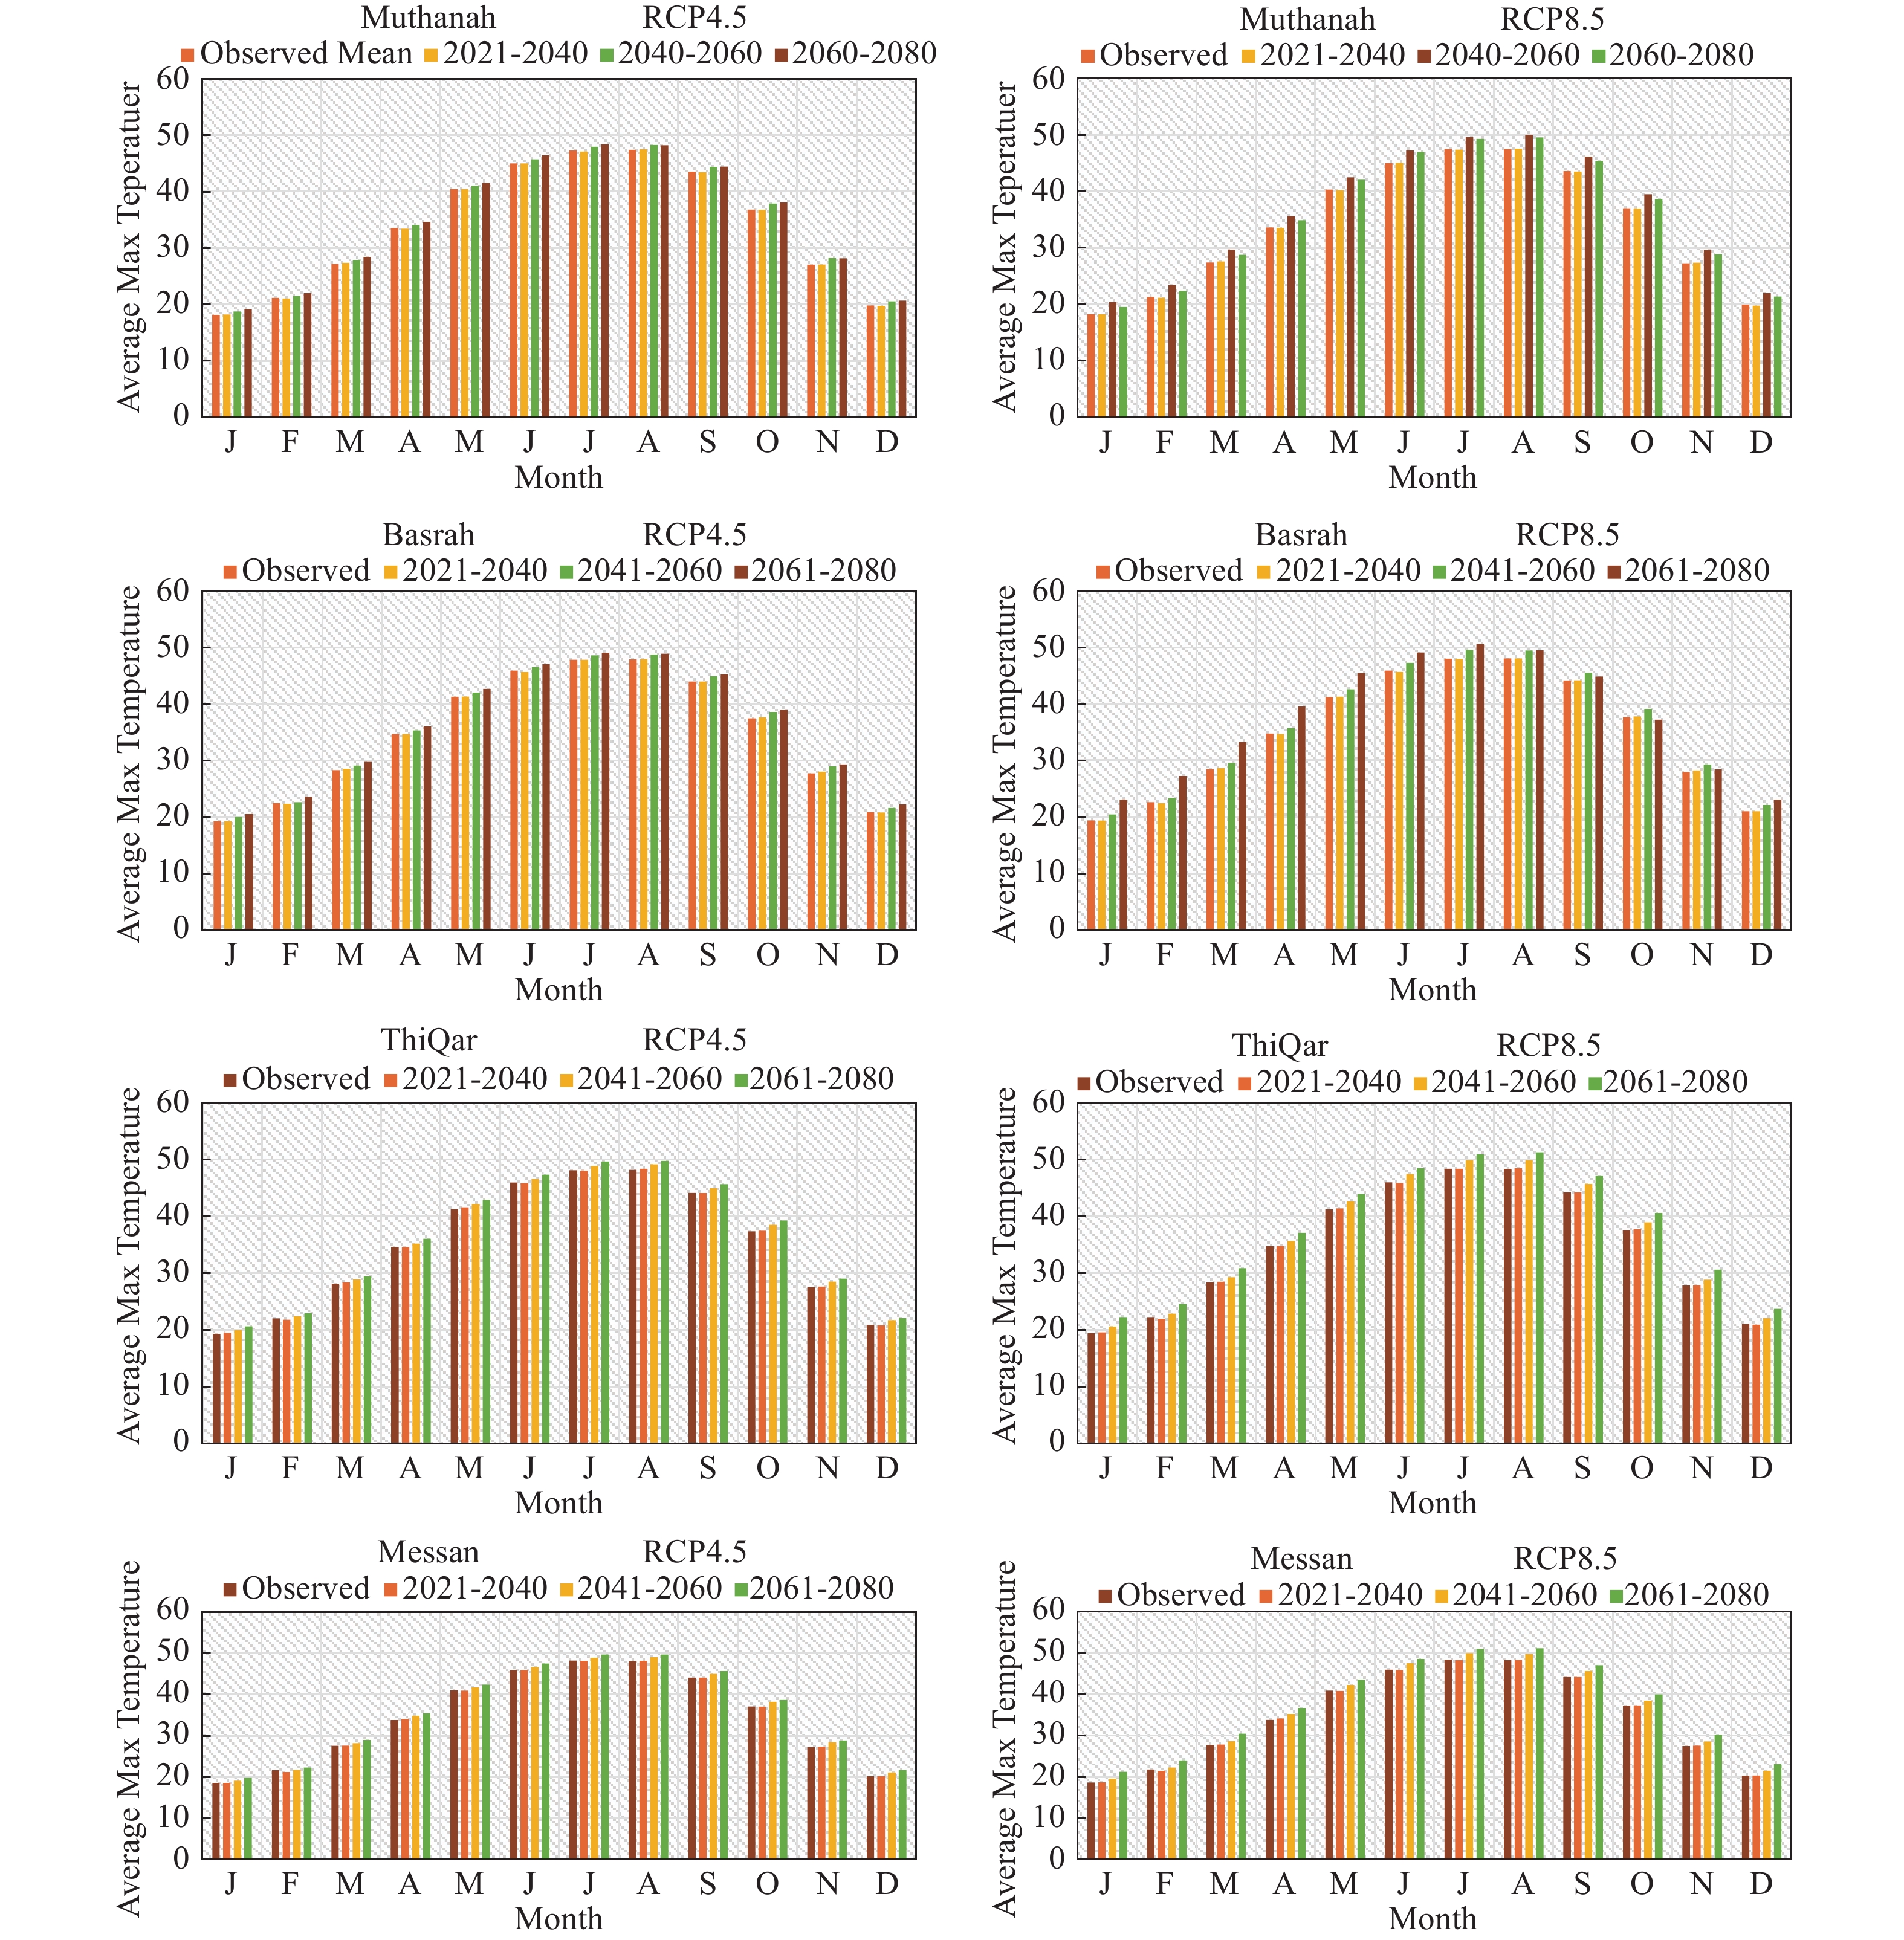
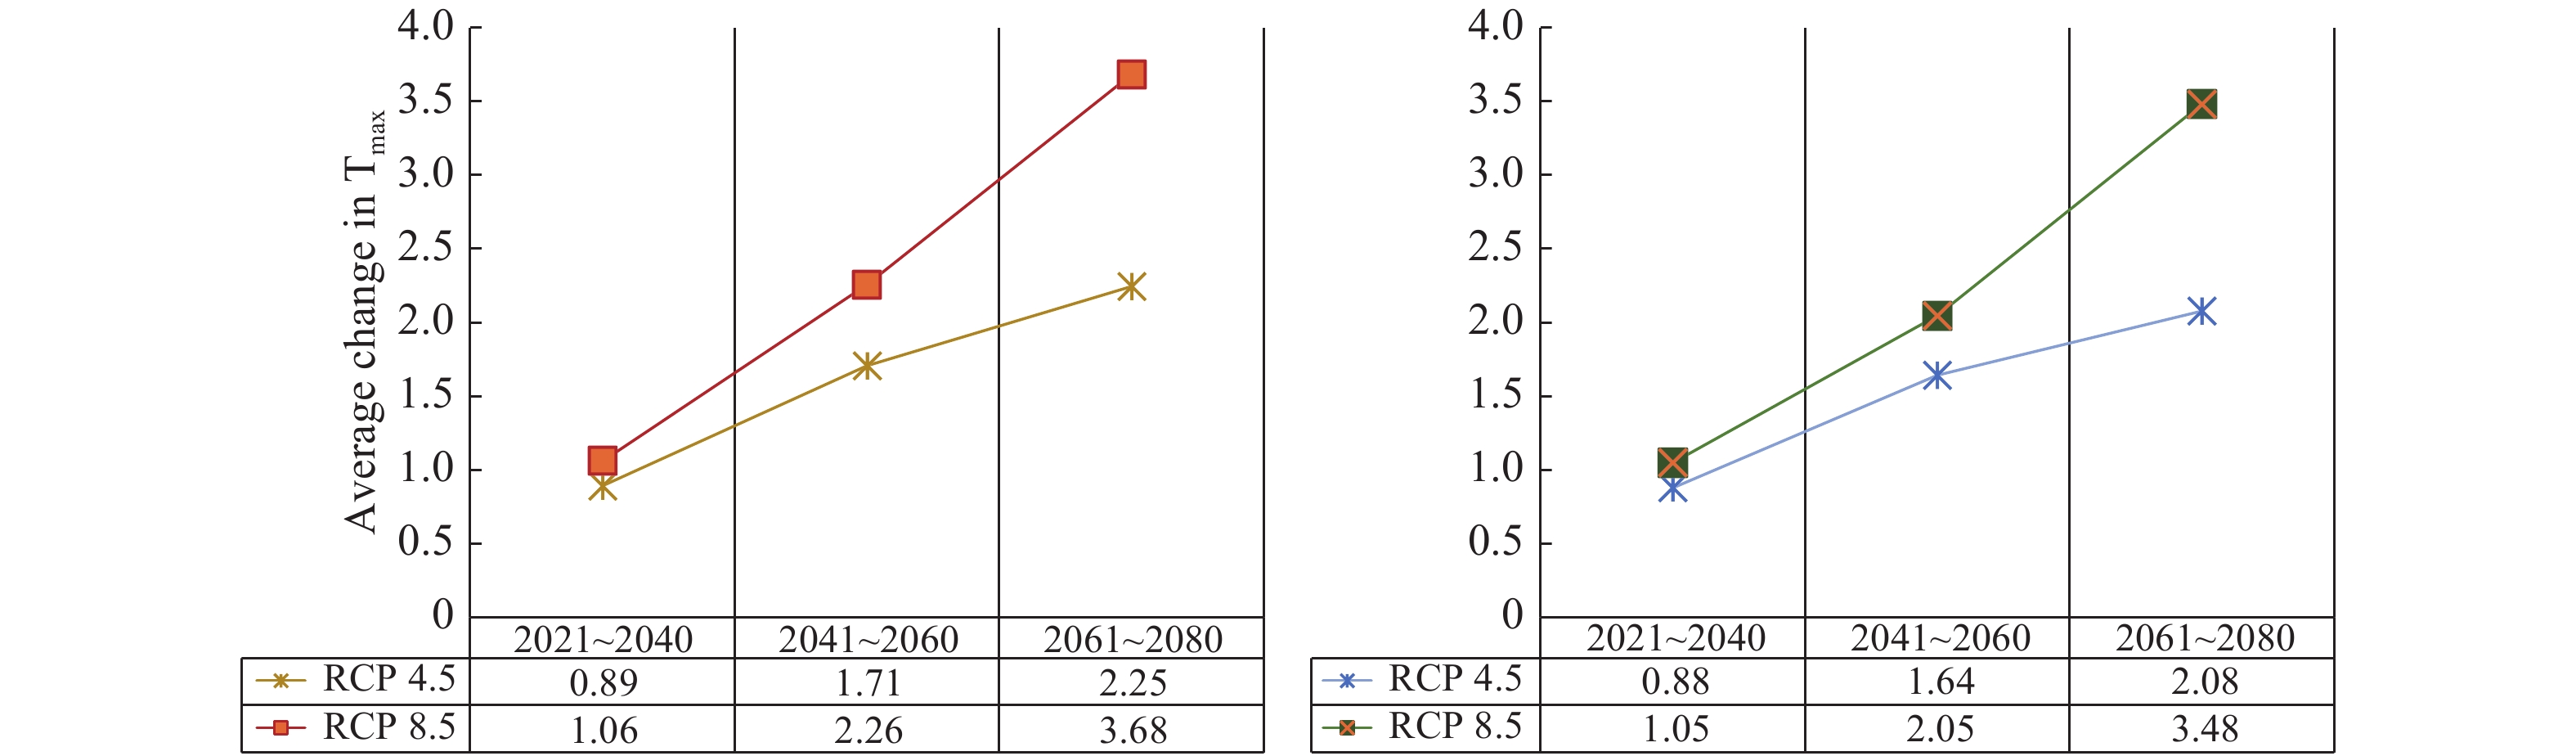
Figure 14. Alterations in the forecasted annual temperatures in the future of the four stations
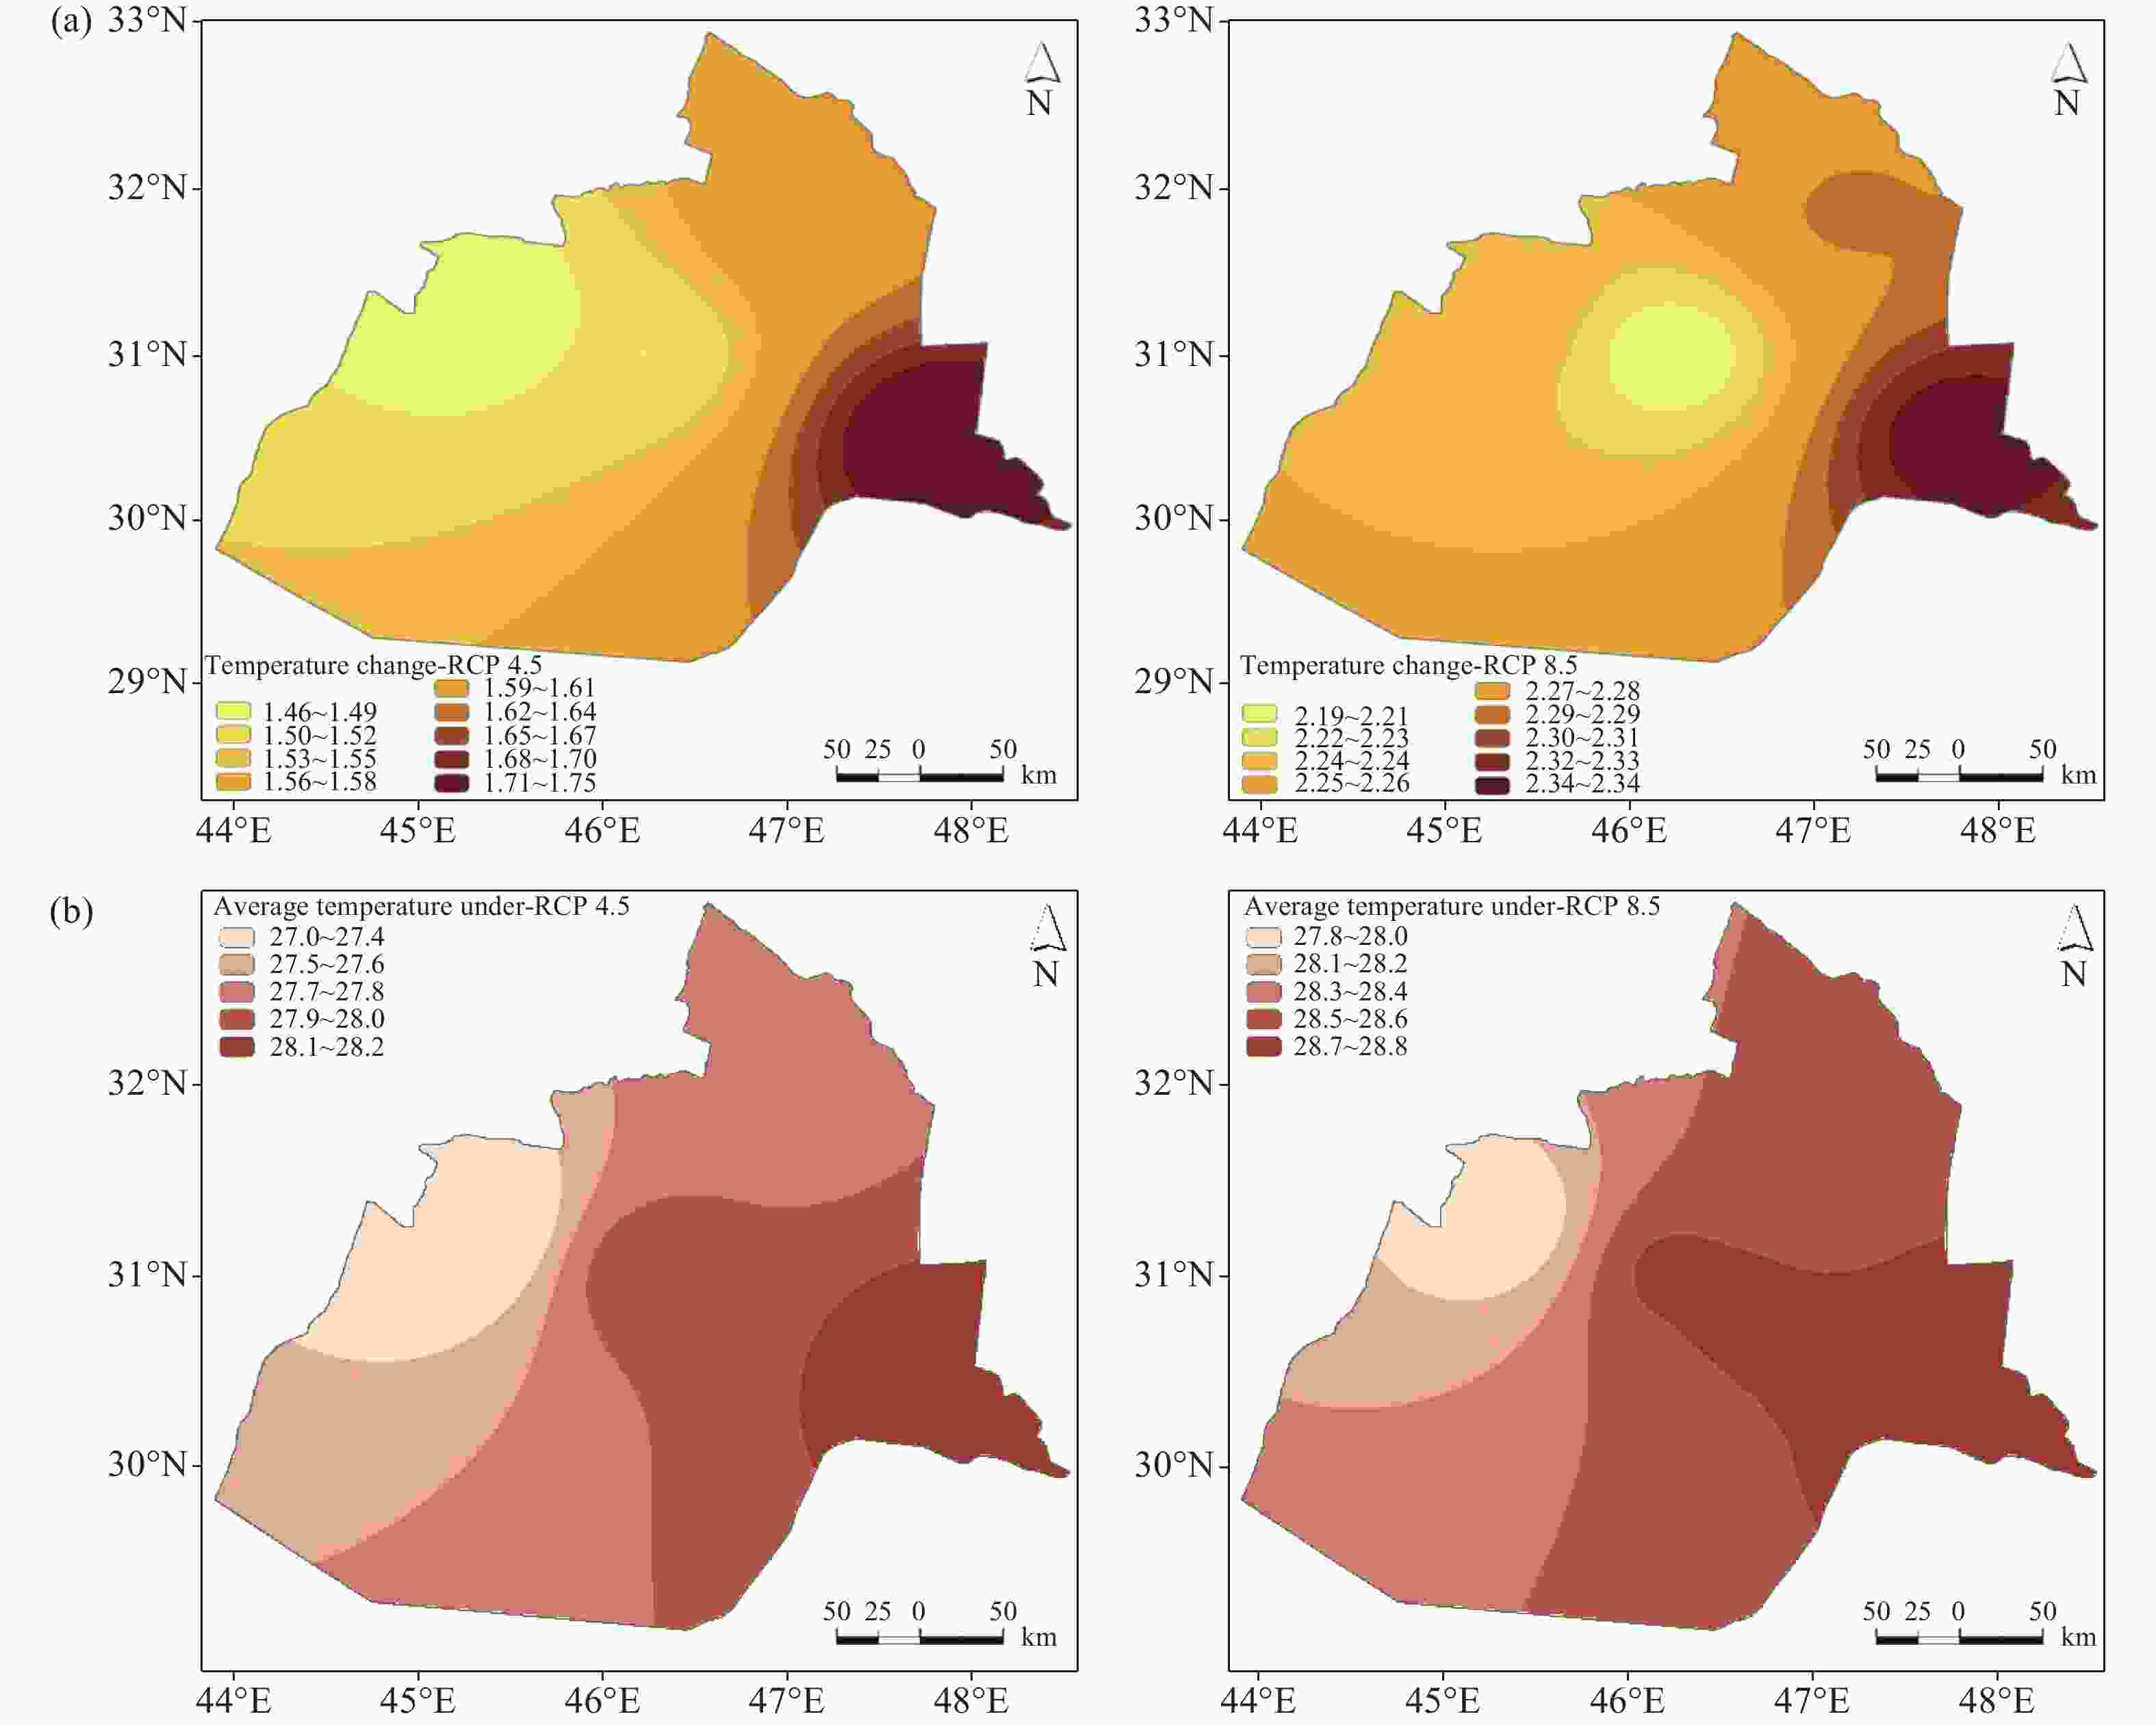
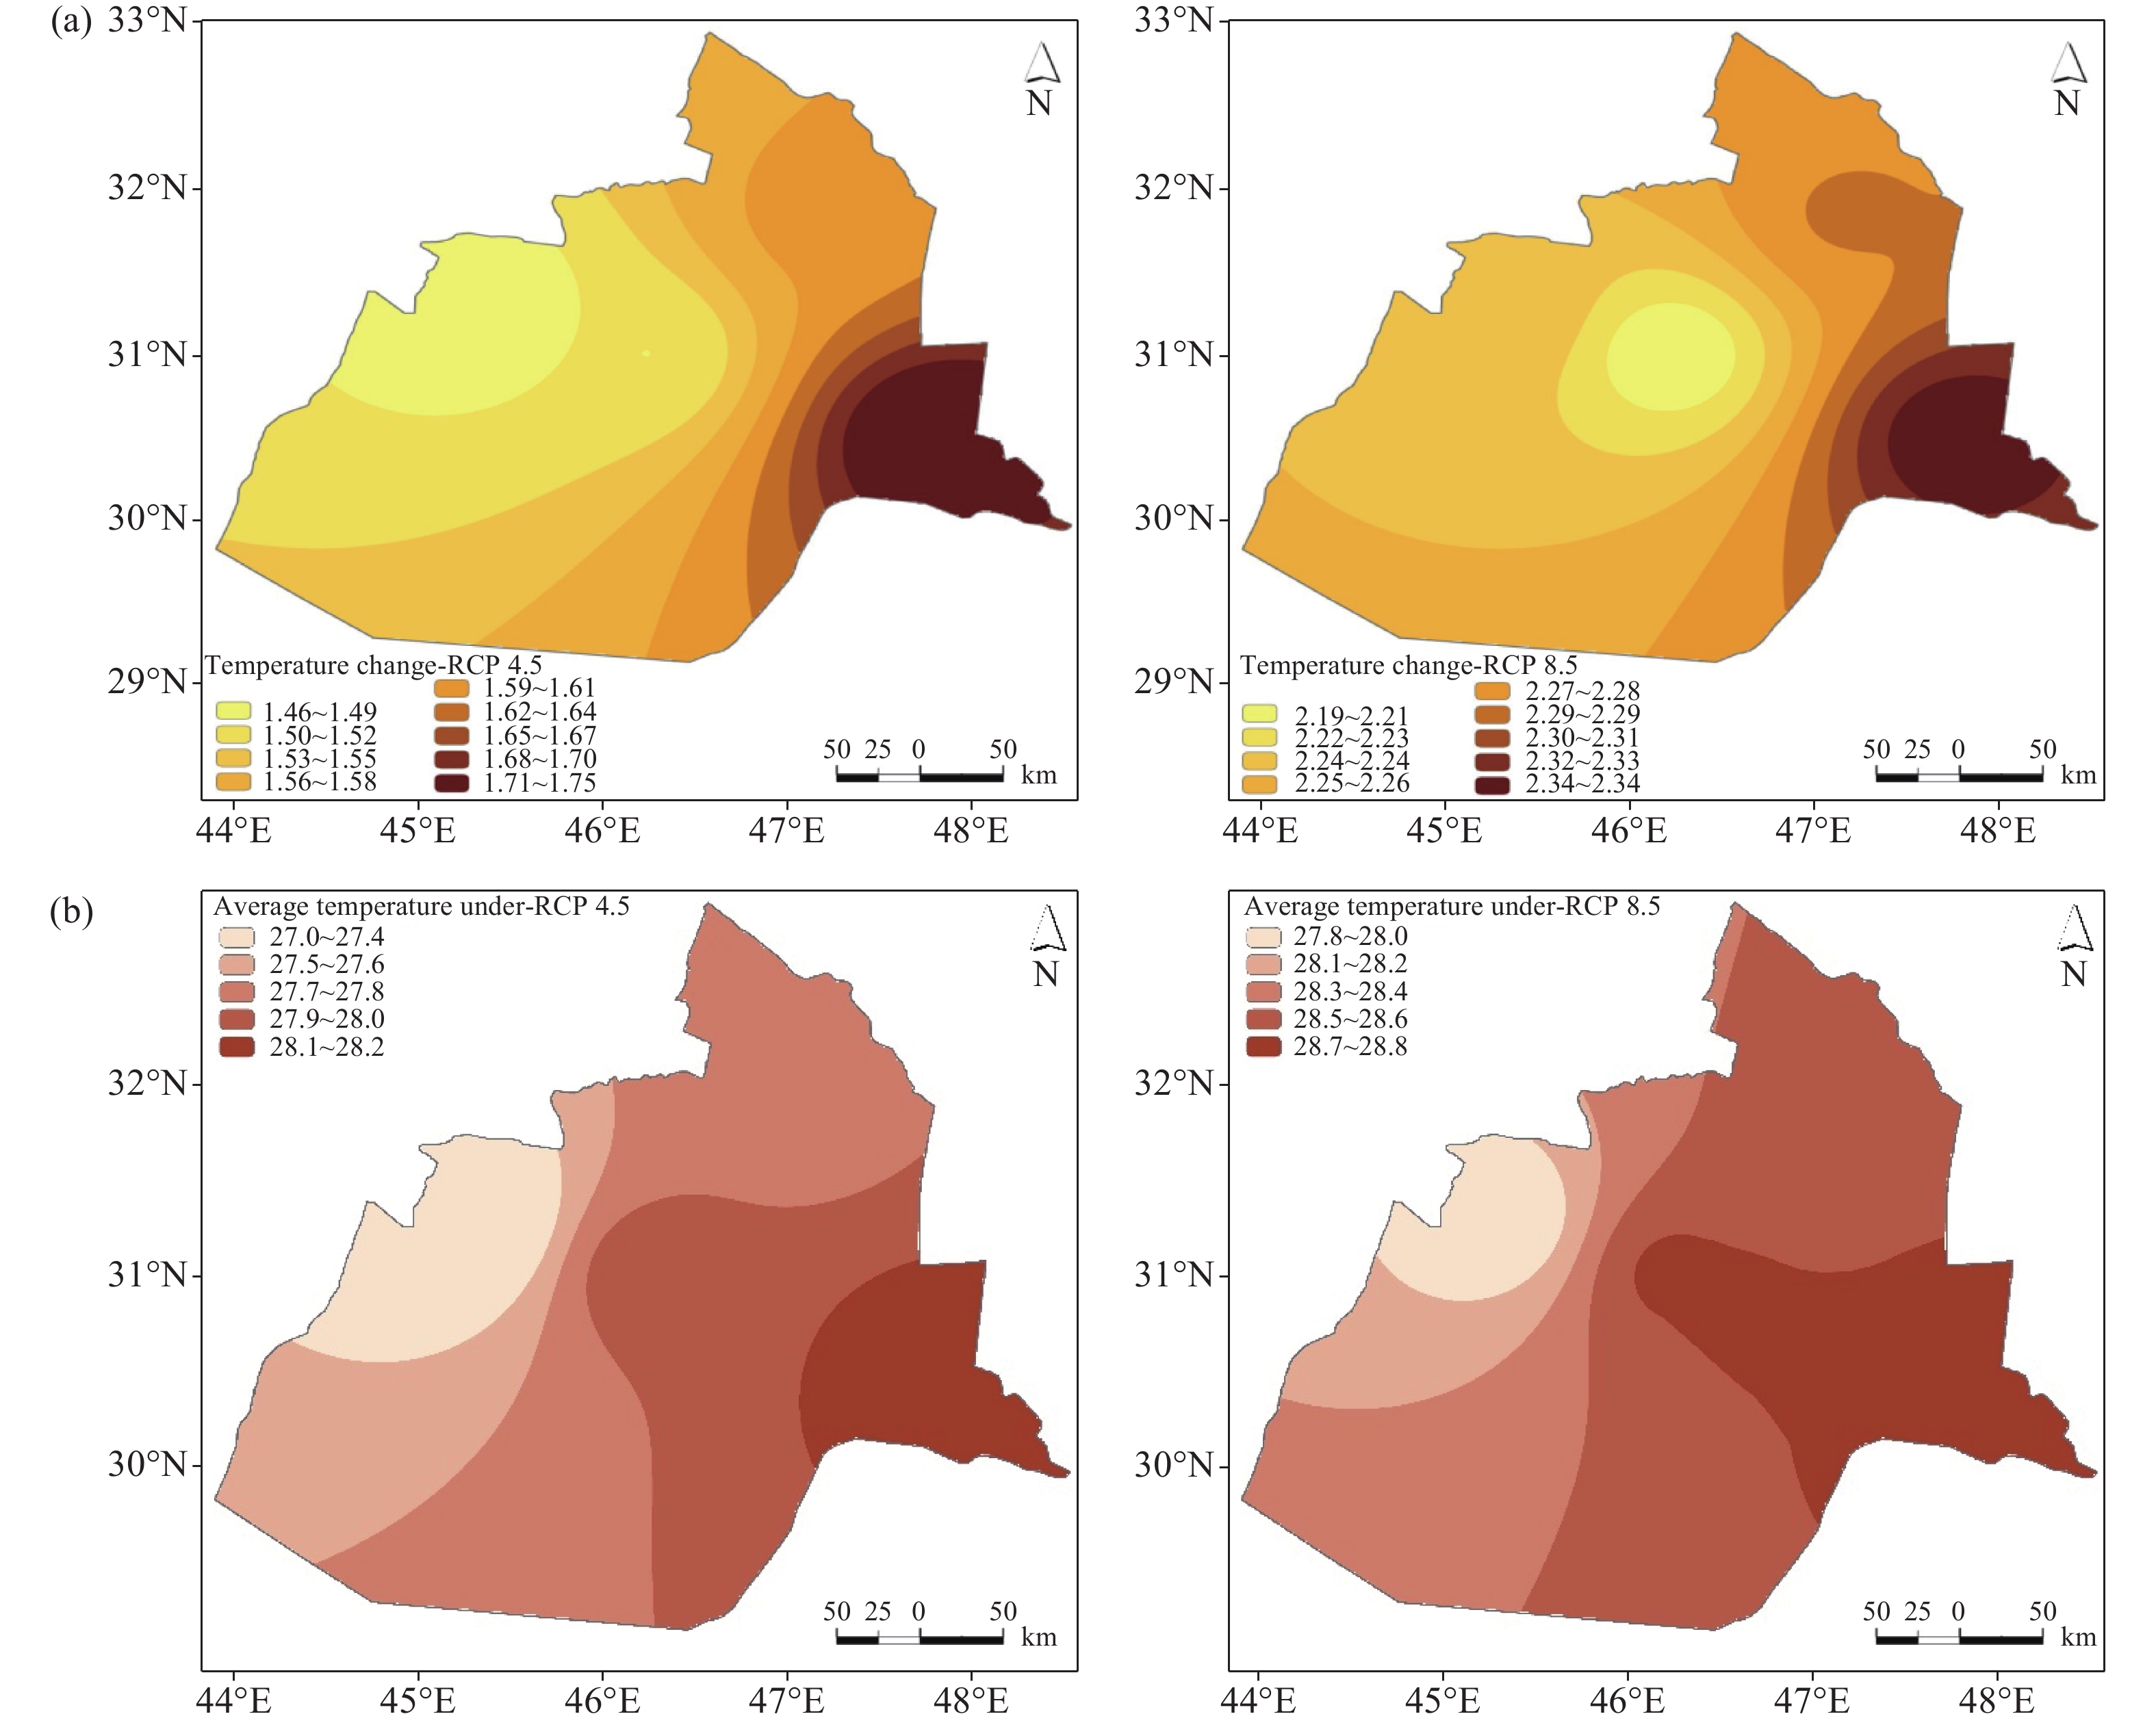
Figure 15. (a) The spatial distribution of projected temperature changes relative to the historical baseline (1990–2021), and (b) the projected average temperatures under RCP 4.5 and RCP 8.5 scenarios for the future (2021–2080)
Table 1. The selected stations
Station Longitude Latitude Elevation Basra 47.78 30.52 2.0 Thi Qar 46.23 31.02 5.0 Muthanah 45.27 31.27 11.0 Messan 47.17 31.83 9.0  下载: 导出CSV
Table 2. The selected GCMs from the Intergovernmental Panel on Climate Change (IPCC) Models
No. GCM Research center RCP MICRO5 Atmosphere and Ocean Research Institute (The University of Tokyo), National Institute for Environmental Studies, and Japan Agency for Marine-Earth Science and Technology, Japan 4.5, 8.5 HadGEM2-ES Met Office Hadley Center, United Kingdom 4.5, 8.5 EC-Earth European Community Earth-System Model 4.5, 8.5
下载: 导出CSV
Table 3. Assessment of wet and dry Seasons for the Four Stations
Season Wet/dry N K–S P value Assessment Messan Station DJF Wet 12 0.010 1.000 Perfect DJF Dry 12 0.058 1.000 Perfect MAM Wet 12 0.050 1.000 Perfect MAM Dry 12 0.265 0.341 Poor JJA Wet 12 0.000 1.000 Perfect JJA Dry 12 0.305 0.193 Poor SON Wet 12 0.092 1.000 Perfect SON Dry 12 0.083 1.000 Perfect Thi-Qar Station DJF Wet 12 0.037 1.000 Perfect DJF Dry 12 0.055 1.000 Perfect MAM Wet 12 0.025 1.000 Perfect MAM Dry 12 0.207 0.655 Good JJA Wet 12 0.130 0.984 Very good JJA Dry 12 0.435 0.017 Poor SON Wet 12 0.018 1.000 Perfect SON Dry 12 0.098 1.000 Perfect Basrah Station DJF Wet 12 0.032 1.000 Perfect DJF Dry 12 0.065 1.000 Perfect MAM Wet 12 0.045 1.000 Perfect MAM Dry 12 0.185 0.783 Very good JJA Wet 12 0.087 1.000 Perfect JJA Dry 12 0.566 0.001 Poor SON Wet 12 0.089 1.000 Perfect SON Dry 12 0.112 0.997 Very good Muthanah Station DJF Wet 12 0.062 1.000 Perfect DJF Dry 12 0.015 1.000 Perfect MAM Wet 12 0.162 0.897 Very good MAM Dry 12 0.297 0.218 Poor JJA Wet 12 0.174 0.842 Very good JJA Dry 12 0.261 0.359 Poor SON Wet 12 0.043 1.000 Perfect SON Dry 12 0.156 0.920 Very good
下载: 导出CSV
Table 4. K-S (Kolmogorov-Smirnov) Test for the distributions of daily rainfall for the four studied stations
Season N K–S P value Assessment Mesan Station J 12 0.065 1.000 Perfect F 12 0.130 0.984 Very good M 12 0.077 1.000 Perfect A 12 0.094 1.000 Perfect M 12 0.223 0.560 Good J 12 0.652 0.000 Poor J 12 No precipitation A 12 No precipitation S 12 1.000 0.000 Poor O 12 0.219 0.584 Good N 12 0.130 0.984 Very good D 12 0.204 0.673 Good Thi-Qar Station J 12 0.142 0.962 Very good F 12 0.124 0.990 Very good M 12 0.138 0.971 Very good A 12 0.135 0.976 Very good M 12 0.063 1.000 Perfect J 12 0.348 0.096 Poor J 12 No precipitation A 12 No precipitation S 12 0.478 0.006 Poor O 12 0.146 0.952 Very good N 12 0.134 0.978 Very good D 12 0.235 0.492 Good Basrah Station J 12 0.055 1.000 Perfect F 12 0.085 1.000 Perfect M 12 0.160 0.905 Very good A 12 0.043 1.000 Perfect M 12 0.059 1.000 Perfect J 12 0.653 0.000 Poor J 12 No precipitation A 12 No precipitation S 12 No precipitation O 12 0.368 0.067 Poor N 12 0.147 0.949 Very good D 12 0.070 1.000 Perfect Muthanah Station J 12 0.156 0.920 Very good F 12 0.075 1.000 Perfect M 12 0.104 0.999 Very good A 12 0.134 0.978 Very good M 12 0.055 1.000 Perfect J 12 0.304 0.196 Poor J 12 No precipitation A 12 No precipitation S 12 1.000 0.000 Poor O 12 0.154 0.927 Very good N 12 0.133 0.979 Very good D 12 0.056 1.000 Perfect
下载: 导出CSV
Table 5. Statistical analysis of the model calibration and validation over the observation period (1990–2020)
Station Climate variable R2 RMSE Muthanah Rainfall 0.9526 2.19823 Tmax 0.9994 0.286138 Tmin 0.9996 0.1904 Basrah Rainfall 0.9725 2.3078 Tmax 0.9994 0.2747 Tmin 0.9997 0.246813 Thi Qar Rainfall 0.9188 2.0364 Tmax 0.9995 0.2755 Tmin 0.9994 0.2243 Messan Rainfall 0.9537 2.7774 Tmax 0.9994 0.2747 Tmin 0.9992 0.2745
下载: 导出CSV
-
Adamo N, Al-Ansari N, Sissakian V, et al. 2022. Climate change: Droughts and increasing desertification in the Middle East, with special reference to Iraq. Engineering, 14(07): 235−273. DOI: 10.4236/eng.2022.147021. Agyakwah W, Lin YL. 2021. Generation and enhancement mechanisms for extreme orographic rainfall associated with Typhoon Morakot (2009) over the Central Mountain Range of Taiwan. Atmospheric Research, 247: 105160. DOI: 10.1016/j.atmosres.2020.105160. Al-Maliki LA, Al-Mamoori SK, Al-Ansari N, et al. 2022. Climate change impact on water resources of Iraq (a review of literature). IOP Conference Series, Earth and Environmental Science, 1120(1): 012025. DOI: 10.1088/1755-1315/1120/1/012025. Al-Bahrani HS, Al-Rammahi AH, Al-Mamoori SK, et al. 2022. Groundwater detection and classification using remote sensing and GIS in Najaf, Iraq. Groundwater for Sustainable Development, 19: 100838. DOI: 10.1016/j.gsd.2022.100838. Al-Maliki LA, Al-Mamoori SK, Jasim IA, et al. 2022. Perception of climate change effects on water resources: Iraqi undergraduates as a case study. Arabian Journal of Geosciences, 15(6): 503. DOI: 10.1007/s12517-022-09695-y. Al-Ansari N, Saleh S, Abdullah T, et al. 2021. Quality of surface water and groundwater in Iraq. Earth Sciences and Geotechnical Engineering, 11(2): 161−199. DOI: 10.47260/jesge/1124. Attogouinon A, Lawin AE, Deliège JF. 2020. Evaluation of general circulation models over the upper Ouémé River Basin in the Republic of Benin. Hydrology, 7(1): 11. DOI: 10.3390/hydrology7010011. Change IPOC. 2007. Climate change 2007: The physical science basis. Agenda, 6(07): 333. Daoudy M, Al-Saidi M, Al Manji A, et al. 2024. Troubled waters in conflict and a changing climate: Transboundary Basins across the Middle East and North Africa. Carnegie Endowment for International Peace. Demory ME, Berthou S, Sørland SL, et al. 2020. Can high-resolution GCMs reach the level of information provided by 12–50 km CORDEX RCMs in terms of daily precipitation distribution? Geoscientific Model Development Discussions, 1-33. Francis D, Fonseca R. 2024. Recent and projected changes in climate patterns in the Middle East and North Africa (MENA) region. Scientific Reports, 14(1): 10279. DOI: 10.1038/s41598-024-60976-w. Han Z, Shi Y, Wu J, et al. 2019. Combined dynamical and statistical downscaling for high-resolution projections of multiple climate variables in the Beijing–Tianjin–Hebei Region of China. Journal of Applied Meteorology and Climatology, 58(11): 2387-2403. Hashim BM, Sultan MA, Al Maliki A, et al. 2020. Estimation of greenhouse gases emitted from energy industry (Oil refining and electricity generation) in Iraq using IPCC methodology. Atmosphere, 11(6): 662. DOI: 10.3390/atmos11060662. Hassan WH, Nile BK, Kadhim ZK, et al. 2023. Trends, forecasting and adaptation strategies of climate change in the middle and west regions of Iraq. SN Applied Sciences, 5(12): 312. DOI: 10.1007/s42452-023-05544-z. Jahangir MH, Haghighi P, Danehkar S. 2022. Downscaling climate parameters in Fars province, using models of the fifth report and RCP scenarios. Ecological Informatics, 68: 101558. DOI: 10.1016/j.ecoinf.2022.101558. Jasim IA, Al-Maliki LA, Al-Mamoori SK. 2022. Water corridors management: A case study from Iraq. International Journal of River Basin Management, 1-11. DOI: 10.1080/15715124.2022.2079662. Khalaf RM, Hussein HH, Hassan WH, et al. 2022. Projections of precipitation and temperature in Southern Iraq using a LARS-WG Stochastic weather generator. Physics and Chemistry of the Earth, Parts A/B/C, 128: 103224. Knutti R, Furrer R, Tebaldi C, et al. 2010. Challenges in combining projections from multiple climate models. Journal of Climate, 23(10): 2739−2758. DOI: 10.1175/2009JCLI3361.1. Lun Y, Liu L, Cheng L, et al. 2021. Assessment of GCMs simulation performance for precipitation and temperature from CMIP5 to CMIP6 over the Tibetan Plateau. International Journal of Climatology, 41(7): 3994−4018. DOI: 10.1002/joc.7055. McSweeney CF, Jones RG, Lee RW. et al. 2015. Selecting CMIP5 GCMs for downscaling over multiple regions. Clim Dyn, 44: 3237–3260. DOI: 10.1007/s00382-014-2418-8 Mohammad OI, Laheab A, Al-Maliki. 2014. Evaluation of suitability of drainage water of Al-Hussainia sector (Kut-Iraq) for irrigation. Wasit Journal of Engineering Sciences, 2(1): 30−45. DOI: 10.31185/ejuow.Vol2.Iss1.22. Mohammed ZM, Hassan WH. 2022. Climate change and the projection of future temperature and precipitation in southern Iraq using a LARS-WG model. Modeling Earth Systems and Environment, 8(3): 4205−4218. DOI: 10.1007/s40808-022-01358-x. Namdar R, Karami E, Keshavarz M. 2021. Climate change and vulnerability: The case of MENA countries. ISPRS International Journal of Geo-Information, 10(11): 794. DOI: 10.3390/ijgi10110794. Nolan P, Flanagan J. 2020. High-resolution climate projections for Ireland–a multi-model ensemble approach. Environmental Protection Agency, 978−991. DOI: 10.13140/RG.2.2.28360.14084. Portoghese I, Vurro M, López A. 2015. Assessing the impacts of climate change on water resources: Experiences from the Mediterranean Region. Qiu Y, Feng J, Yan Z, et al. 2022. High-resolution dynamical downscaling for regional climate projection in Central Asia based on bias-corrected multiple GCMs. Climate Dynamics, 58(3): 777−791. Smirnov O, Lahav G, Orbell J, et al. 2023. Climate change, drought, and potential environmental migration flows under different policy scenarios. International Migration Review, 57(1): 36−67. DOI: 10.1177/01979183221079850. Tebaldi C, Knutti R. 2007. The use of the multi-model ensemble in probabilistic climate projections. Philosophical Transactions of the Royal Society A: Mathematical, Physical and Engineering Sciences, 365(1857): 2053-2075. DOI: 10.1098/rsta.2007.2076. Walton DB, Berg N, Pierce D, et al. 2020. Understanding differences in California Climate Projections produced by dynamical and statistical downscaling. Journal of Geophysical Research: Atmospheres, 125. Wang JL, Moore JC, Zhao L, et al. 2022. Regional dynamical and statistical downscaling temperature, humidity and wind speed for the Beijing region under stratospheric aerosol injection geoengineering. Earth System Dynamics, 13(4): 1625-1640. Wilcke RAI, Bärring L. 2016. Selecting regional climate scenarios for impact modelling studies. Environmental Modelling & Software, 78: 191−201. DOI: 10.1016/j.envsoft.2016.01.002. Wu J, Han Z, Li R, et al. 2020. Changes of extreme climate events and related risk exposures in Huang‐Huai‐Hai river basin under 1. 5–2°C global warming targets based on high resolution combined dynamical and statistical downscaling dataset. International Journal of Climatology, 41: 1383−1401. Yildiz S, Islam HMT, Rashid T, et al. 2024. Exploring climate change effects on drought patterns in Bangladesh using Bias-Corrected CMIP6 GCMs. Earth Systems and Environment, 8(1): 21−43. DOI: 10.1007/s41748-023-00362-0. -


 点击查看大图
计量
- 文章访问数: 625
- HTML全文浏览量: 153
- PDF下载量: 31
- 被引次数: 0


