 E-mail alert
 Rss
Rss



Predicting and managing seawater intrusion using a hybrid machine learning–reinforcement learning framework: The Mnasra coastal aquifer, Northwestern Morocco
-
Abstract: Coastal aquifers are essential freshwater sources for irrigated agriculture in semi-arid regions, but they are increasingly threatened by seawater intrusion driven by intensive pumping and climate-related stressors. This study develops a preliminary hybrid machine learning–reinforcement learning (ML–RL) framework to explore seawater-intrusion management scenarios in the Mnasra coastal aquifer, northwestern Morocco. The Seawater Intrusion Index (SWI), defined as the seawater fraction, was analytically derived from chloride concentration. Ridge Regression was used as a static surrogate estimator of this chloride-derived SWI using 13 hydrochemical variables measured in 36 wells from a single hydrochemical sampling campaign. Because chloride is directly involved in the analytical definition of SWI, predictive performance was interpreted cautiously. Model robustness was assessed using chloride-ablation analysis, leave-one-out cross-validation, repeated 5-fold cross-validation, and feature-contribution diagnostics. The full model including Cl− reproduced the chloride-derived SWI with high cross-validated performance, whereas the chloride-excluded model provided a more conservative assessment of the broader hydrochemical signature. In the second stage, a Deep Q-Network (DQN) agent explored well-specific pumping-reduction actions (0%, 19%, 30%, and 40%) within a simplified synthetic surrogate environment initialized from the observed hydrochemical state. The DQN component was designed to reduce SWI toward the agricultural protection threshold of 0.01 while preserving usable groundwater supply. Because the dataset contains no observed temporal pumping-response trajectories, the RL outputs are interpreted as synthetic scenario-screening results rather than field-validated dynamic predictions. The management scenarios indicate partial mitigation of salinization: SWI was reduced in moderate- and high-intrusion wells while a substantial fraction of water supply was preserved, but several wells remained above the 0.01 threshold after management. The proposed framework should therefore be viewed as a proof-of-concept decision-support approach that complements, rather than replaces, geological characterization and process-based density-dependent groundwater models such as SEAWAT or FEFLOW.
-
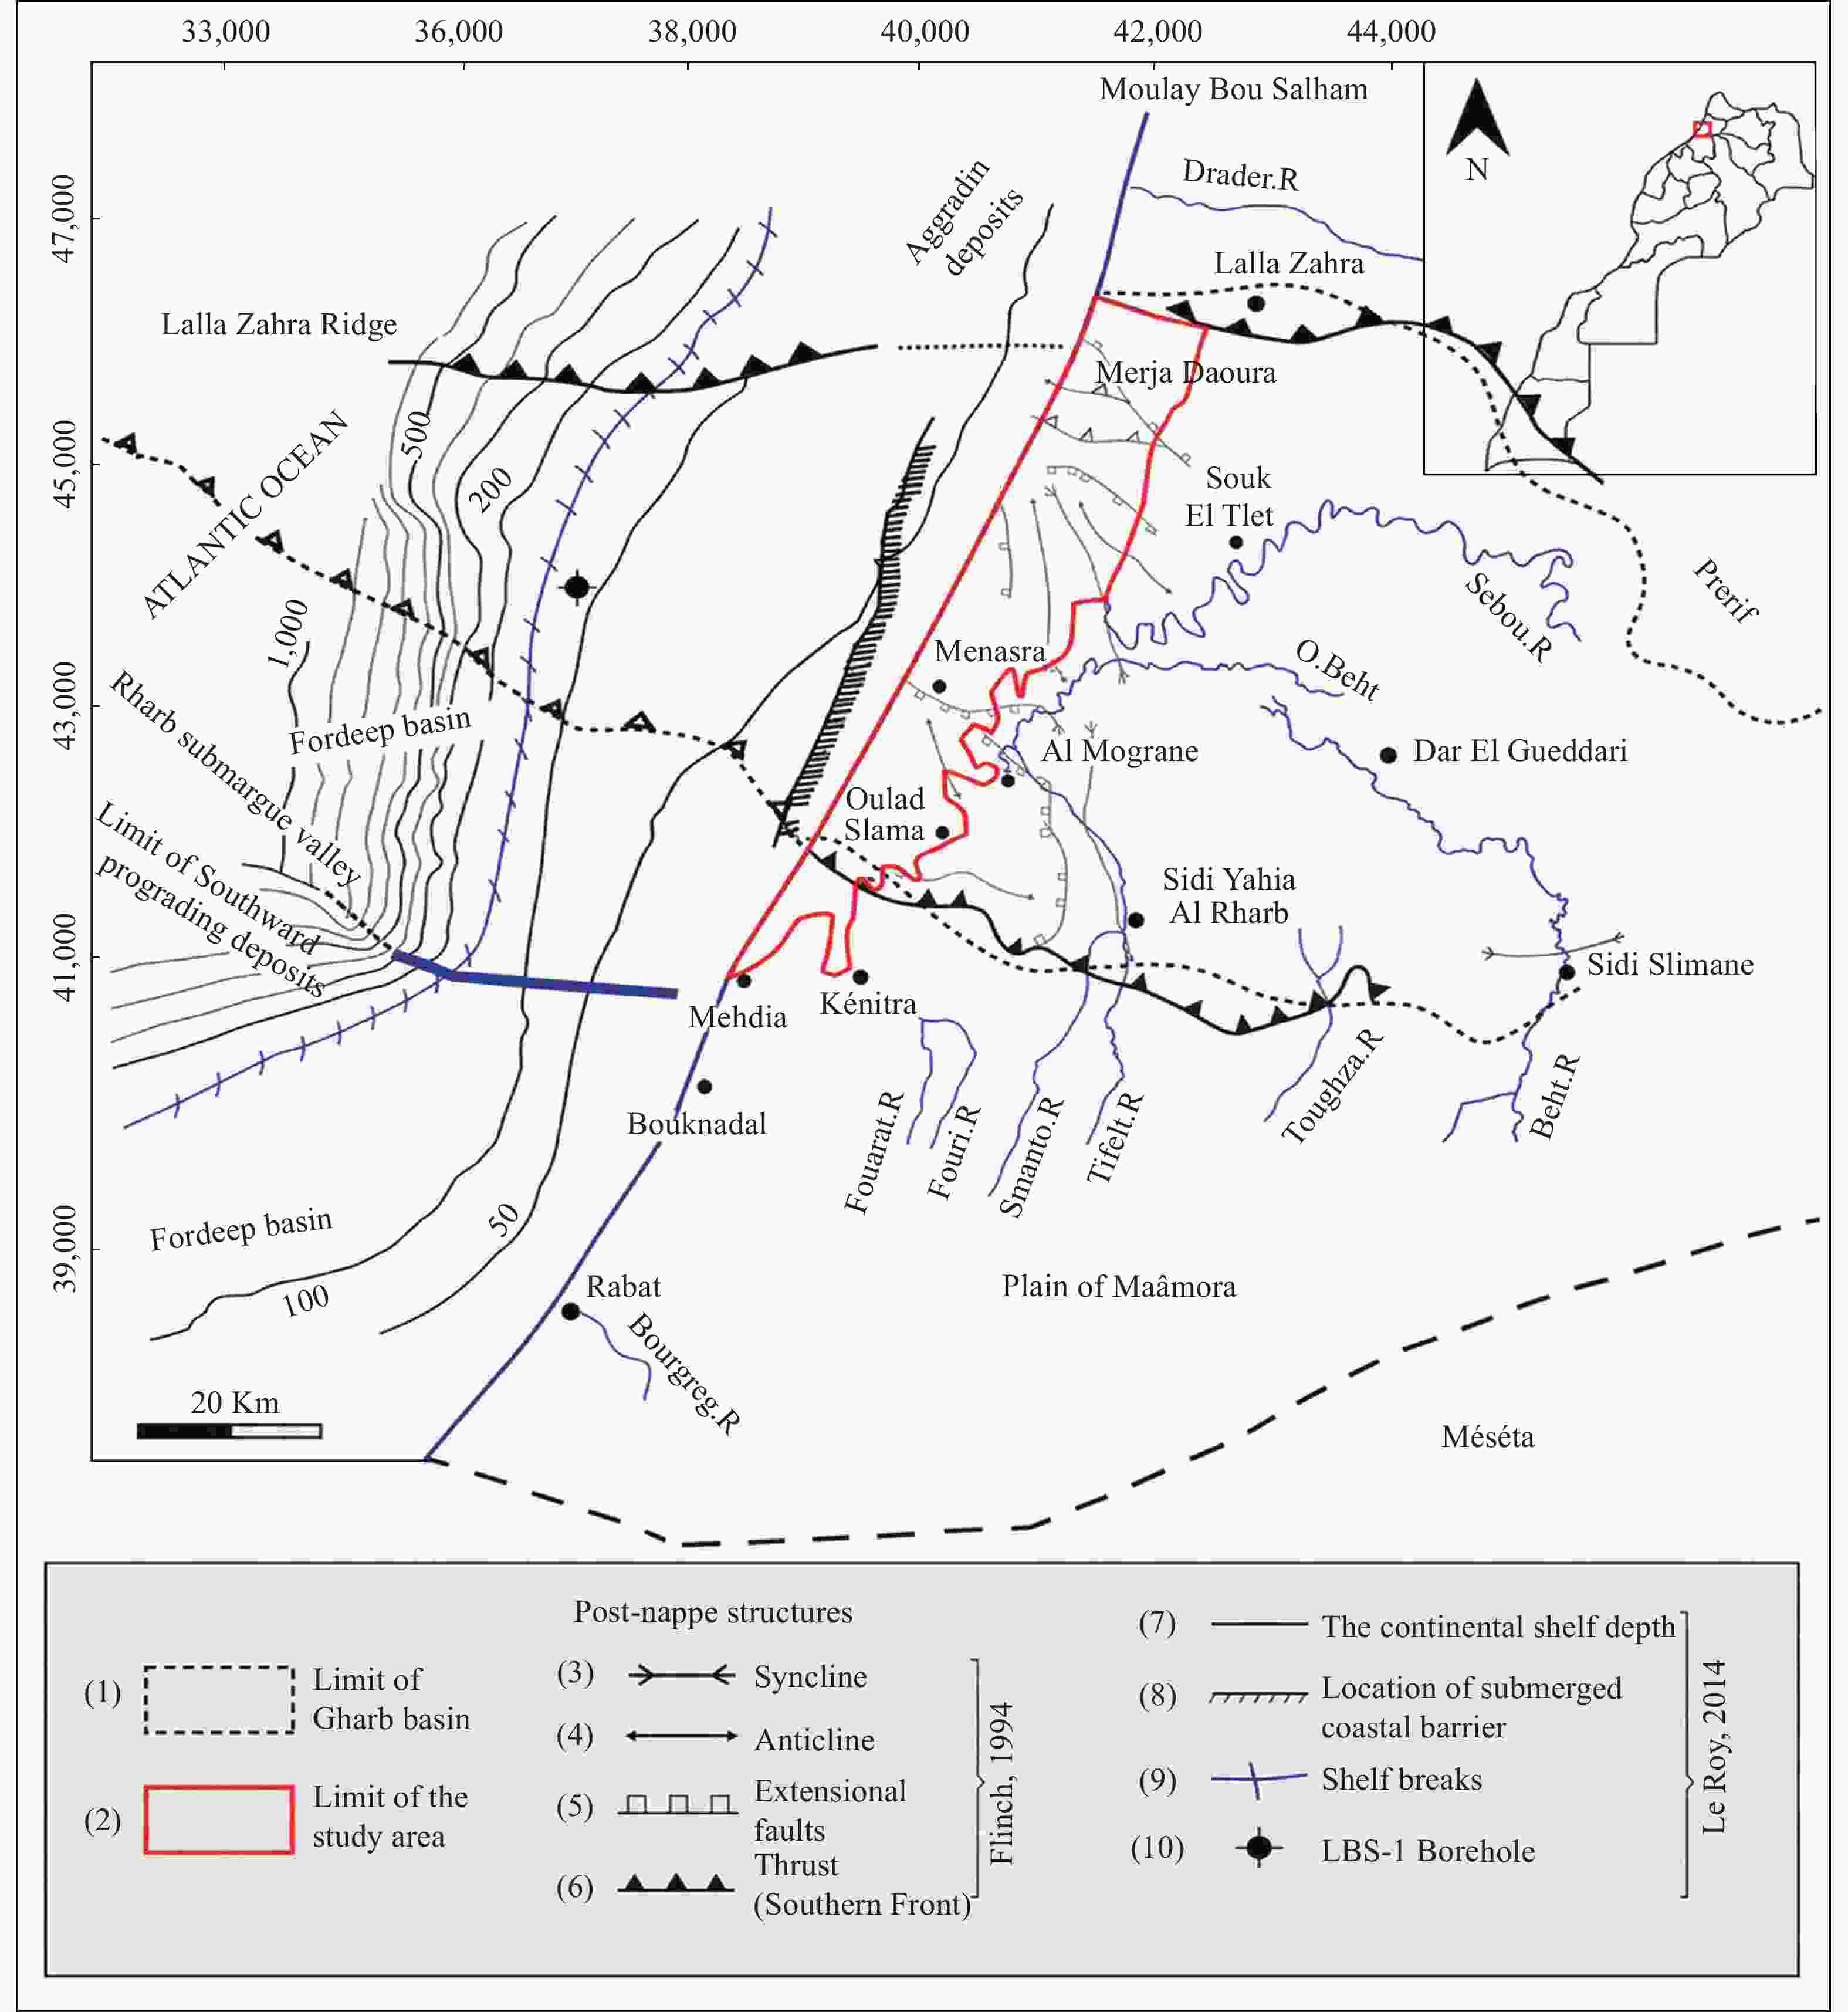
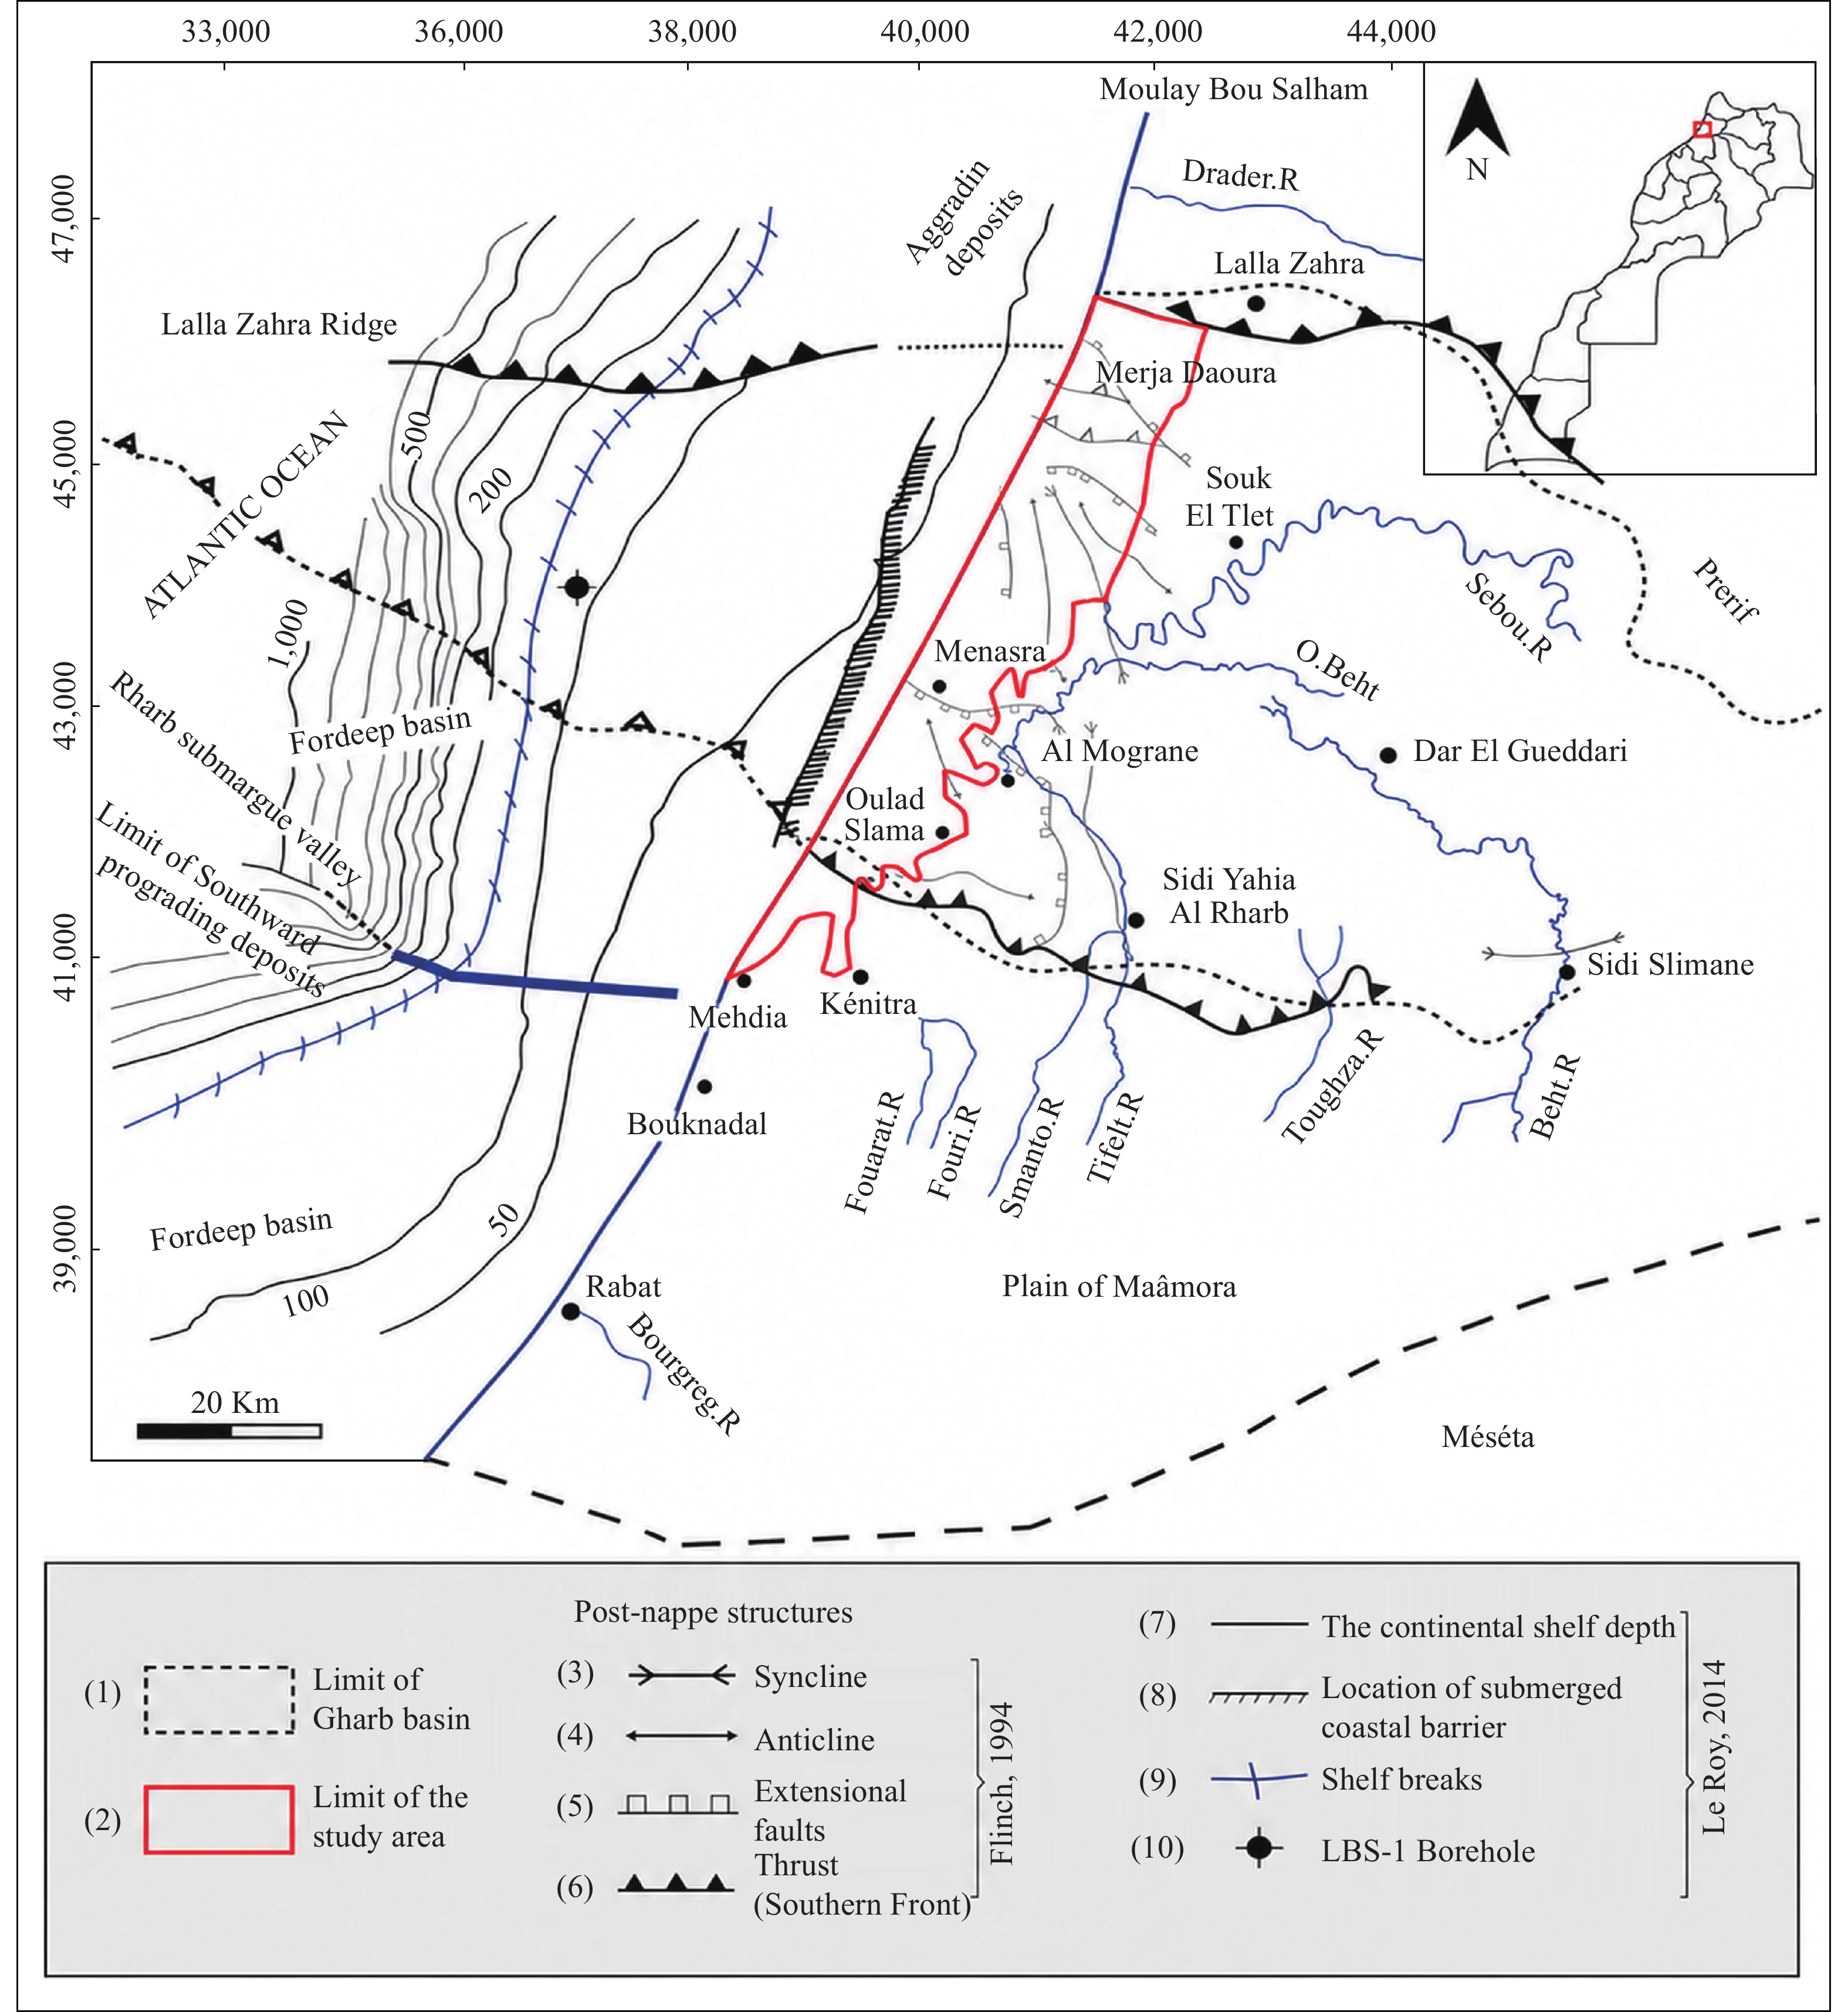
Figure 1. Structural and offshore deltaic component of Oulad Slama-Al Mograne area (compiled after Flinch, 1994 and Le Roy et al., 2014).
Notes: 1. Limit of Gharb basin. 2. Limit of the study area. 3. Syncline. 4. Anticline. 5. Extensional faults. 6. Thrust (Southern Front). 7. The continental shelf depth. 8. Location of submerged coastal barrier. 9. Shelf breaks. 10. LBS-1 Borehole (El Bouhaddioui et al., 2016)
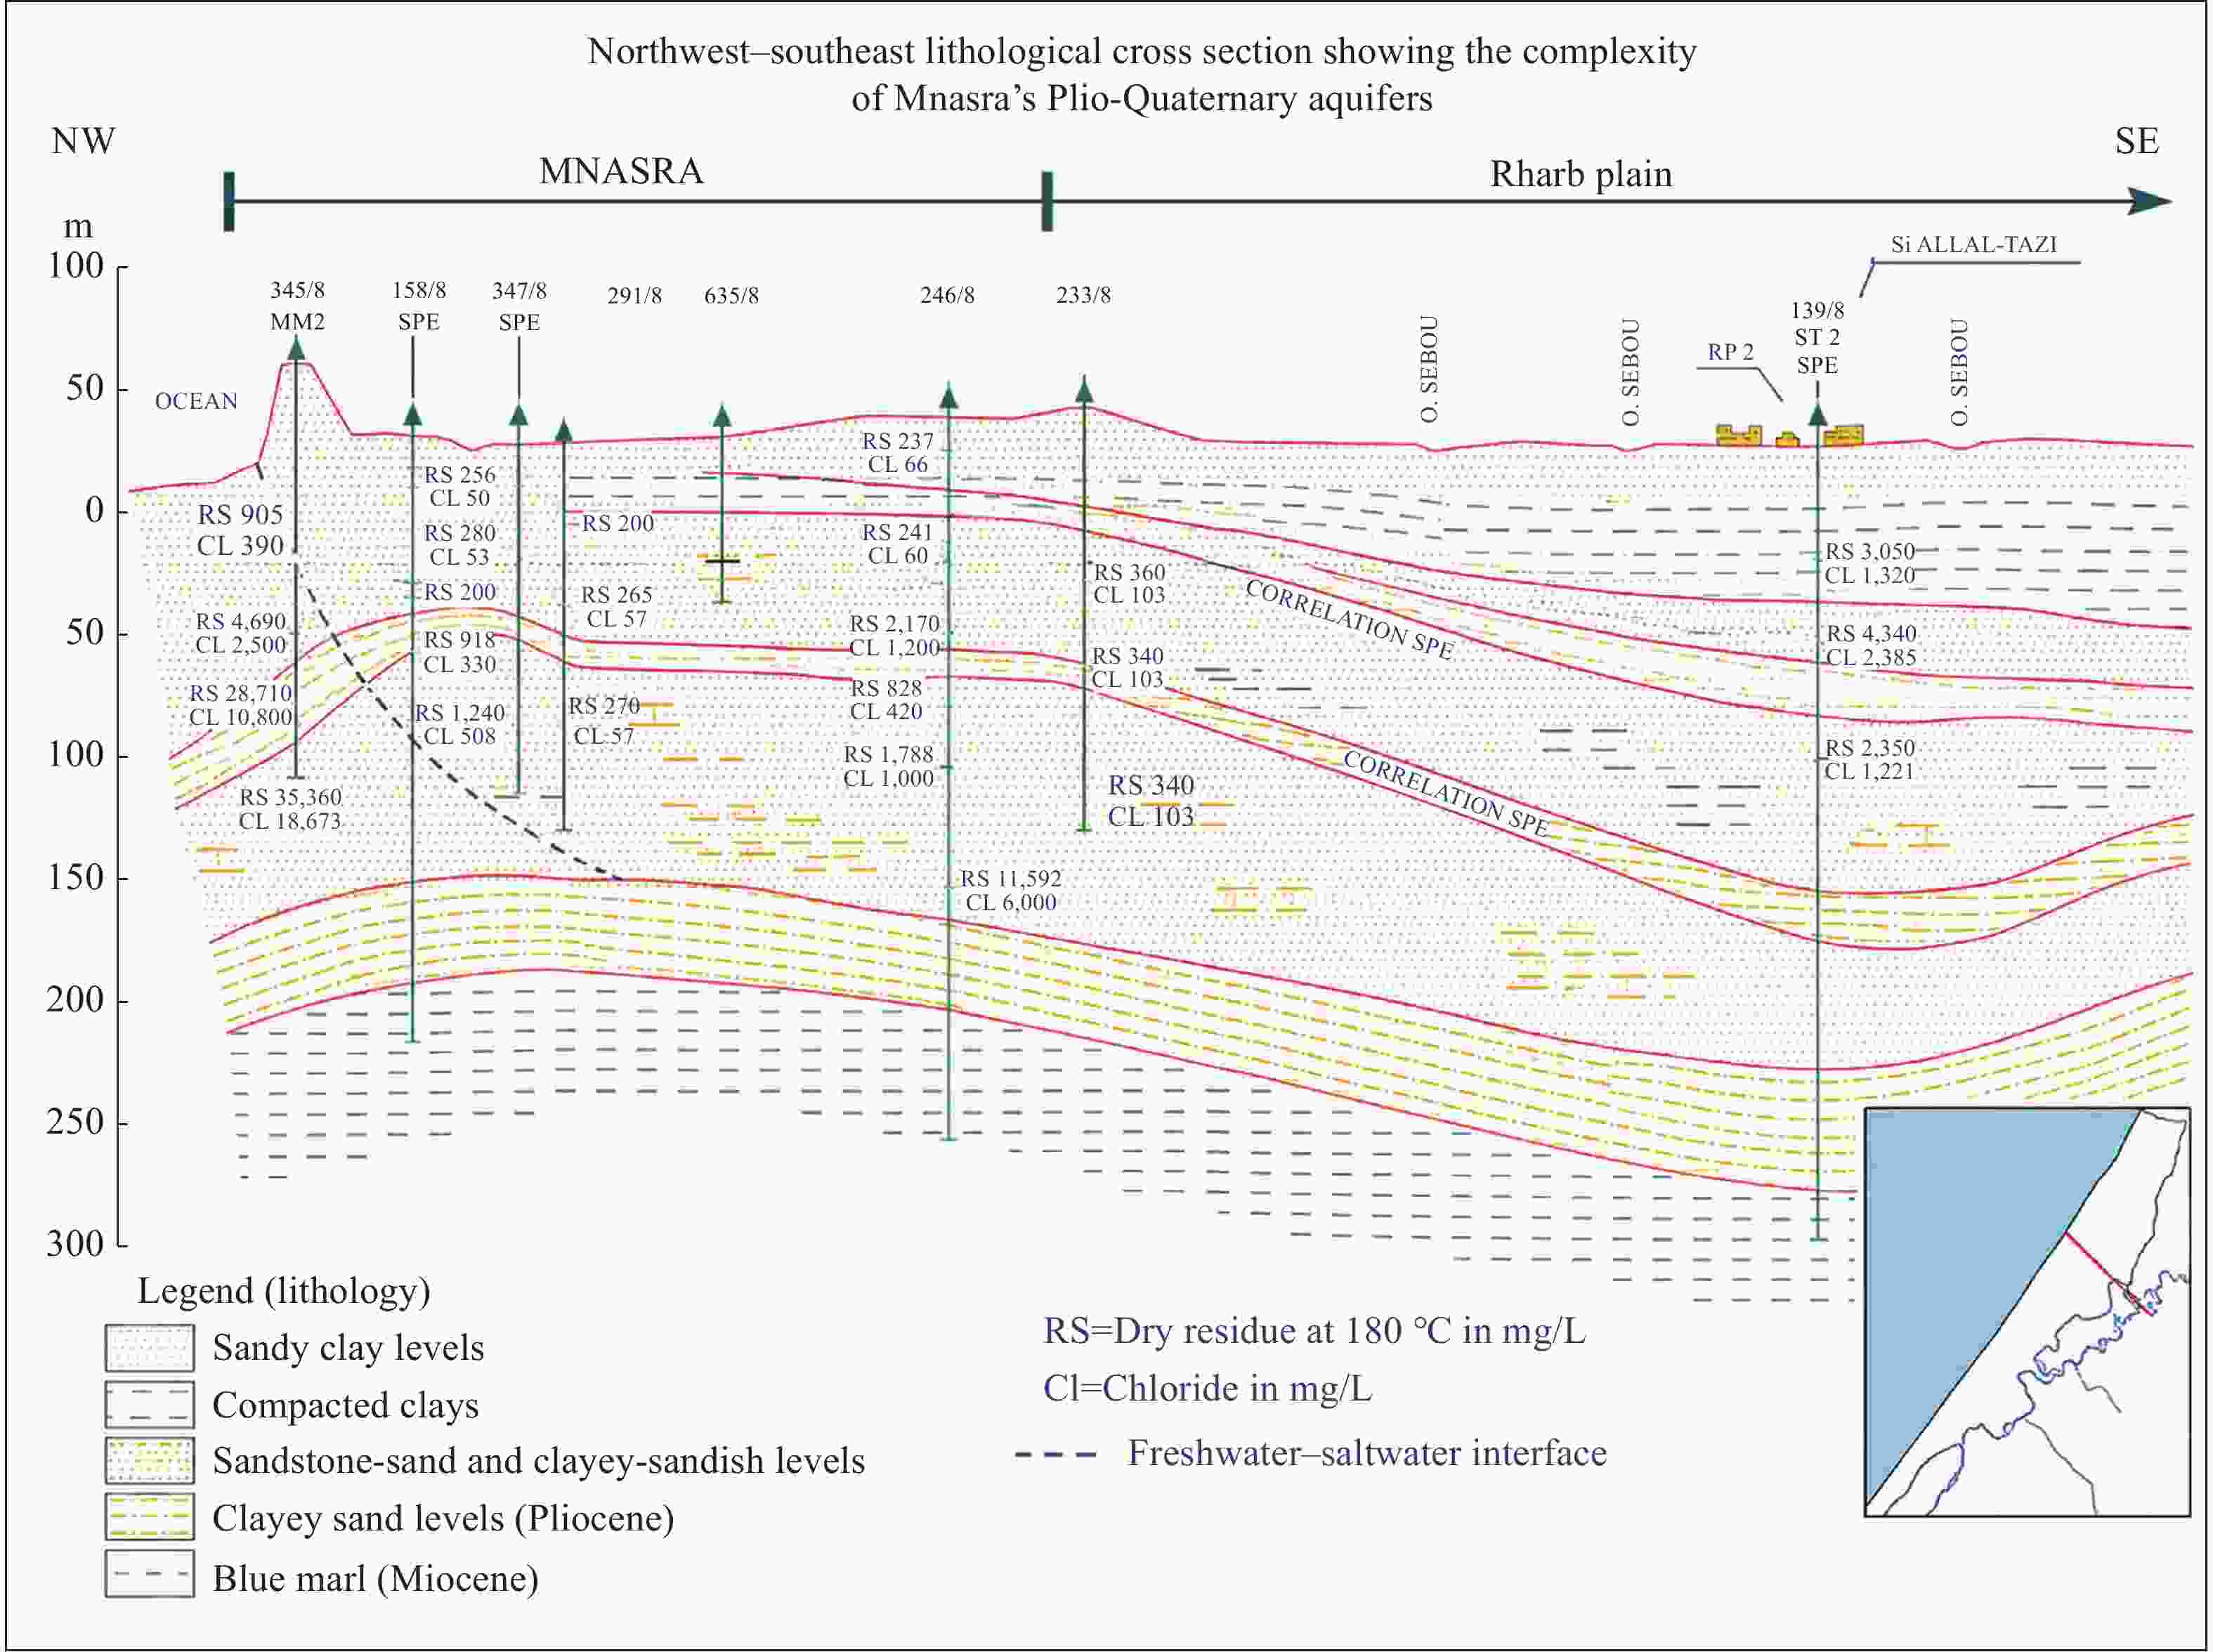
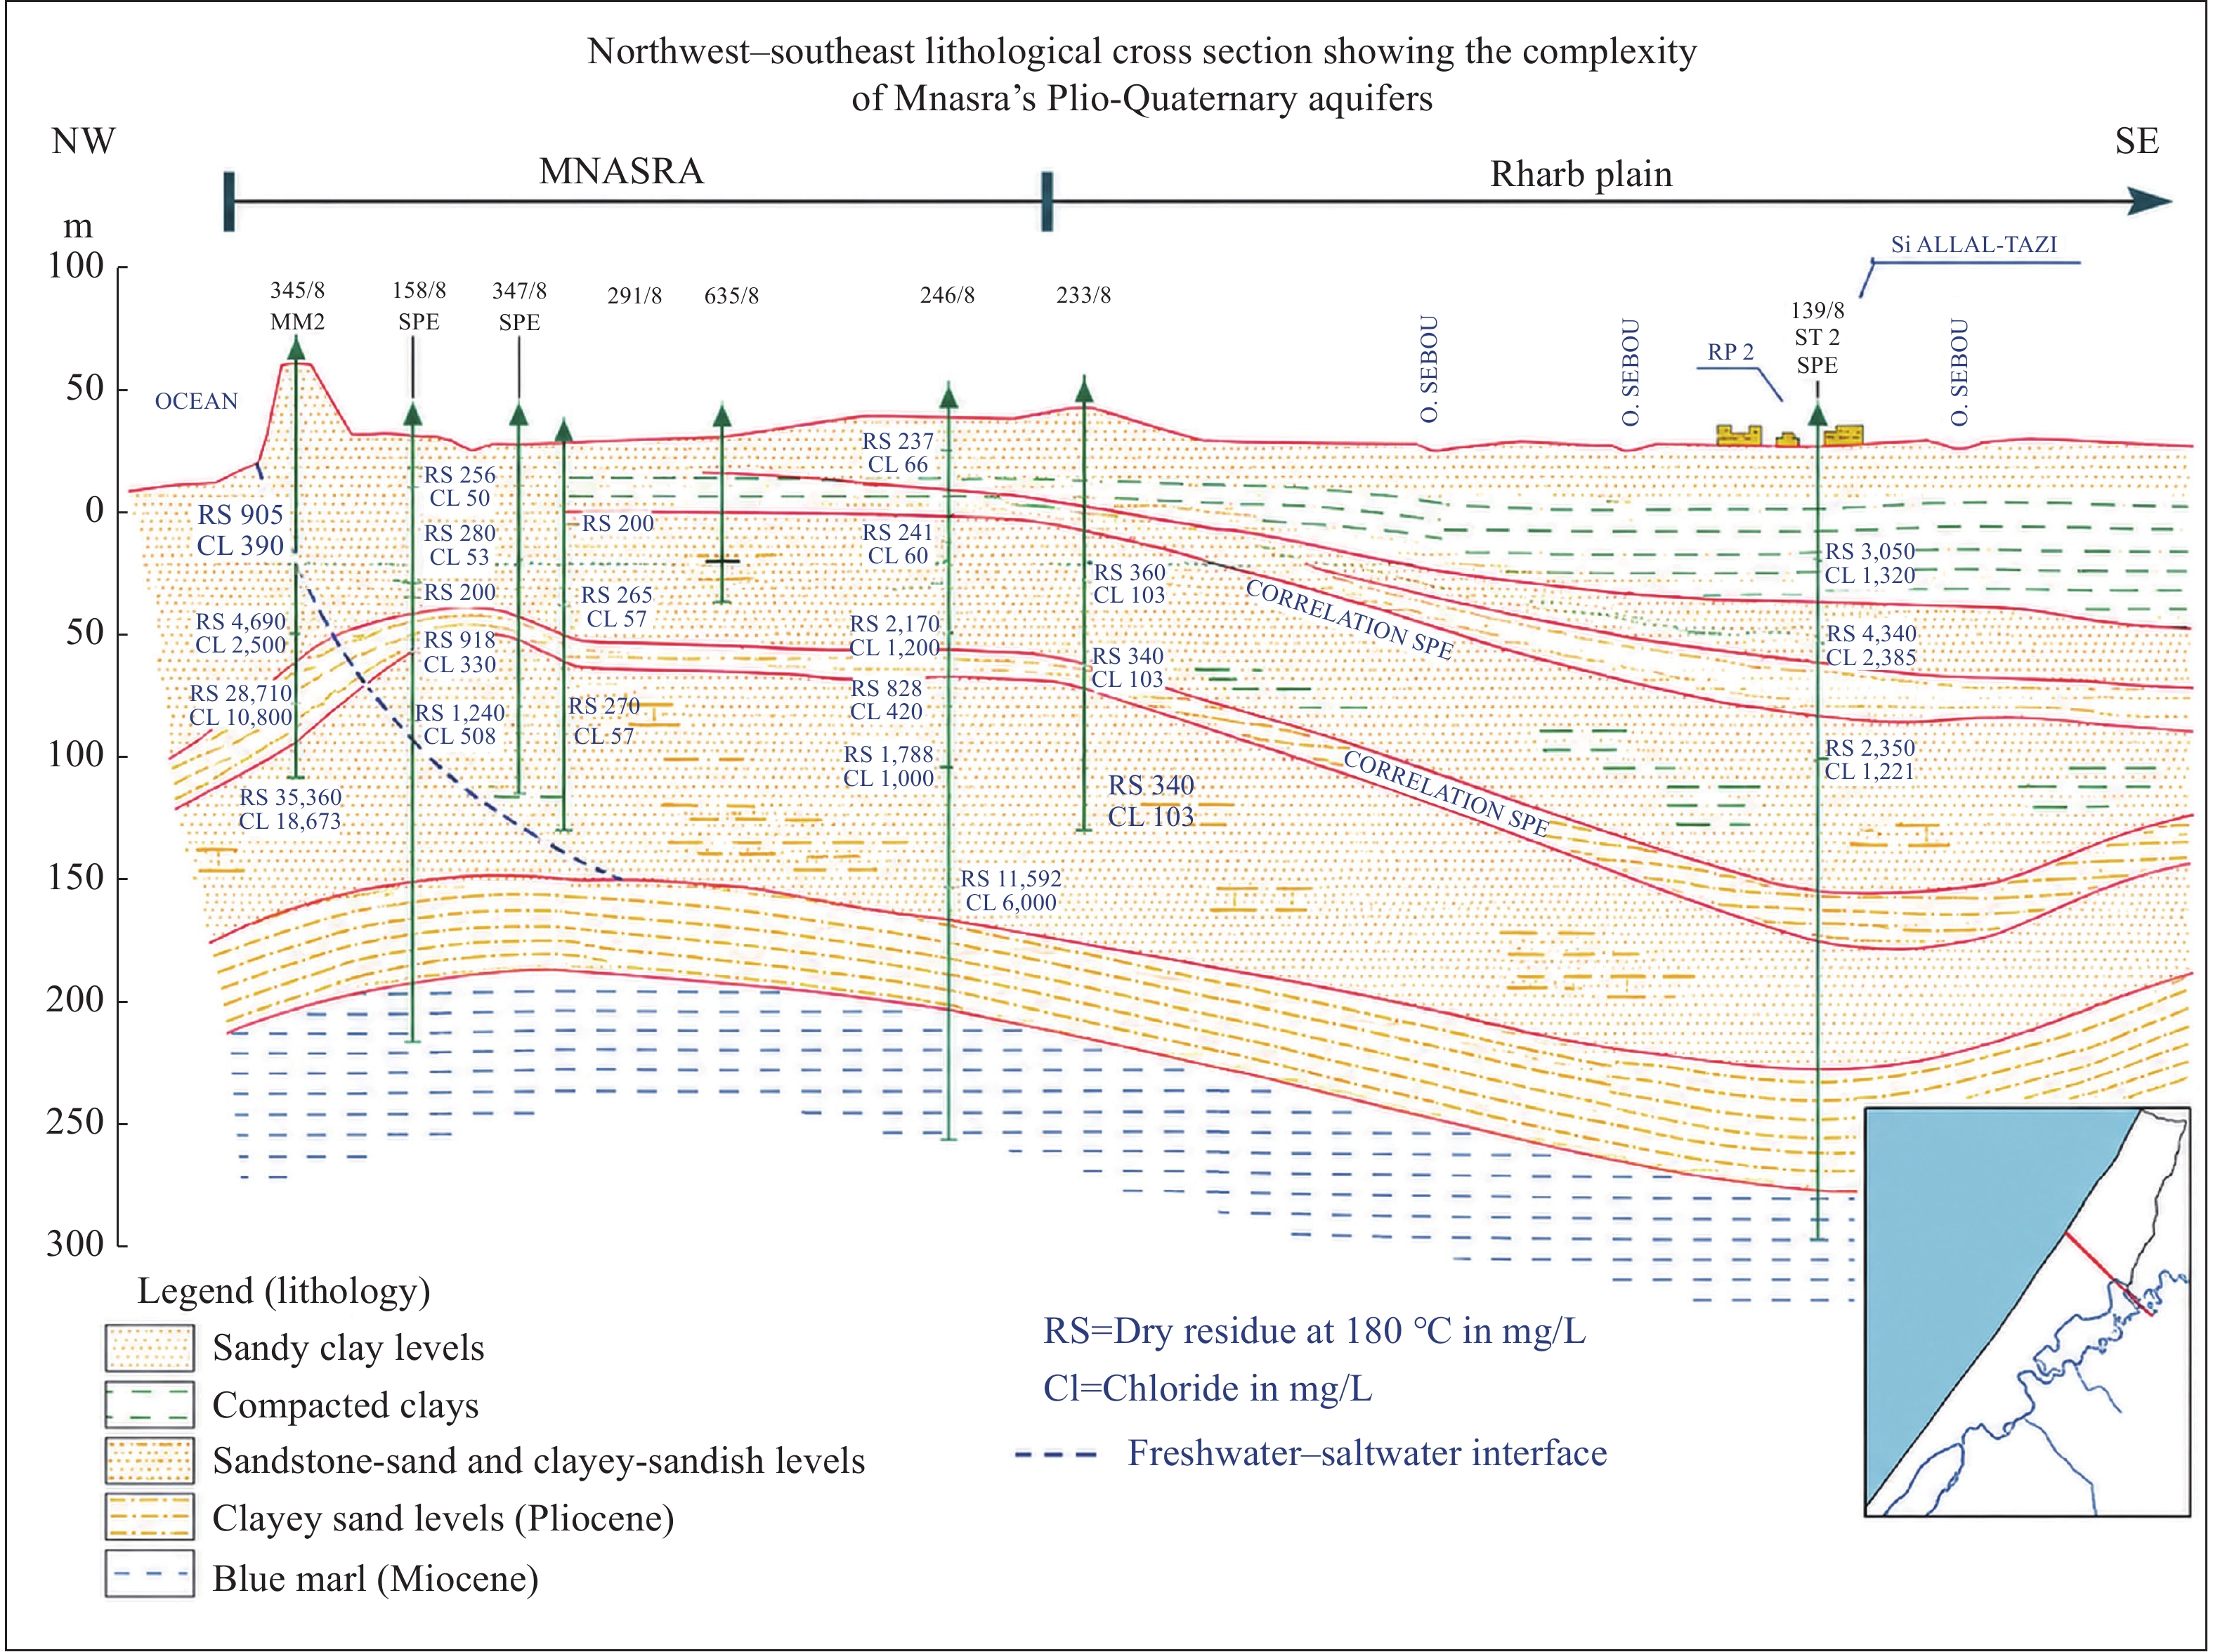
Figure 2. Northwest–southeast lithological cross section showing the complexity of Mnasra’s Plio-Quaternary aquifers (redrawn and translated from Combe, 1975, Fig. 40).
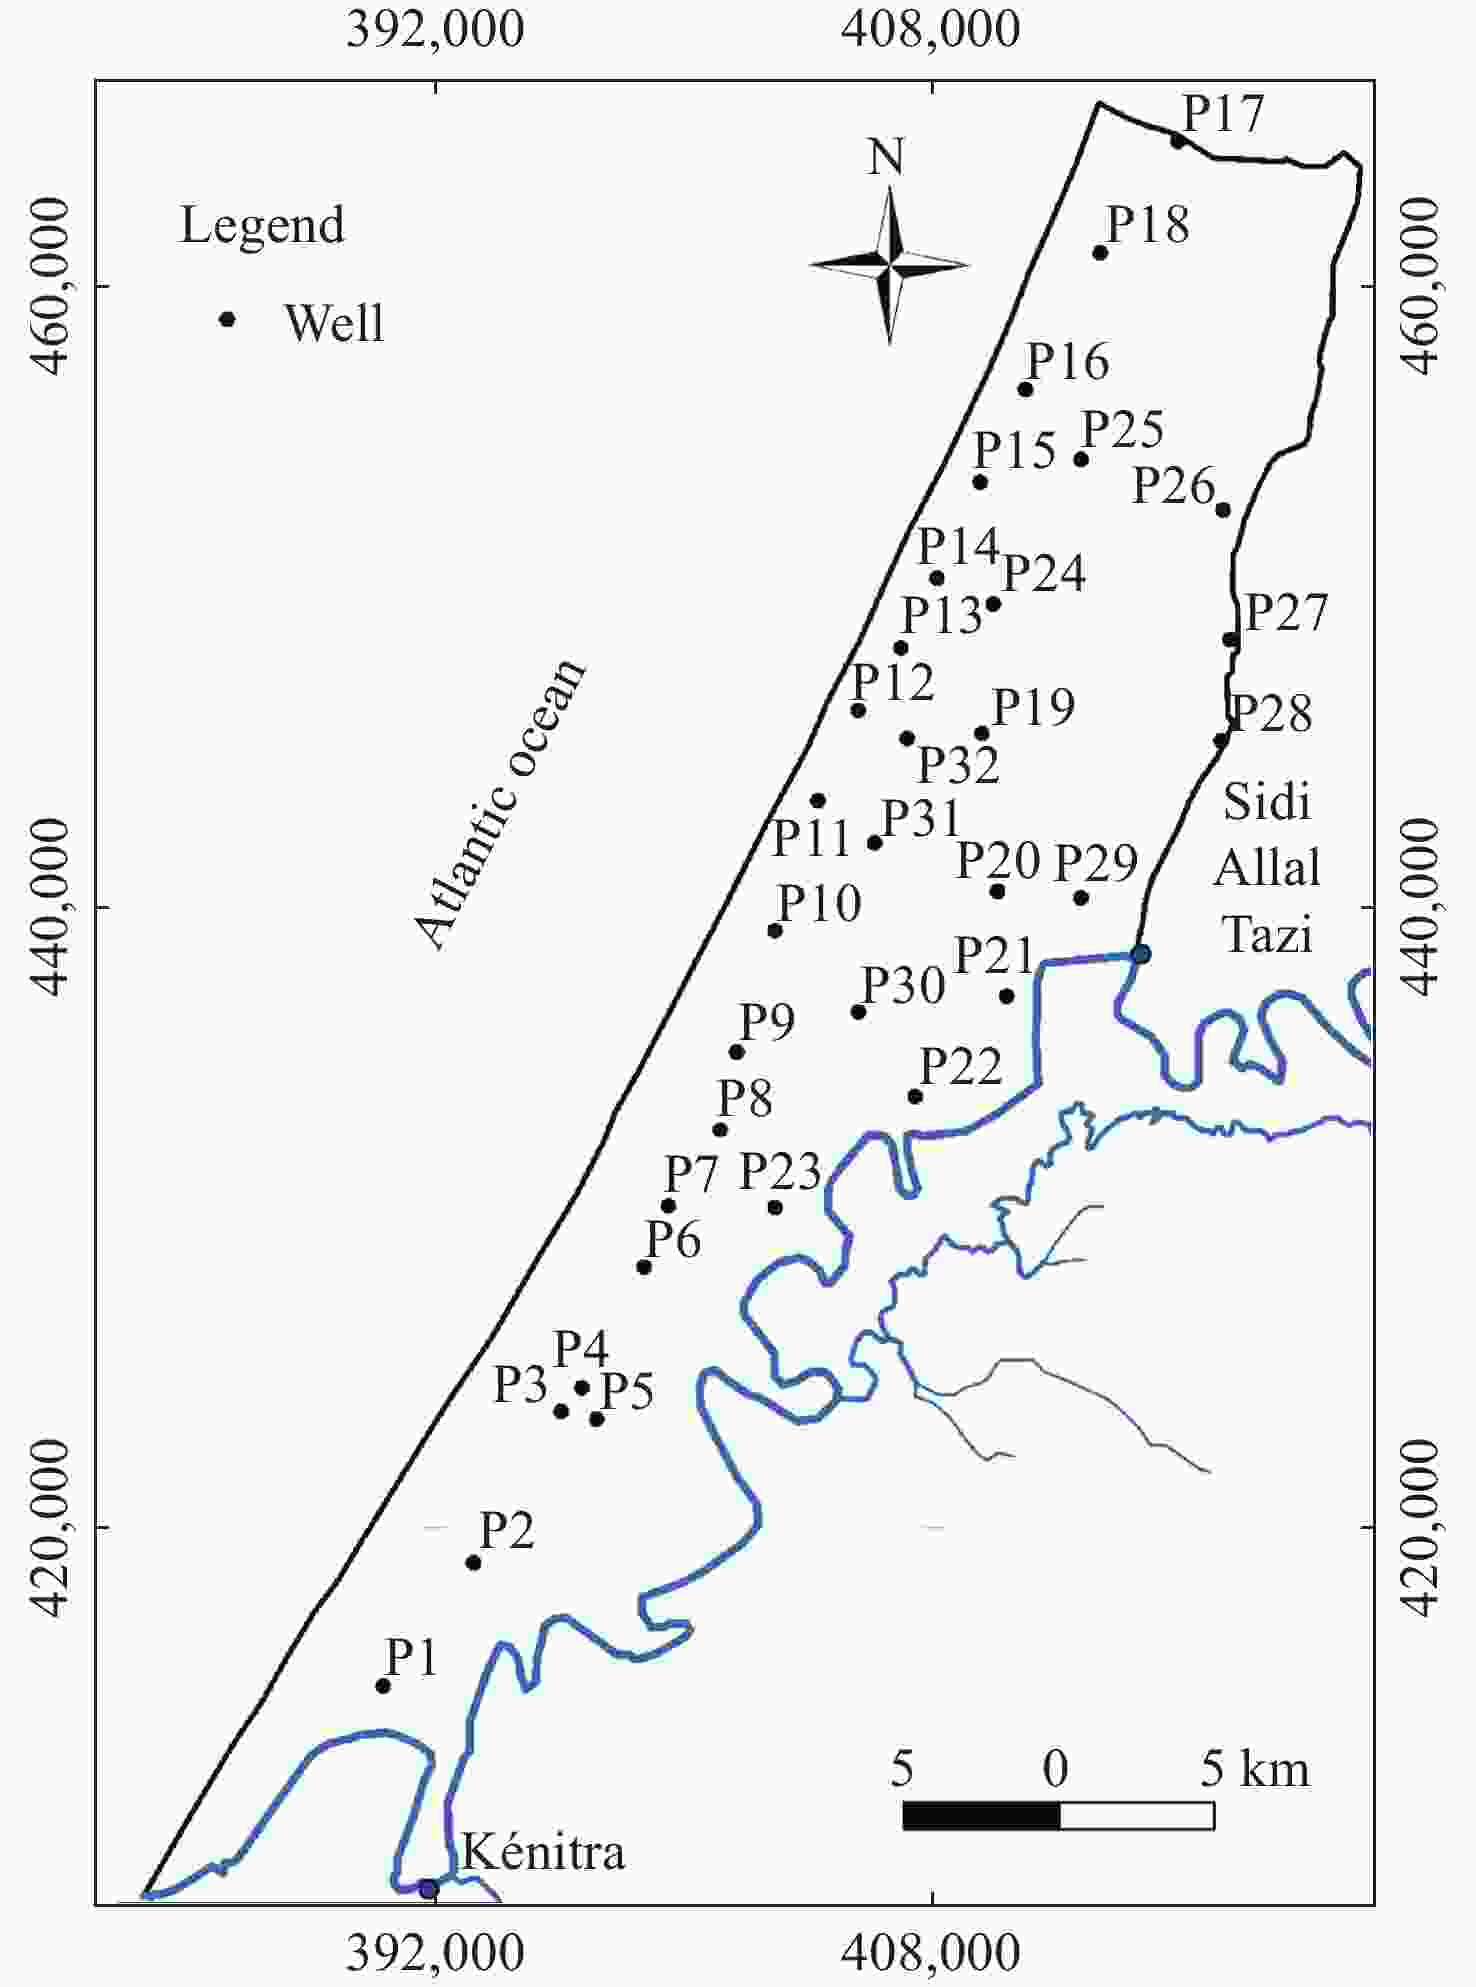
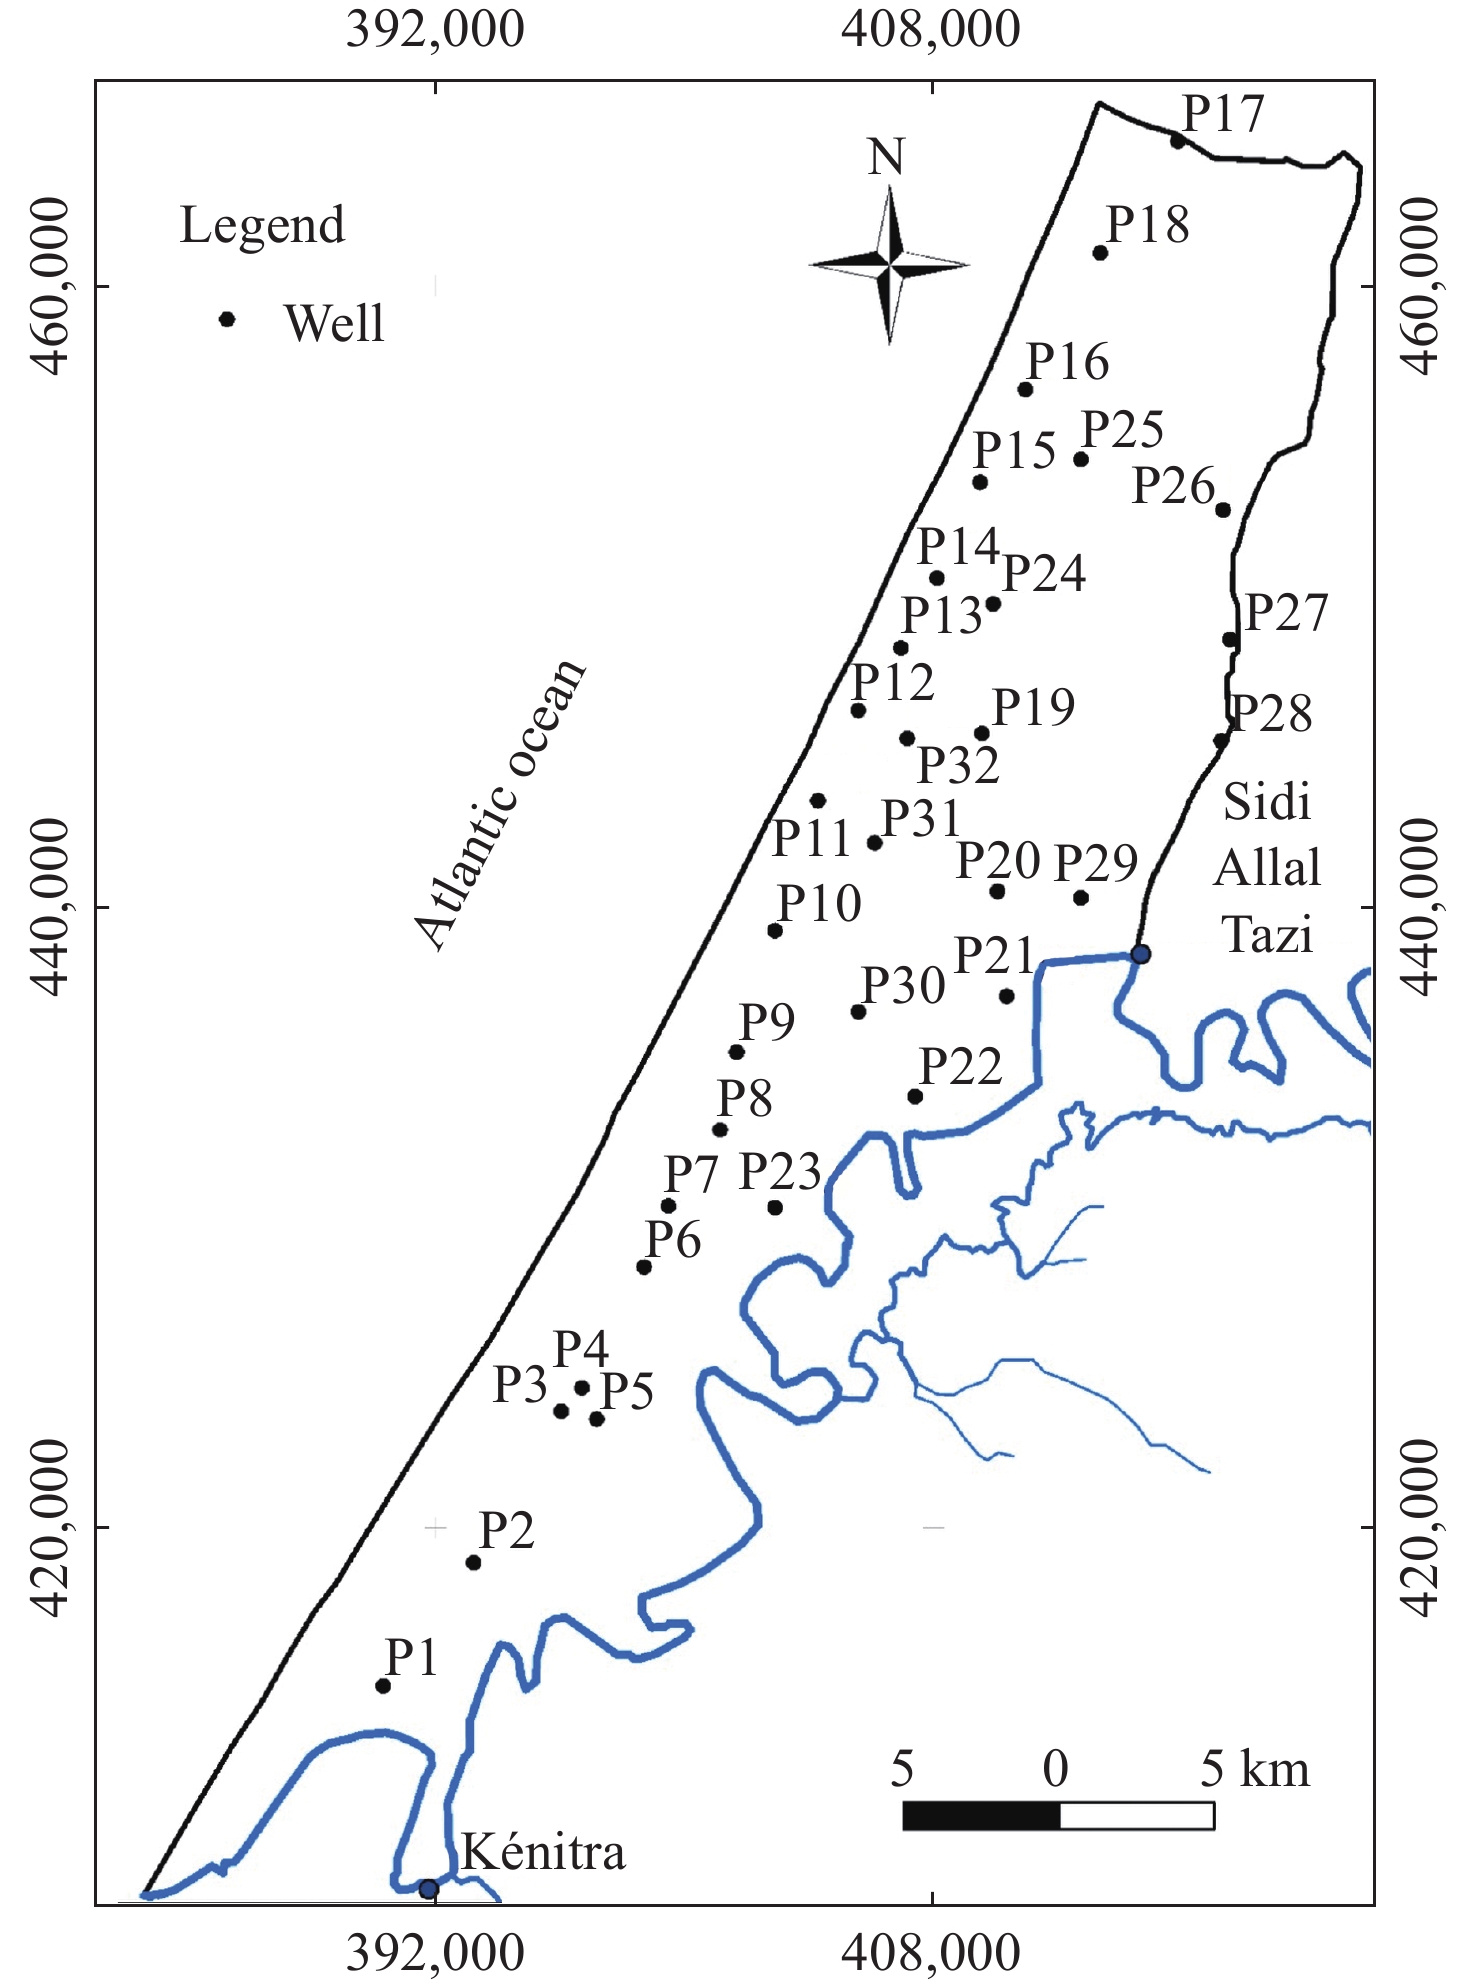
Figure 3. Location map of sampled wells of the Mnasra coastal aquifer (Aguedai et al., 2022)
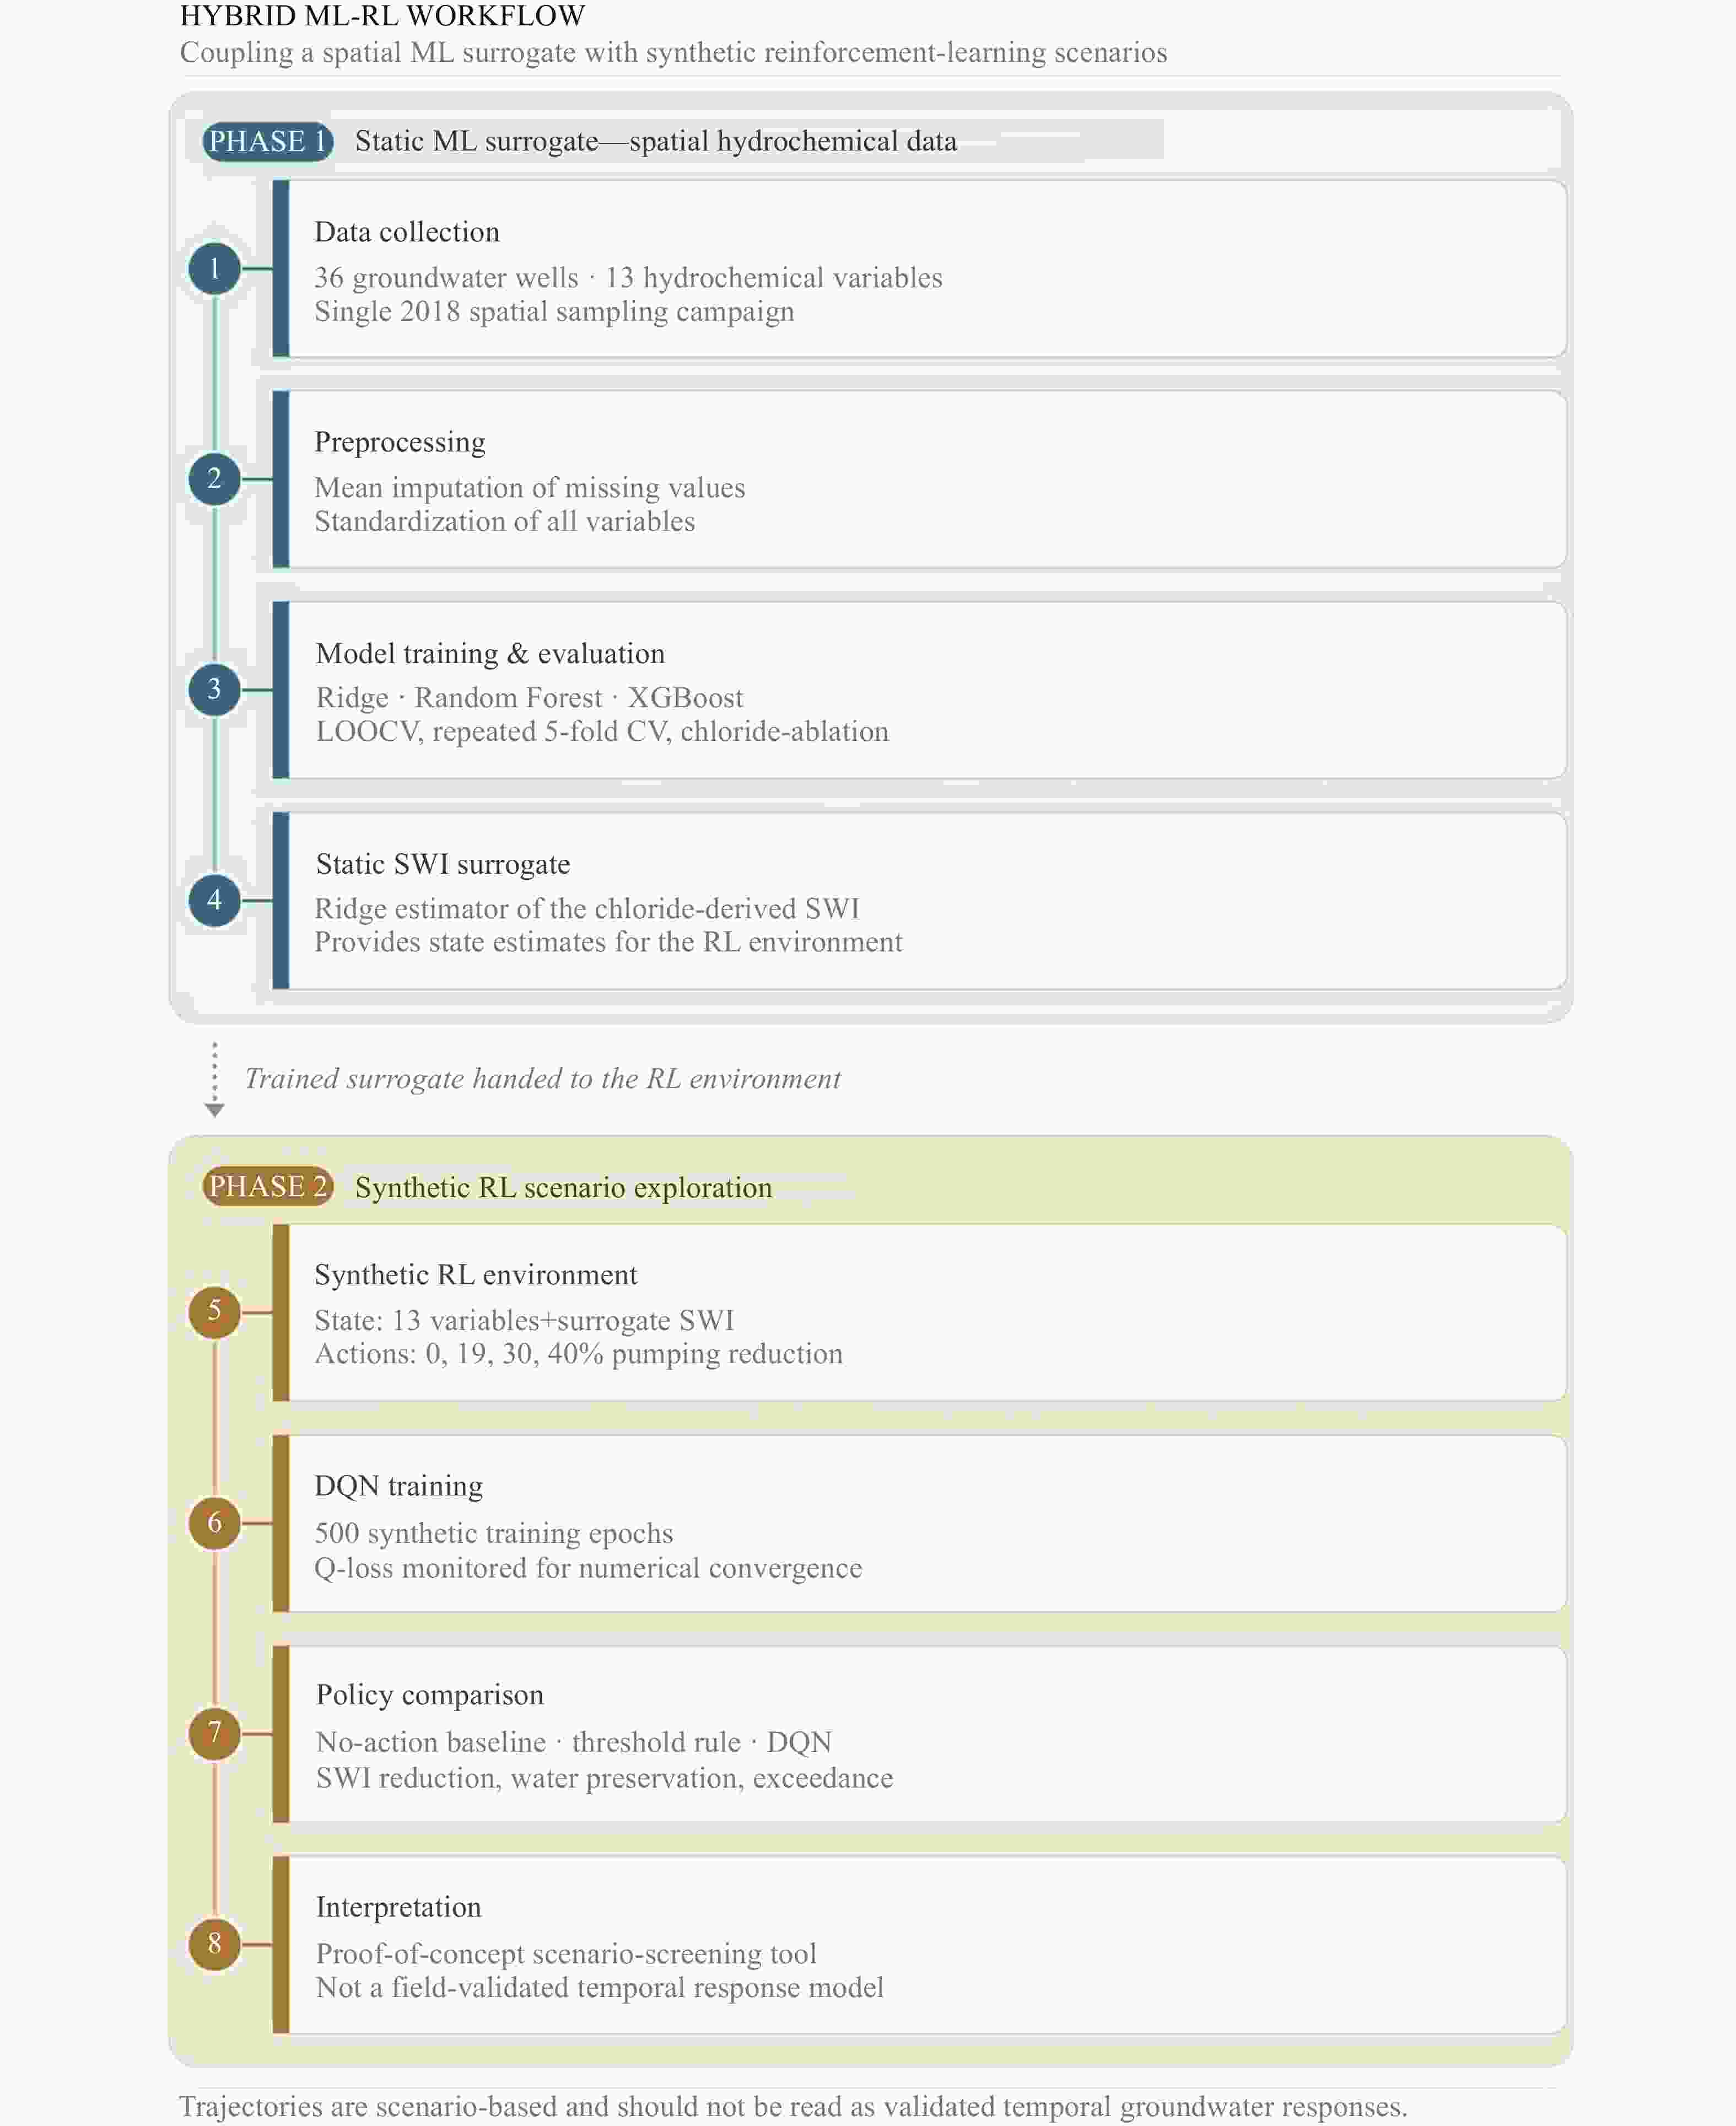
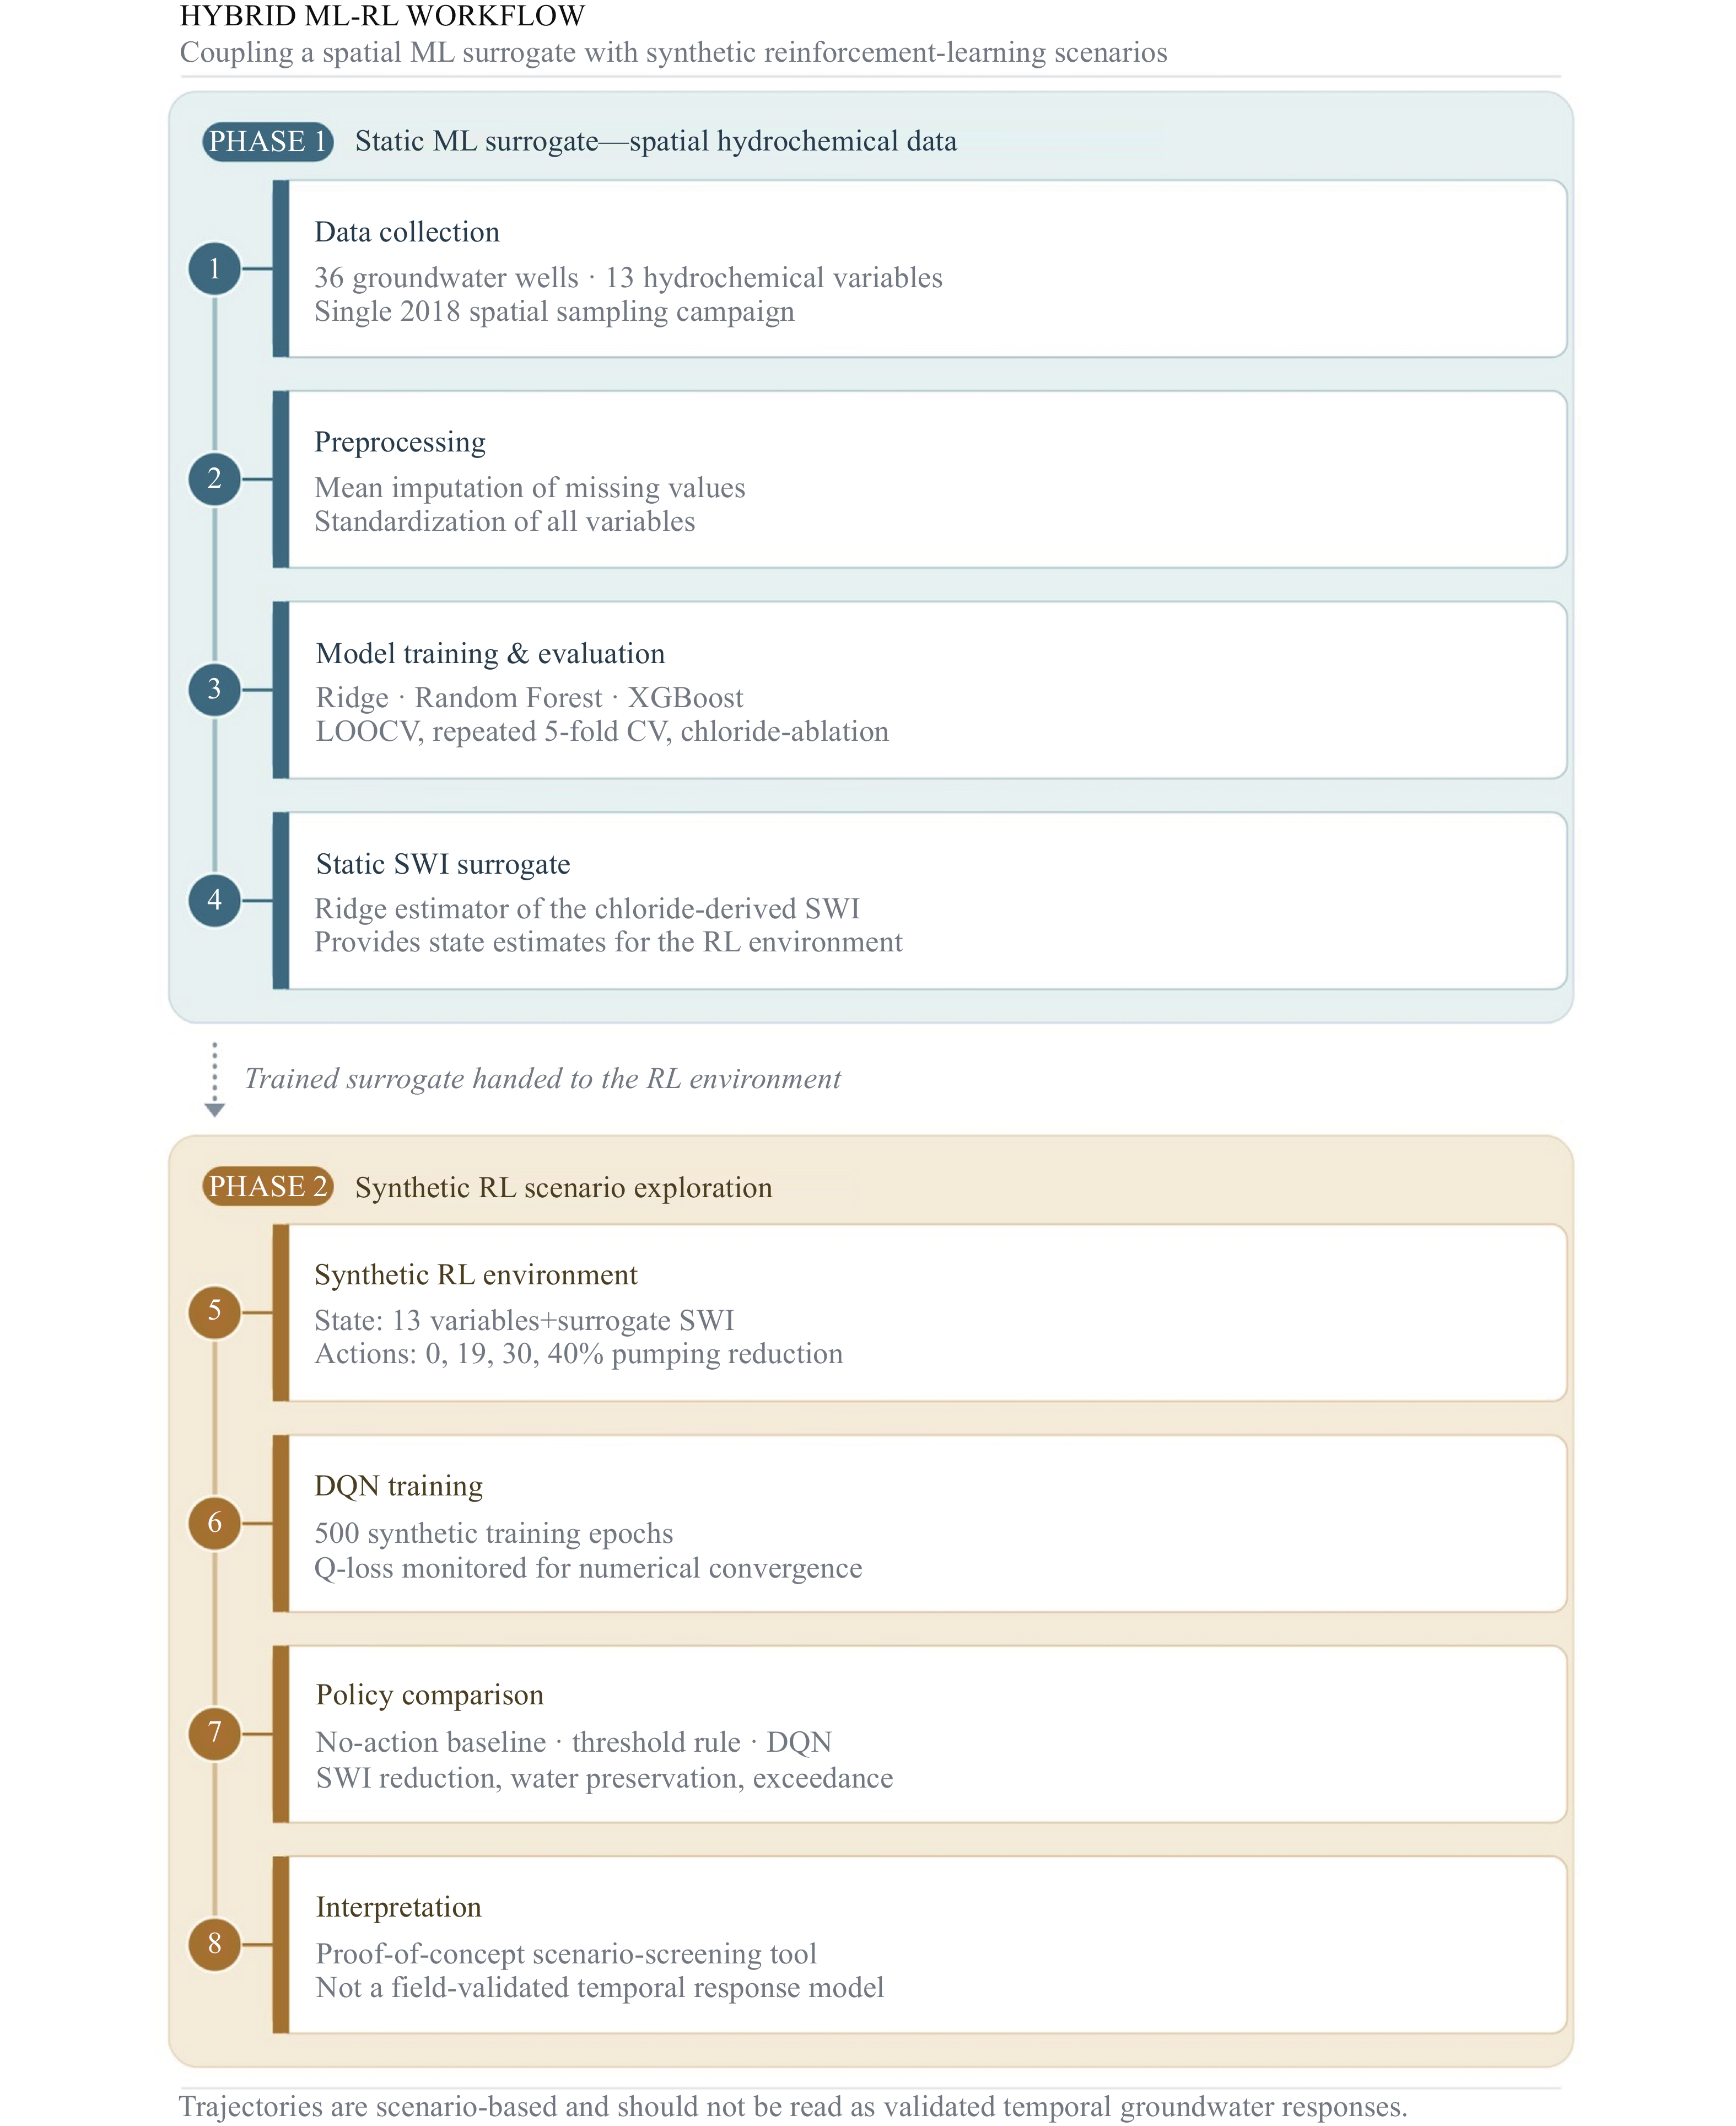
Figure 4. Revised flowchart of the hybrid ML–RL system.
Notes: Phase 1 uses the 36 spatial groundwater samples to train and evaluate a static ML surrogate for the chloride-derived SWI using LOOCV, repeated 5-fold cross-validation, and chloride-ablation diagnostics. Phase 2 uses the trained surrogate within a simplified synthetic environment to evaluate pumping-reduction scenarios. The generated trajectories are scenario-based and should not be interpreted as validated temporal groundwater responses
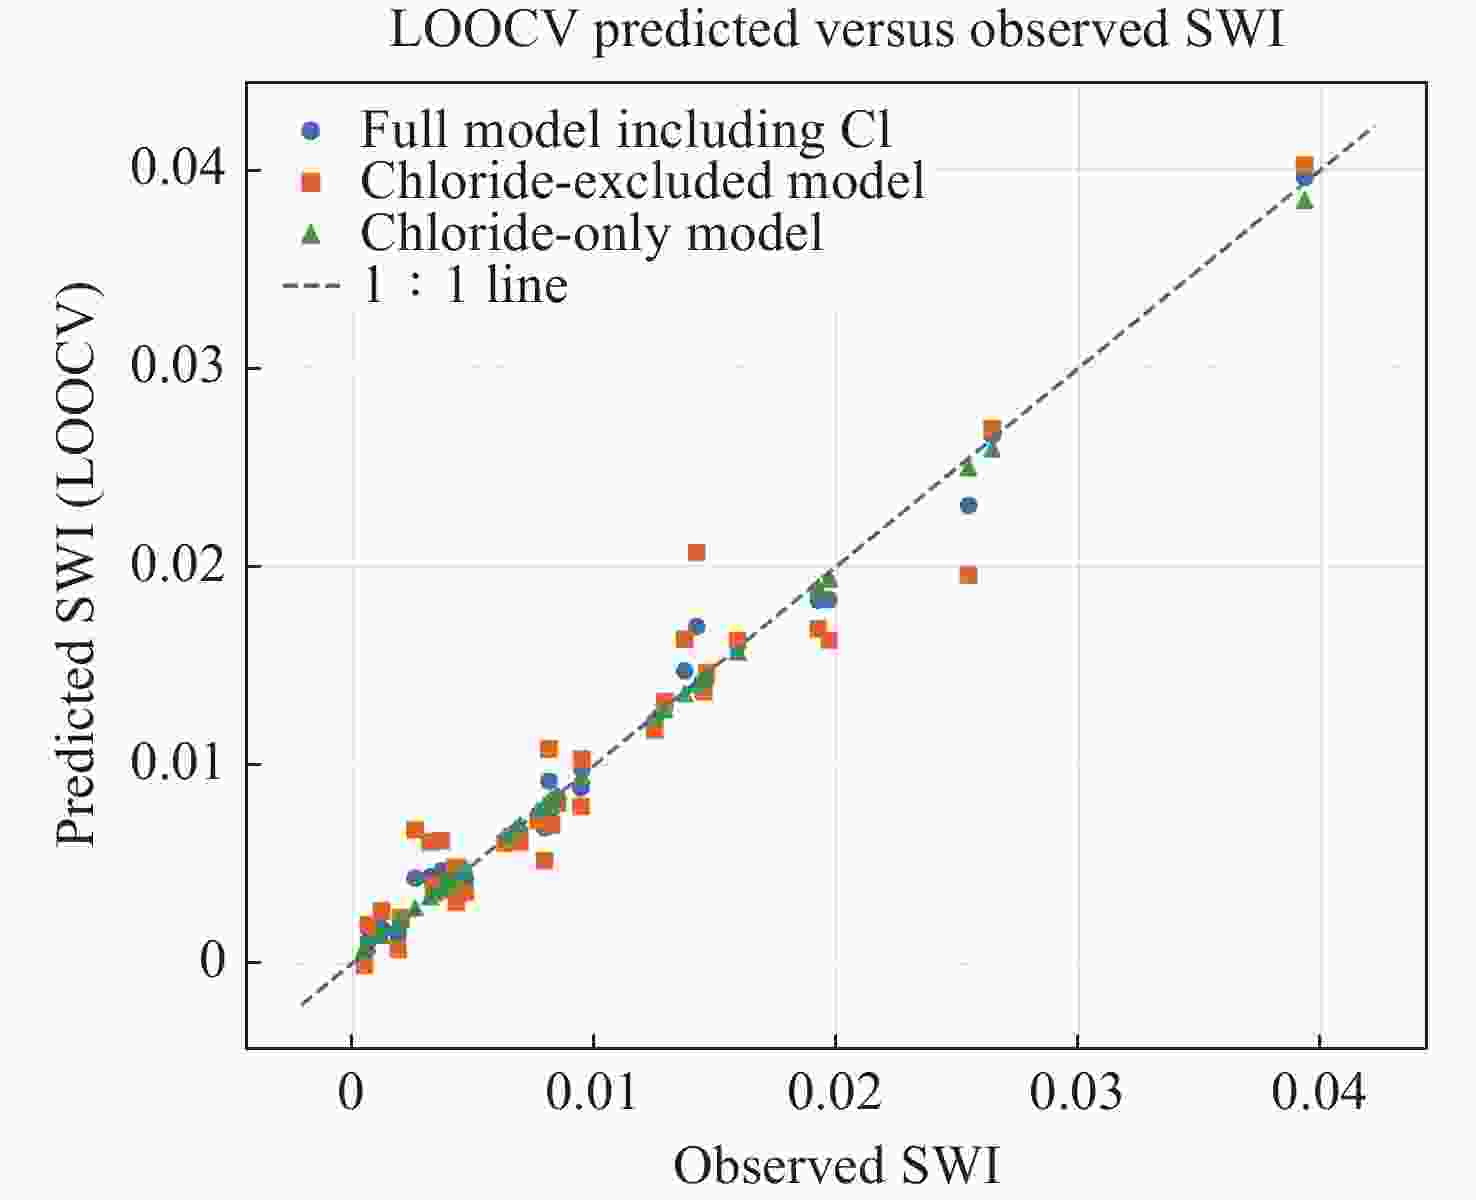
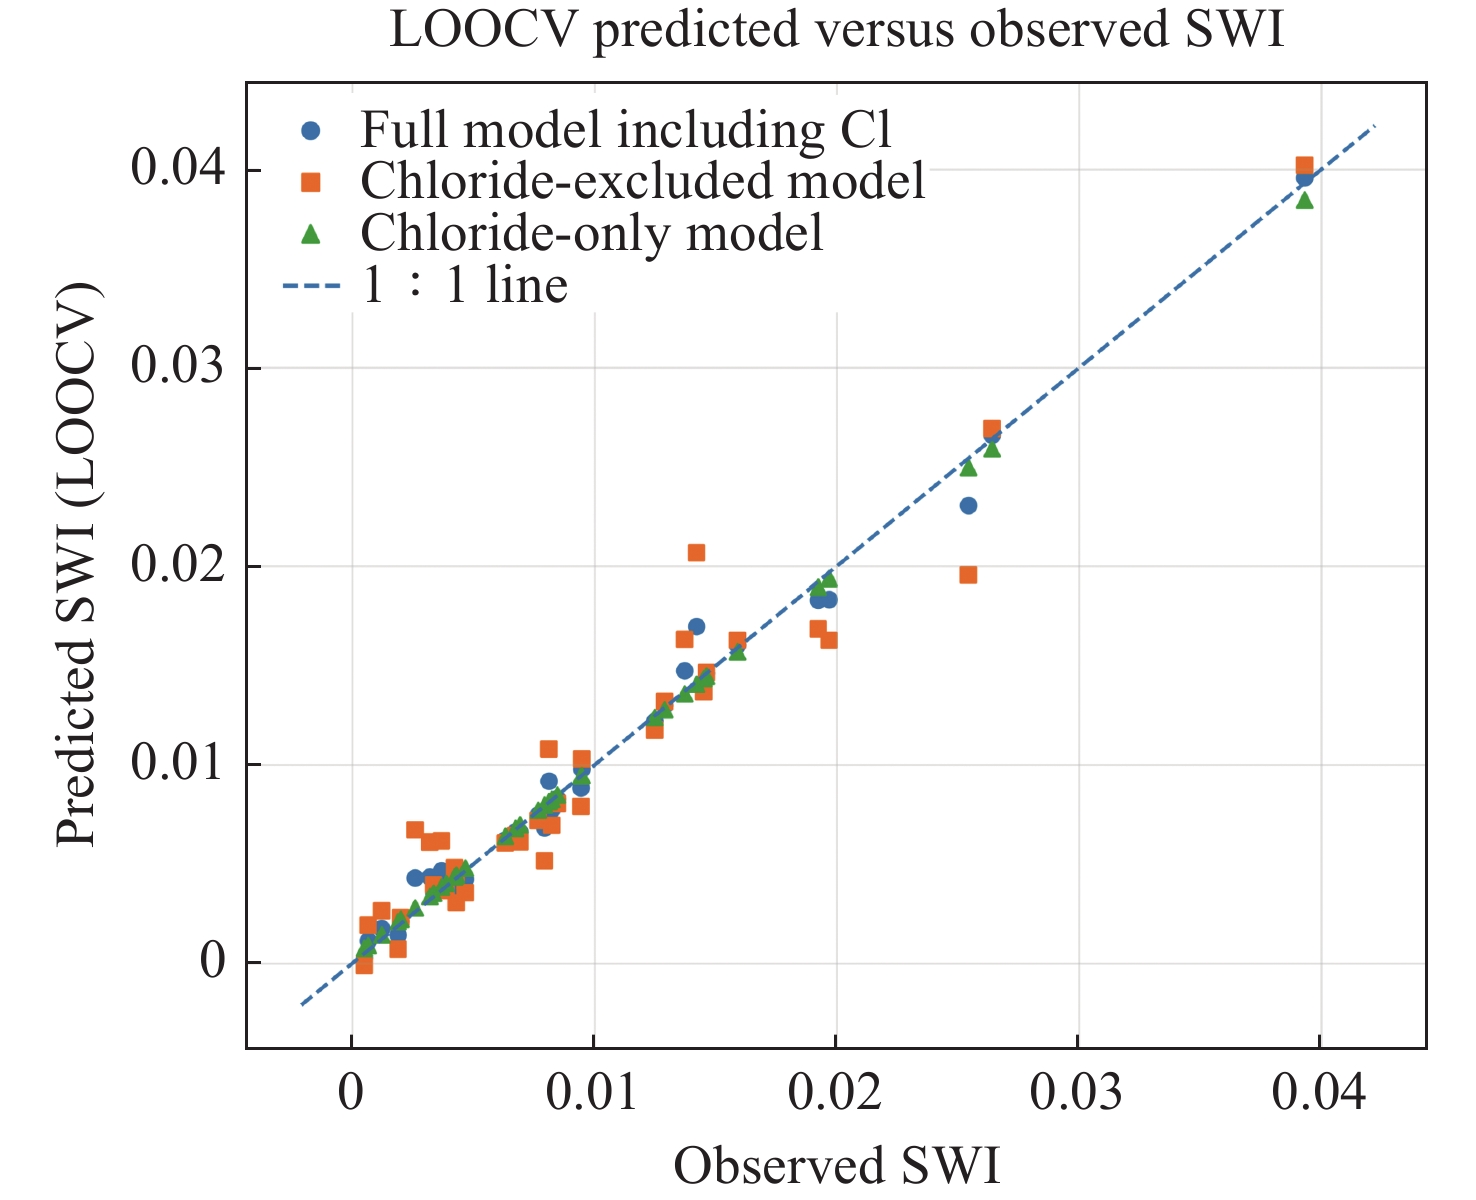
Figure 5. Leave-one-out cross-validation predicted versus observed SWI values for the Ridge Regression configurations. The dashed line represents the 1:1 agreement line
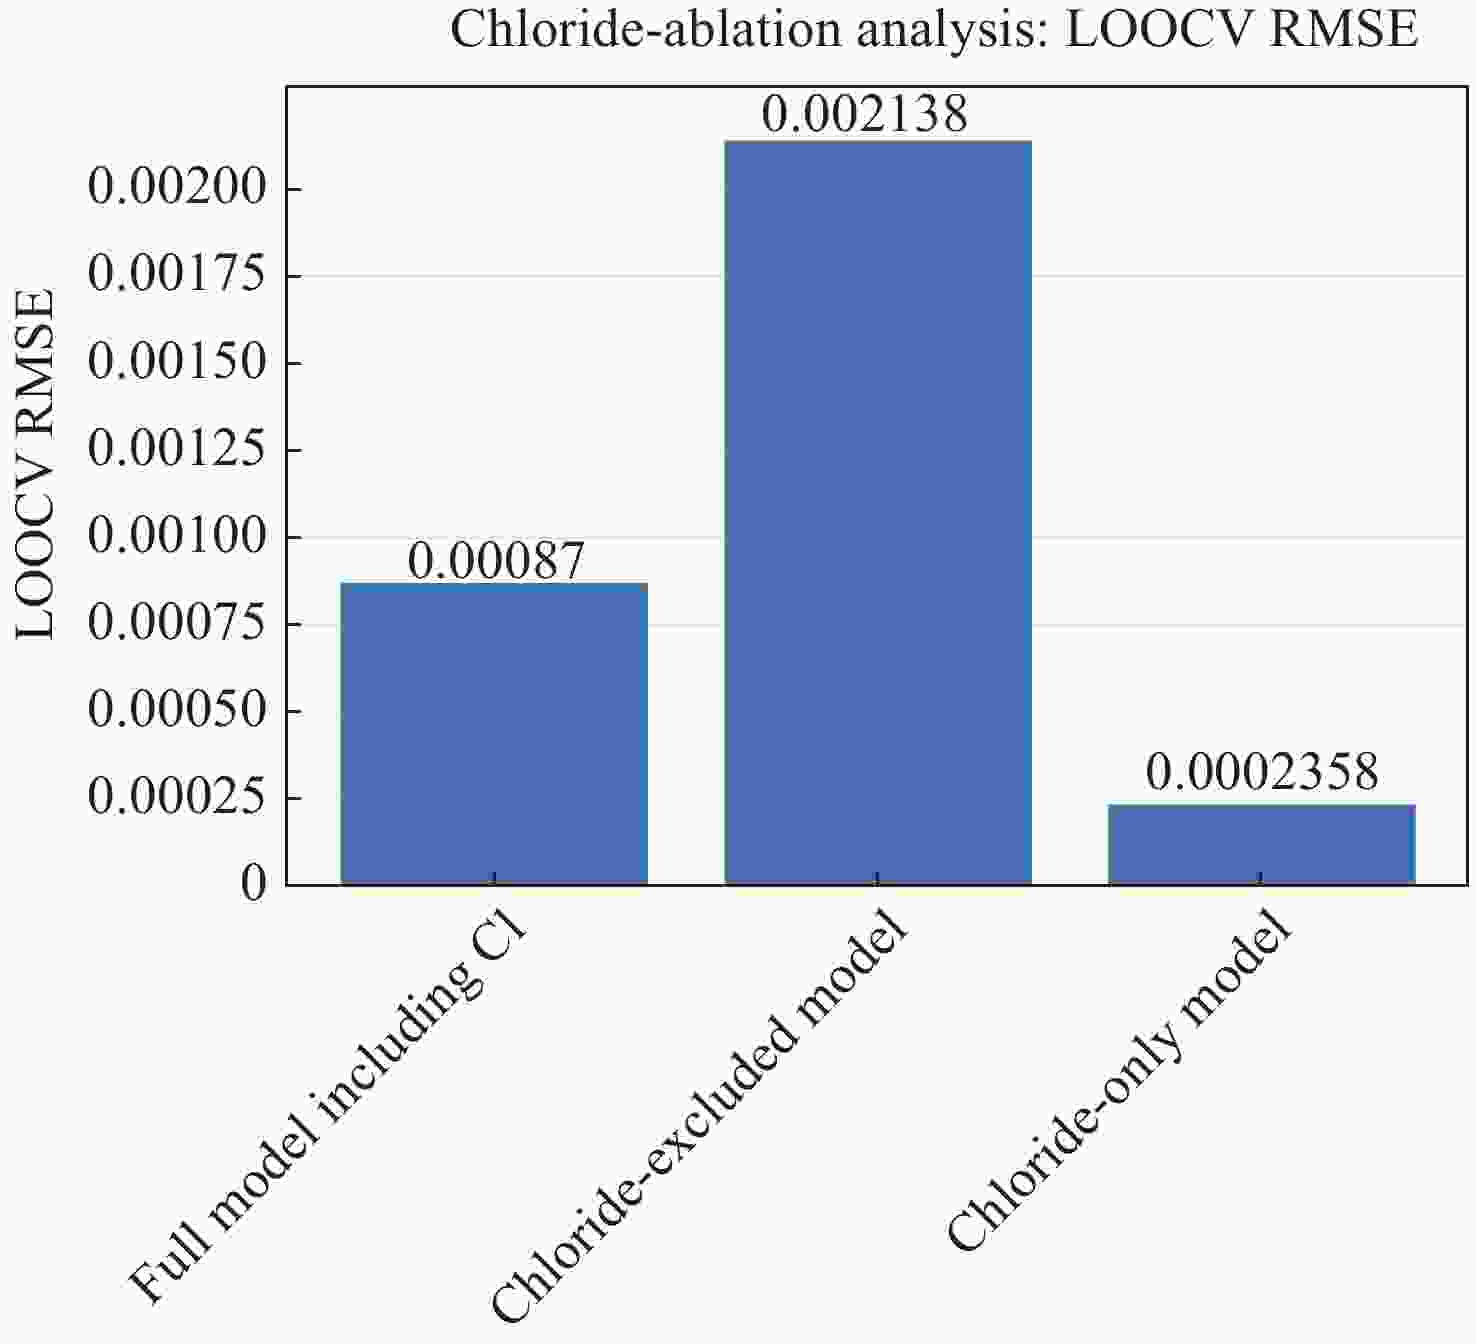
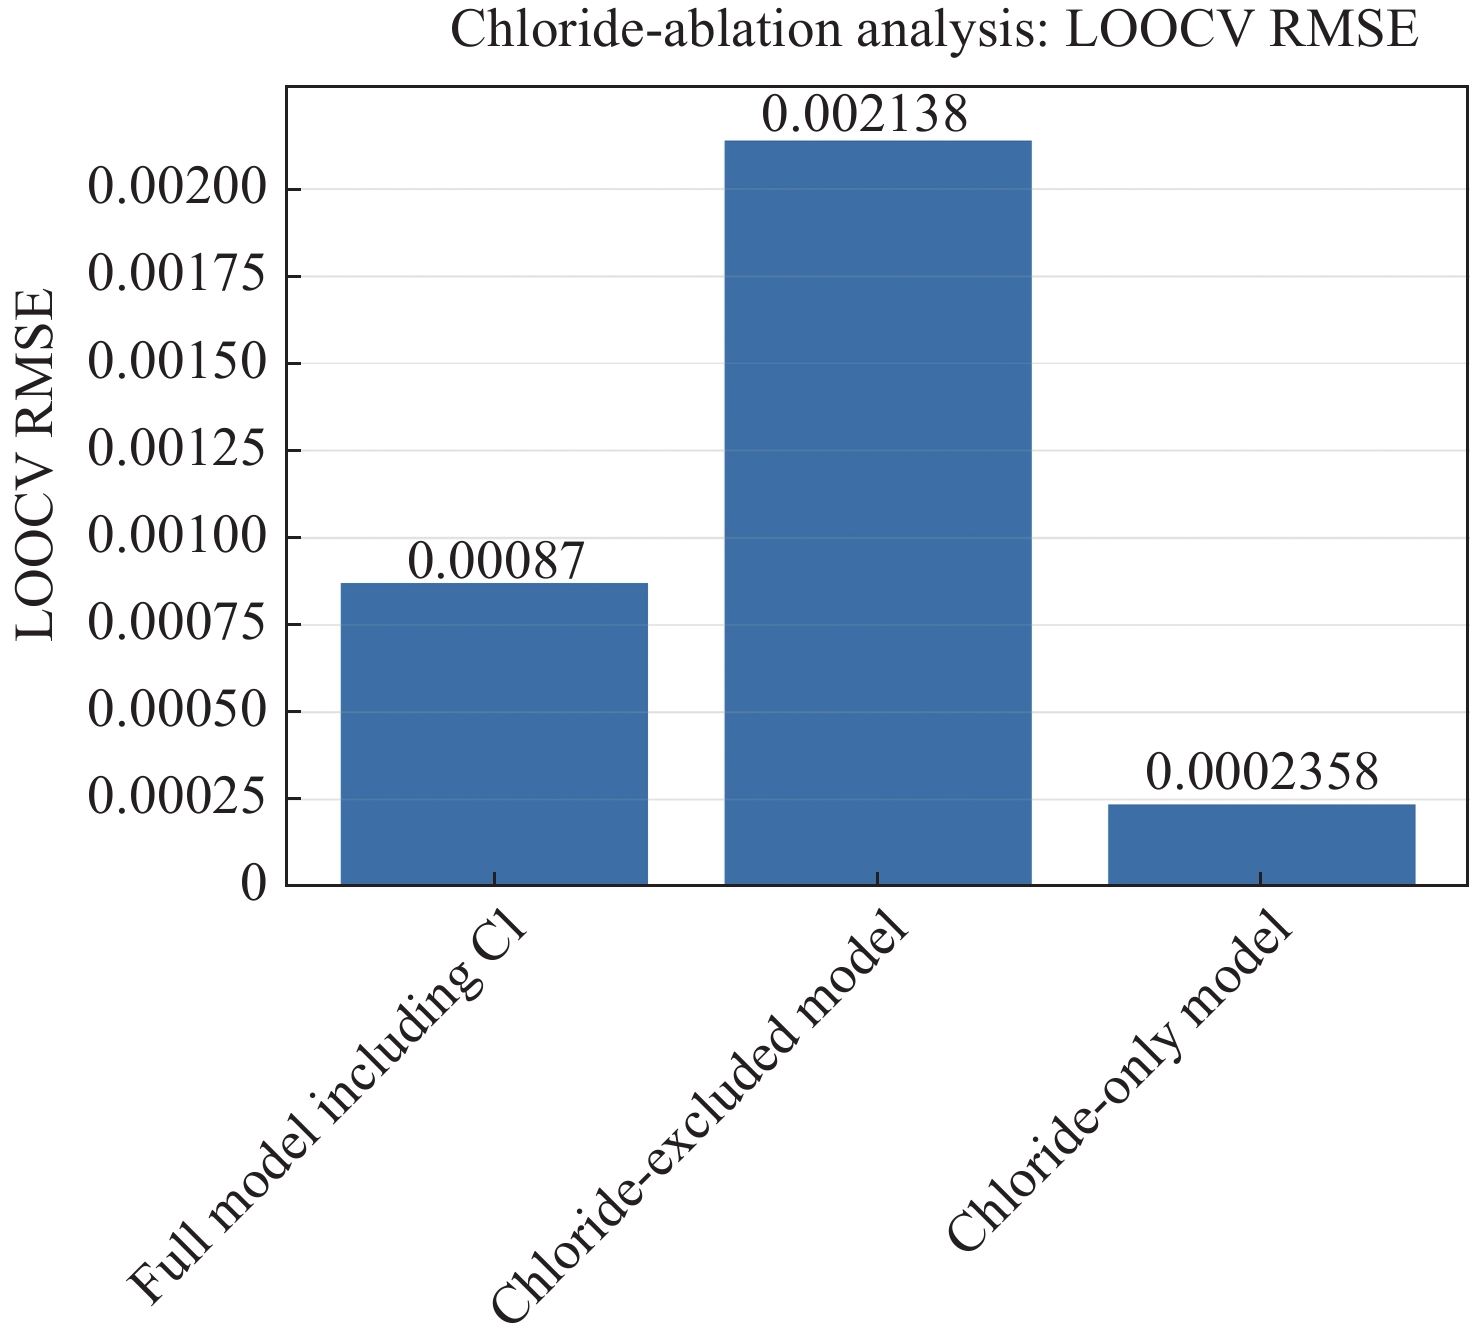
Figure 6. Chloride-ablation analysis showing LOOCV RMSE for full, chloride-excluded, and chloride-only Ridge Regression configurations
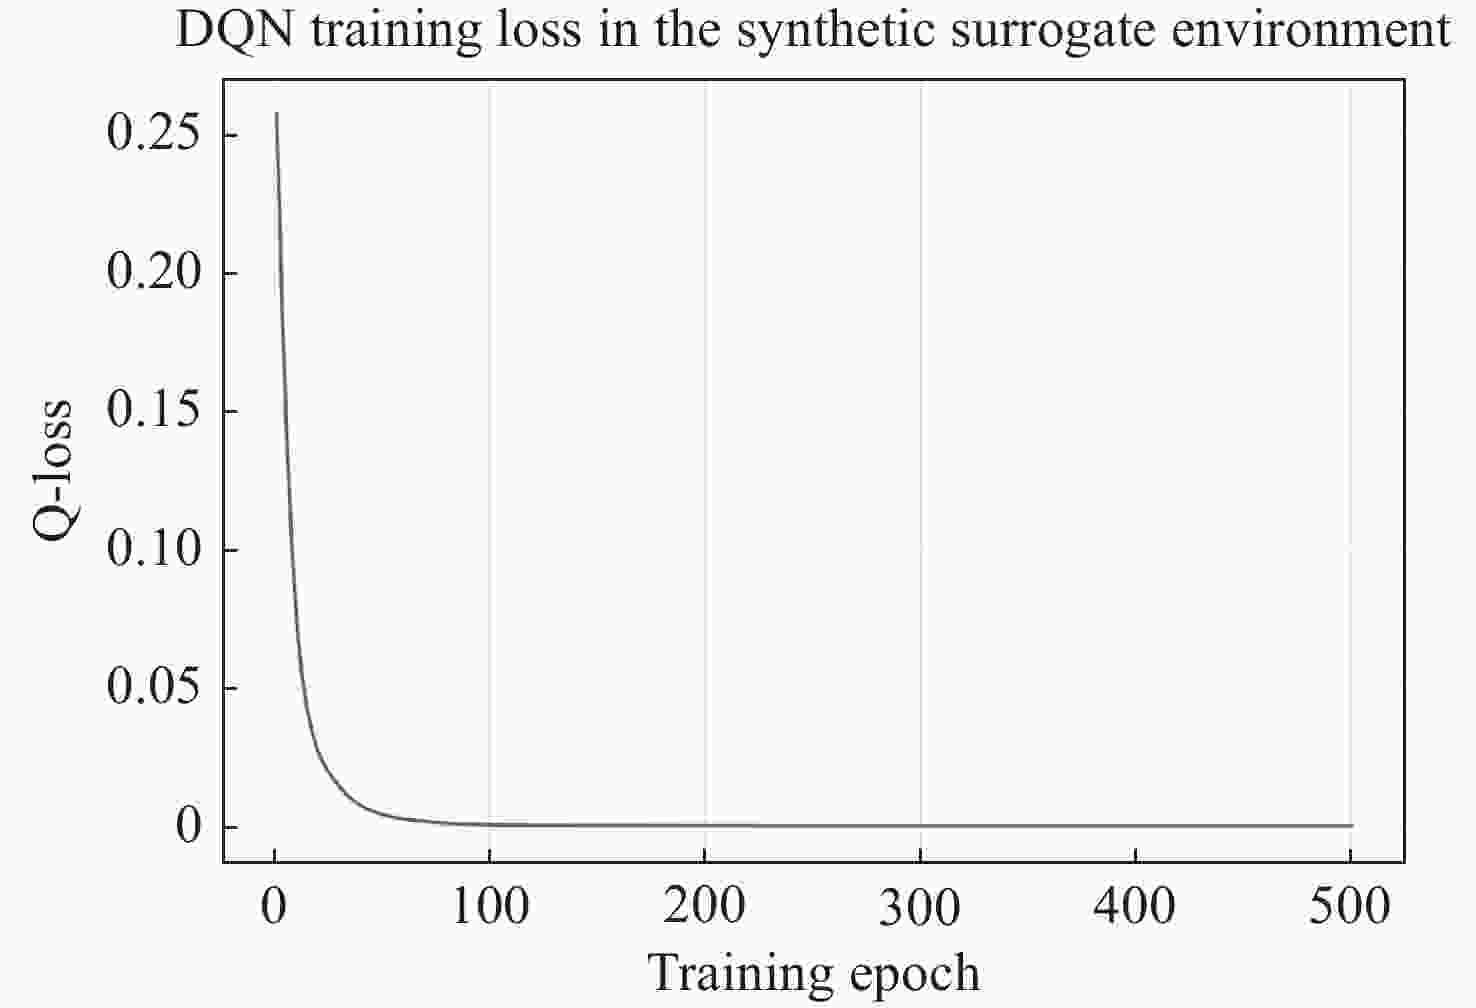
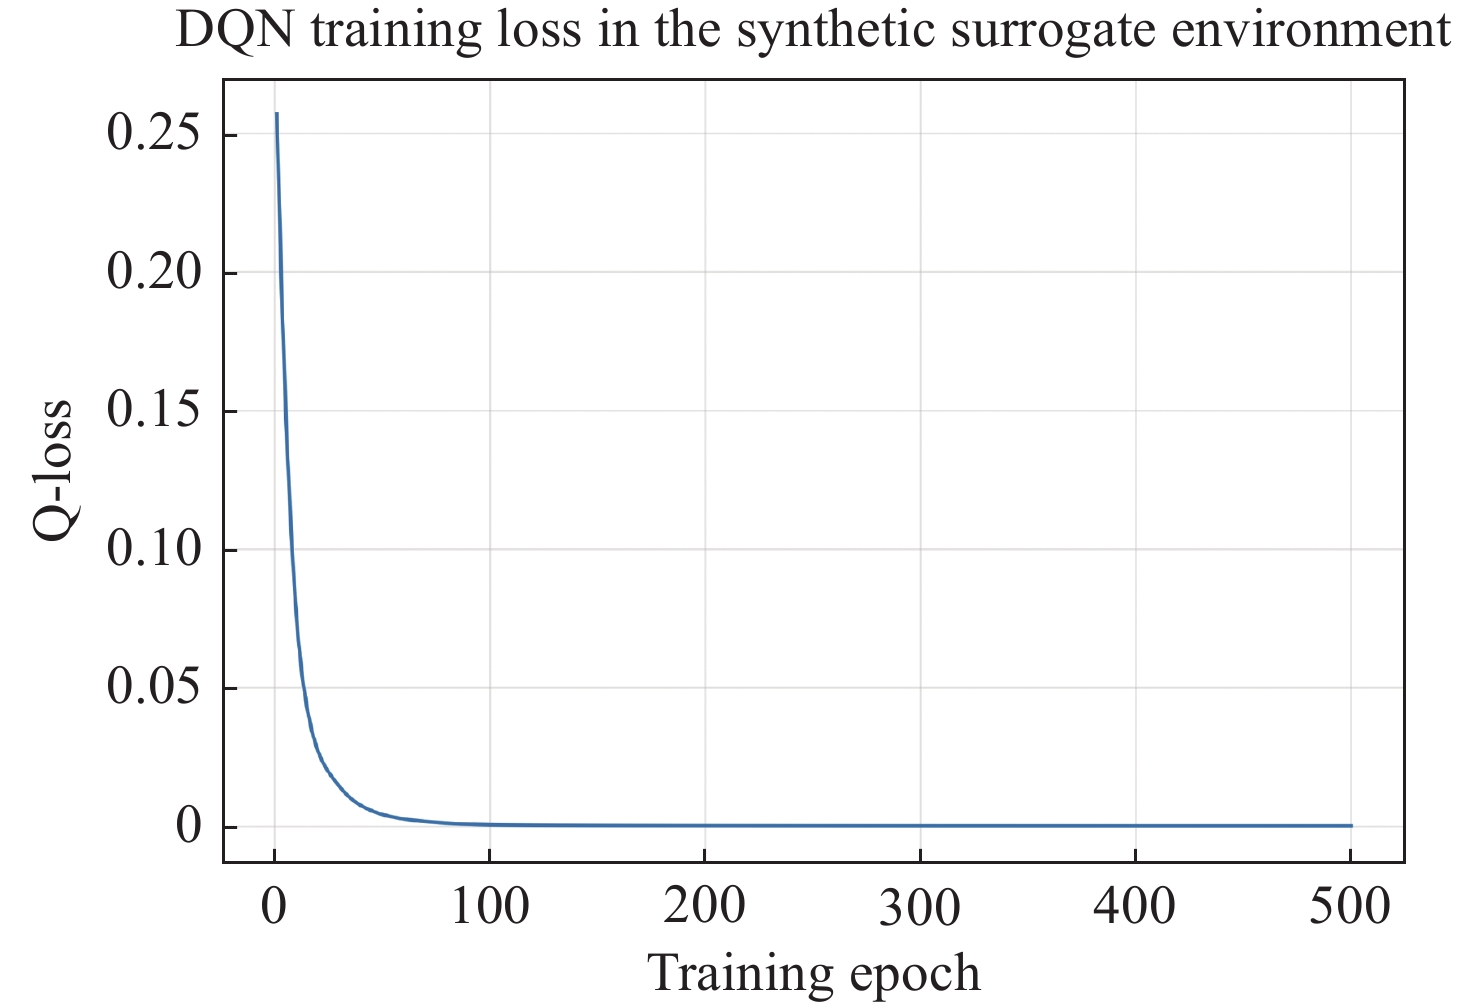
Figure 7. DQN training loss in the synthetic surrogate environment. The decreasing Q-loss indicates numerical stabilization within the simplified surrogate environment and should not be interpreted as field validation of groundwater-response dynamics
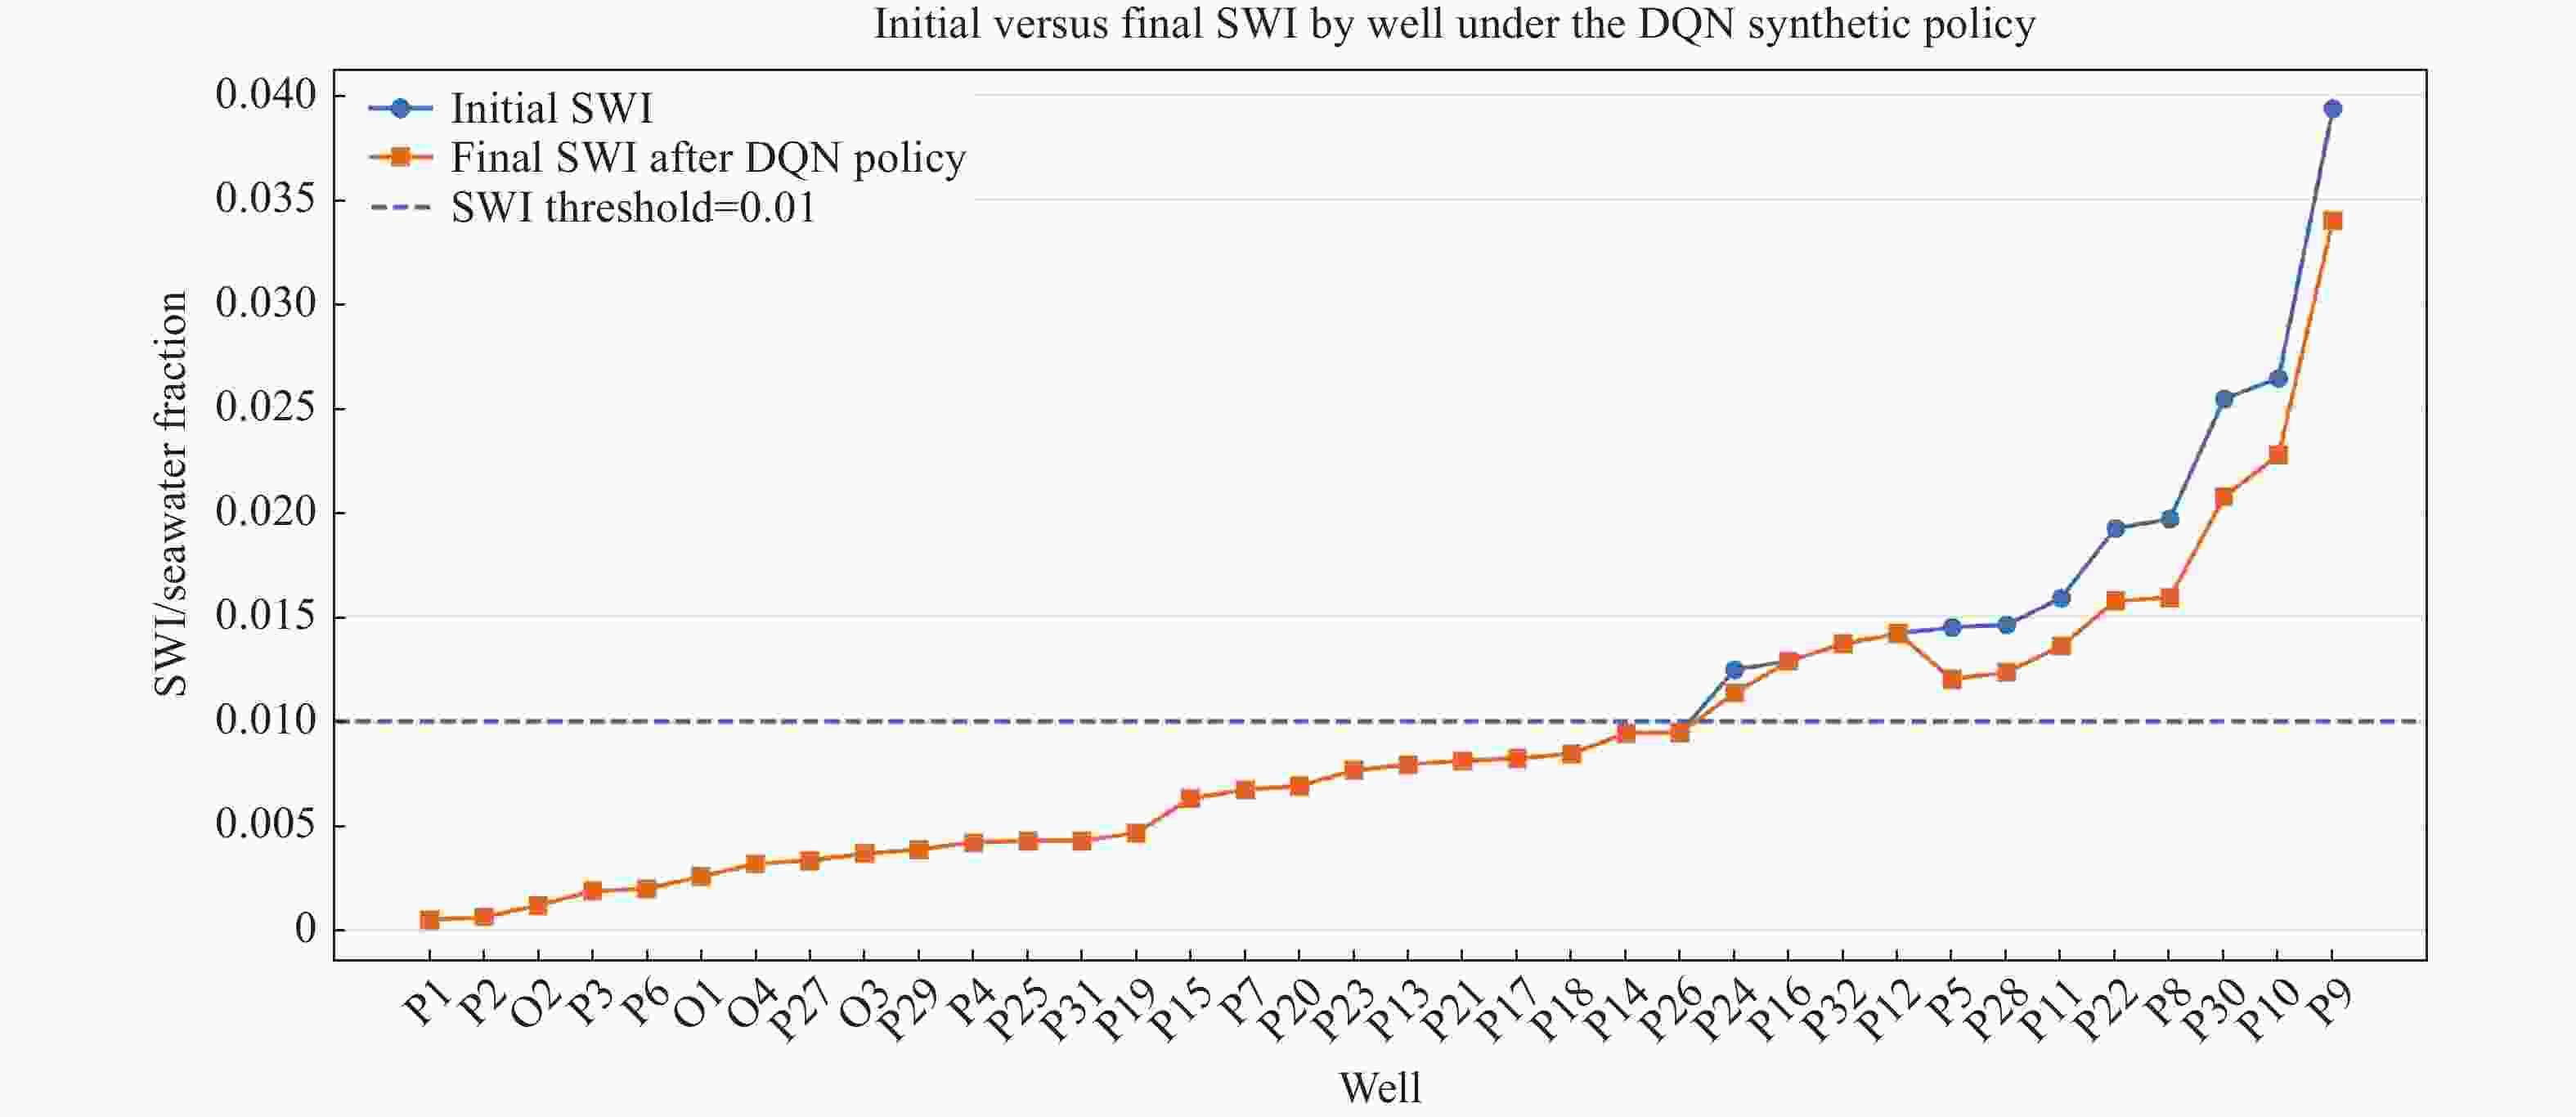
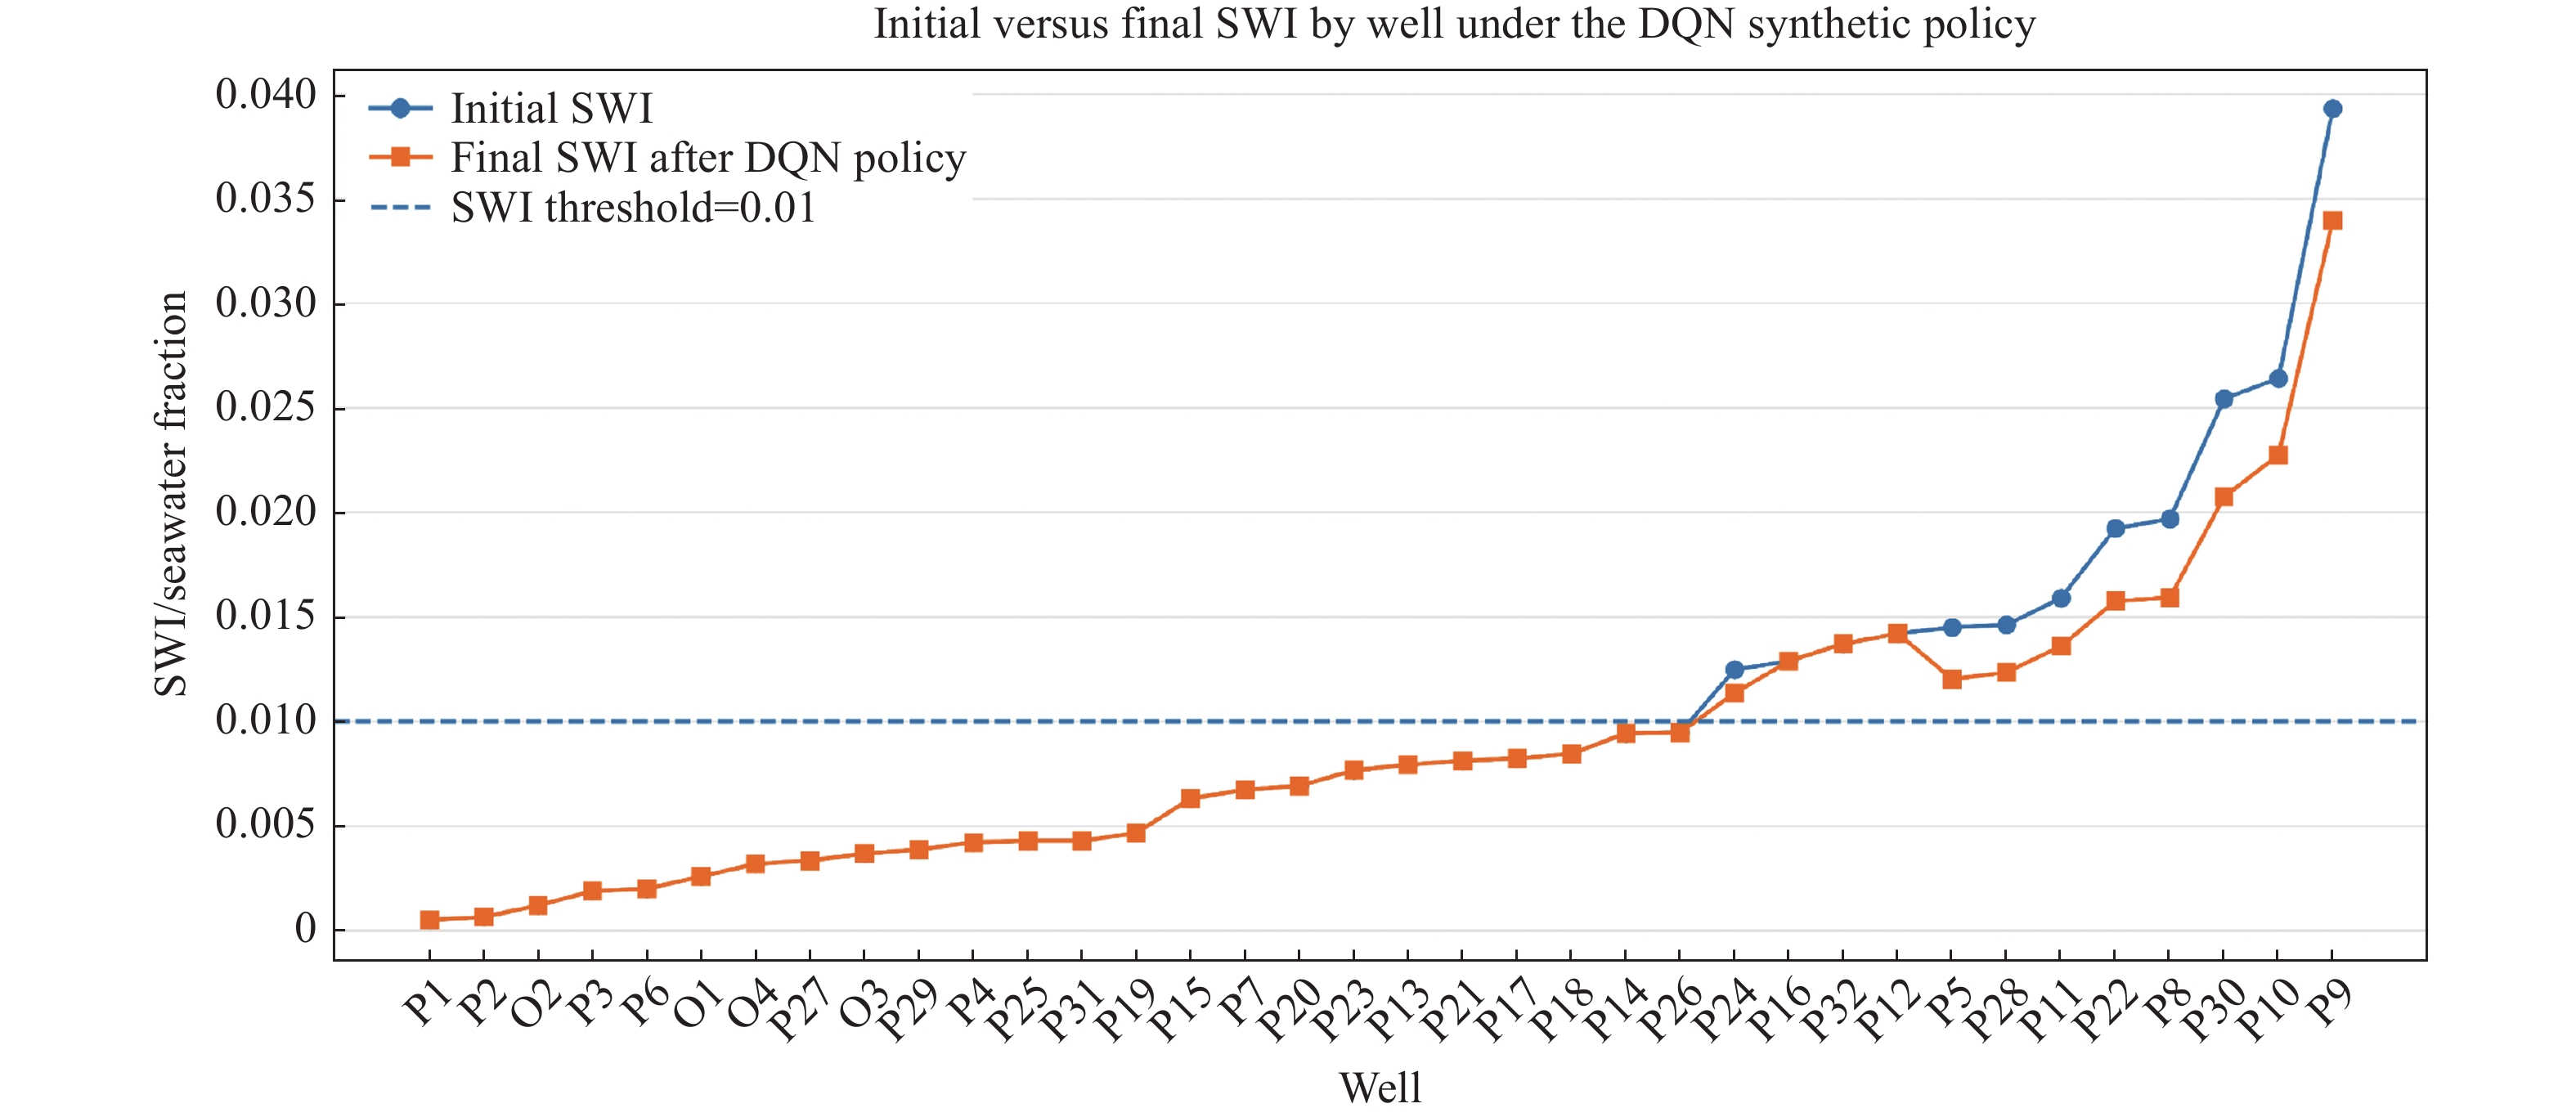
Figure 8. Initial and post-management SWI values by well under the DQN synthetic policy. The horizontal dashed line indicates the SWI threshold of 0.01
Notes: The figure shows that the DQN policy reduced SWI in affected wells but did not bring all moderate- and high-SWI wells below the threshold
Table 1. Exact descriptive statistics of the hydrochemical dataset used in the ML–RL framework
Parameter N Missing Min Max Mean Median Std Dev TDS (mg/L) 36 0 416.00 1689.00 872.42 768.00 301.94 Temperature (°C) 32 4 23.00 27.60 25.51 25.35 1.27 pH 32 4 7.28 8.17 7.62 7.61 0.20 EC (µS/cm) 32 4 409.00 3,050.00 1156.84 950.00 552.08 Ca2+ (mg/L) 36 0 54.00 215.00 106.63 94.00 40.97 Mg2+ (mg/L) 36 0 3.21 98.82 16.37 12.82 16.76 Na+ (mg/L) 36 0 27.59 259.00 110.97 103.50 53.65 K+ (mg/L) 36 0 0.50 83.00 7.65 3.50 14.91 HCO3− (mg/L) 36 0 122.00 414.00 262.48 274.50 61.92 Cl− (mg/L) 36 0 78.10 812.00 251.49 216.20 158.26 SO42− (mg/L) 36 0 0.62 426.48 87.43 72.38 84.81 NO3− (mg/L) 36 0 2.48 96.47 26.61 20.83 20.92 Br− (mg/L) 32 4 0.16 3.69 0.94 0.72 0.83 SWI/Seawater Fraction 36 0 0.0005 0.0393 0.0097 0.0078 0.0084  下载: 导出CSV
Table 2. Chloride ablation analysis of Ridge Regression using leave-one-out cross-validation
Model configuration Validation R2 MAE RMSE MSE Full model including Cl− LOOCV 0.9889 0.000595 0.000870 7.57 × 10⁻⁷ Chloride-excluded model LOOCV 0.9328 0.001498 0.002138 4.57 × 10⁻⁶ Chloride-only model LOOCV 0.9992 0.000178 0.000236 5.56 × 10⁻⁸
下载: 导出CSV
Table 3. Repeated 5-fold cross-validation uncertainty analysis of Ridge Regression models
Model
configurationValidation R2 MAE RMSE MSE Full model including Cl− Repeated 5-fold CV, 20 repeats 0.965 ± 0.045 7.69 × 10⁻⁴ ± 3.43 × 10⁻⁴ 1.03 × 10⁻³ ± 4.63 × 10⁻⁴ 1.27 × 10⁻⁶ ± 1.28 × 10⁻⁶ Chloride-excluded model Repeated 5-fold CV, 20 repeats 0.831 ± 0.206 1.76 × 10⁻³ ± 6.47 × 10⁻⁴ 2.35 × 10⁻³ ± 8.72 × 10⁻⁴ 6.28 × 10⁻⁶ ± 5.00 × 10⁻⁶ Chloride-only model Repeated 5-fold CV, 20 repeats 0.9986 ± 0.0007 2.14 × 10⁻⁴ ± 6.02 × 10⁻⁵ 2.67 × 10⁻⁴ ± 9.57 × 10⁻⁵ 8.05 × 10⁻⁸ ± 5.95 × 10⁻⁸
下载: 导出CSV
Table 4. Standardized Ridge coefficients and Random Forest feature importance for SWI prediction
Feature Standardized Ridge coefficient Absolute coefficient Random Forest importance Cl− 0.005101 0.005101 0.5567 TDS 0.002216 0.002216 0.1481 SO42− −0.000999 0.000999 0.0027 Mg2+ 0.000696 0.000696 0.0215 HCO3− −0.000555 0.000555 0.0042 Na+ 0.000435 0.000435 0.0484 Ca2+ 0.000419 0.000419 0.0035 NO3− −0.000316 0.000316 0.0029 Br− 0.000147 0.000147 0.0448 EC 0.000097 0.000097 0.1597 K+ 0.000054 0.000054 0.0025 Temperature −0.000049 0.000049 0.0005 pH 0.000001 0.000001 0.0045
下载: 导出CSV
Table 5. Comparison of DQN policy with baseline management strategies in the synthetic surrogate environment
Management strategy Mean initial
SWIMean final
SWIMean per-well SWI reduction (%) Water preserved (%) Wells above threshold before Wells above threshold after Mean reward No-action baseline 0.00967 0.00967 0.00 100.00 12 12 −0.301 Threshold-based rule 0.00967 0.00885 4.10 89.17 12 12 −0.273 DQN policy – synthetic surrogate 0.00967 0.00886 3.86 90.58 12 12 −0.267 Notes: SWI reduction (%) was calculated as the average of well-level percentage reductions across all wells, rather than as the percentage difference between the mean initial SWI and the mean final SWI.
下载: 导出CSV
Table 6. Summary of SWI reduction, pumping reduction, water preservation, and rewards by SWI range
SWI range Wells Wells (%) Avg. old SWI Avg. new SWI Avg. SWI reduction (%) Avg. pumping reduction (%) Avg. water supply (%) Avg. terminal reward score Wells above threshold after Low (SWI ≤ 0.01) 24 66.7 0.00499 0.00499 0.00 0.00 100.00 0.000 0 Moderate (0.01 < SWI ≤ 0.02) 9 25.0 0.01525 0.01353 10.36 24.33 75.67 −0.475 9 High (SWI > 0.02) 3 8.3 0.03038 0.02582 15.30 40.00 60.00 −1.782 3
下载: 导出CSV
-
Aguedai H, Jelbi M, Lahlou F, et al. 2022. Hydrochemical and geophysical characterization of the Mnasra coastal aquifers (Rharb Basin, NW Morocco). Arabian Journal of Geosciences, 15: 1480. DOI: 10.1007/s12517-022-10738-7. Aguedai H, Lahlou F, El Mansouri B. 2020. Intrusion zones identification in the Mnasra aquifer (Morocco) using the seawater intrusion models and the geophysics data. In: Jarar Oulidi H, Fadil A, Semane NE. Geospatial Technology: Application in Water Resources Management. Springer, Cham: 51–68. DOI: 10.1007/978-3-030-24974-8_4. Appelo CAJ, Postma D. 2004. Geochemistry, groundwater and pollution. 2nd ed. London: CRC Press: 22-39. DOI: 10.1201/9781439833544. Ayers RS, Westcot DW. 1985. Water quality for agriculture. 2nd ed. FAO Irrigation and Drainage Paper 29 Rev. 1. Rome: Food and agriculture organization of the United Nations: 2-13. Bahir M, El Mountassir O, Chehbouni A, et al. 2022. Hydrogeochemical and isotopic assessment for characterizing groundwater quality and recharge processes in the Essaouira Basin, northwestern Morocco. Arabian Journal of Geosciences, 15: 603. DOI: 10.1007/s12517-022-09817-6. Bear J, Cheng AHD, Sorek S, et al. 1999. Seawater intrusion in coastal aquifers: Concepts, Methods and Practices. Springer, Dordrecht: 30-46. DOI: 10.1007/978-94-017-2969-7. Chalouan A, Galindo-Zaldívar J, Akil M, et al. 2006. Tectonic wedge escape in the southwestern front of the Rif Cordillera (Morocco). Geological Society London Special Publications, 262(1): 101−118. DOI: 10.1144/GSL.SP.2006.262.01.06. Chen X, Wang M, Zhang H. 2011. The use of classification trees for bioinformatics. WIREs Data Mining and Knowledge Discovery, 1(1): 55−63. DOI: 10.1002/widm.14. Cirac P. 1985. Le bassin sud-rifain occidental au Néogène supérieur: évolution de la dynamique sédimentaire et de la paléogéographie au cours d'une phase de comblement. Université Bordeaux 1, Bordeaux. (in French Combe M. 1975. Le bassin Gharb-Maâmora et les petits bassins septentrionaux des oueds Dradère et Souire//Ressources en eau du Maroc, Tome 2: Plaines et bassins du Maroc Atlantique. Notes et Mémoires du Service Géologique du Maroc, 231(2): 93–128. (in French El Bilali A, Taleb A, Nafii A, et al. 2021. Prediction of sodium adsorption ratio and chloride concentration in a coastal aquifer under seawater intrusion using machine learning models. Environmental Technology and Innovation, 23: 101641. DOI: 10.1016/j.eti.2021.101641. El Bouhaddioui M, Mridekh A, Kili M, et al. 2016. Electrical and well log study of the Plio-Quaternary deposits of the southern part of the Rharb Basin, northern Morocco. Journal of African Earth Sciences, 123: 110−122. DOI: 10.1016/j.jafrearsci.2016.07.015. El Mansouri B. 1999. Développement d'outils et concepts pour la gestion des eaux souterraines: Application à l'aquifère côtier du Rharb. Université Ibn Tofail, Kénitra. (in French Flinch JF. 1994. Tectonic Evolution of the Gibraltar Arc. Rice University, Houston. Flinch JF, Vail PR. 1999. Plio-Pleistocene sequence stratigraphy and tectonics of the Gibraltar Arc. Mesozoic and Cenozoic Sequence Stratigraphy of European Basins. Tulsa: SEPM Society for Sedimentary Geology: 199–208. DOI: 10.2110/pec.98.02.0199. Friedman JH. 2001. Greedy function approximation: A gradient boosting machine. Annals of Statistics, 29(5): 1189−1232. DOI: 10.1214/aos/1013203451. Géron A. 2019. Hands-On Machine Learning with Scikit-Learn, Keras, and TensorFlow. In: O'Reilly Media, Sebastopol. Goodfellow I, Bengio Y, Courville A. 2016. Deep Learning. Cambridge, MA: MIT Press: 39-50. Grima-Olmedo J, Ballesteros-Navarro B, Pulido-Velazquez D, et al. 2023. A framework to assess natural chloride background in coastal aquifers affected by seawater intrusion in eastern Spain. Water, 15(15): 2728. DOI: 10.3390/w15152728. Kaelbling LP, Littman ML, Moore AW. 1996. Reinforcement learning: A survey. Journal of Artificial Intelligence Research, 4: 237−285. DOI: 10.1613/jair.301. Kili M, El Mansouri B, Chao J, et al. 2006. De nouveaux éléments structuraux du complexe aquifère profond du bassin du Rharb (Maroc): implications hydrogéologiques. Comptes Rendus Geoscience, 338(16): 1194−1202. DOI: 10.1016/j.crte.2006.09.008. Le Roy P, Sahabi M, Maad N, et al. 2014. 3D architecture of Quaternary sediment along the NW Atlantic Moroccan Rharb continental shelf: A stratal pattern under the dual control of tectonics and climatic variations. Marine and Petroleum Geology, 49: 129−142. DOI: 10.1016/j.marpetgeo.2013.10.003. Liu Q, Gui D, Zhang L, et al. 2022. Simulation of regional groundwater levels in arid regions using interpretable machine learning models. Science of the Total Environment, 831: 154902. DOI: 10.1016/j.scitotenv.2022.154902. McDonald GC. 2009. Ridge regression. WIREs Computational Statistics, 1(1): 93−100. DOI: 10.1002/wics.14. Mnih V, Kavukcuoglu K, Silver D, et al. 2015. Human-level control through deep reinforcement learning. Nature, 518(7540): 529−533. DOI: 10.1038/nature14236. Morel JL. 1987. Évolution récente de l'orogène rifain et de son avant-pays depuis la fin de la mise en place des nappes (Rif, Maroc). Paris: Université Paris: 11. Mridekh A, El Bouhaddioui M, Magrane B, et al. 2016. Rythme sédimentaire et événements géodynamiques plio-quaternaires du bassin côtier du Rharb (Maroc): Apport de la géophysique//14èmes Journées Nationales Génie Côtier – Génie Civil. Toulon: 283–290. (in French) DOI: 10.5150/jngcgc.2016.032. Oude Essink GHP. 2001. Improving fresh groundwater supply: Problems and solutions. Ocean and Coastal Management, 44(5-6): 429−449. DOI: 10.1016/S0964-5691(01)00057-6. Sahour H, Gholami V, Vazifedan M. 2020. A comparative analysis of statistical and machine learning techniques for mapping the spatial distribution of groundwater salinity in a coastal aquifer. Journal of Hydrology, 591: 125321. DOI: 10.1016/j.jhydrol.2020.125321. Trabelsi R, Abid K, Zouari K, et al. 2012. Groundwater salinization processes in shallow coastal aquifer of Djeffara Plain of Medenine, southeastern Tunisia. Environmental Earth Sciences, 66(2): 641−653. DOI: 10.1007/s12665-011-1273-8. Wernli R. 1988. Micropaléontologie du Néogène post-nappes du Maroc septentrional et description systématique des foraminifères planctoniques. Éditions du Service Géologique du Maroc, Rabat. (in French -

 点击查看大图
计量
- 文章访问数: 8
- HTML全文浏览量: 3
- PDF下载量: 0
- 被引次数: 0


