 E-mail alert
 Rss
Rss

Carbon, nitrogen and phosphorus coupling relationships and their influencing factors in the critical zone of Dongting Lake wetlands, China
-
Abstract: Wetland is a transition zone between terrestrial and aquatic ecosystems, and is the source and sink of various biogenic elements in the earth’s epipelagic zone. In order to investigate the driving force and coupling mechanism of carbon (C), nitrogen (N) and phosphorus (P) migration in the critical zone of lake wetland, this paper studies the natural wetland of Dongting Lake area, through measuring and analysing the C, N and P contents in the wetland soil and groundwater. Methods of Pearson correlation, non-linear regression and machine learning were employed to analyse the influencing factors, and to explore the coupling patterns of the C, N and P in both soils and groundwater, with data derived from soil and water samples collected from the wetland critical zone. The results show that the mean values of organic carbon (TOC), total nitrogen (TN) and total phosphorus (TP) in groundwater are 1.59 mg/L, 4.19 mg/L and 0.5 mg/L, respectively, while the mean values of C, N and P in the soils are 18.05 g/kg, 0.86 g/kg and 0.52 g/kg. The results also show that the TOC, TN and TP in the groundwater are driven by a variety of environmental factors. However, the concentrations of C, N and P in the soils are mainly related to vegetation abundance and species which influence each other. In addition, the fitted curves of wetland soil C-N and C-P appear to follow the power function and S-shaped curve, respectively. In order to establish a multivariate regression model, the soil N and P contents were used as the input parameters and the soil C content used as the output one. By comparing the prediction effects of machine learning and nonlinear regression modelling, the results show that coupled relationship equation for the C, N and P contents is highly reliable. Future modelling of the coupled soil and groundwater elemental cycles needs to consider the complexity of hydrogeological conditions and to explore the quantitative relationships among the influencing factors and chemical constituents.
-
Key words:
- Dongting Lake /
- Wetland critical zone /
- Carbon /
- Nitrogen and phosphorus /
- Driving factors /
- Coupling mechanisms
-

Figure 1. Soil sampling sites in the lake wetland critical zone of the Poyang Lake region, Southern China; LS – Lishui; YJ – Yuanjiang; ZS – Zishui; XJ – Xiangjiang

Figure 3. Spatial distribution of soil C, N, P in wetland critical zones (a, c, e belongs to P1 section, b, d, f belongs to P2 section)

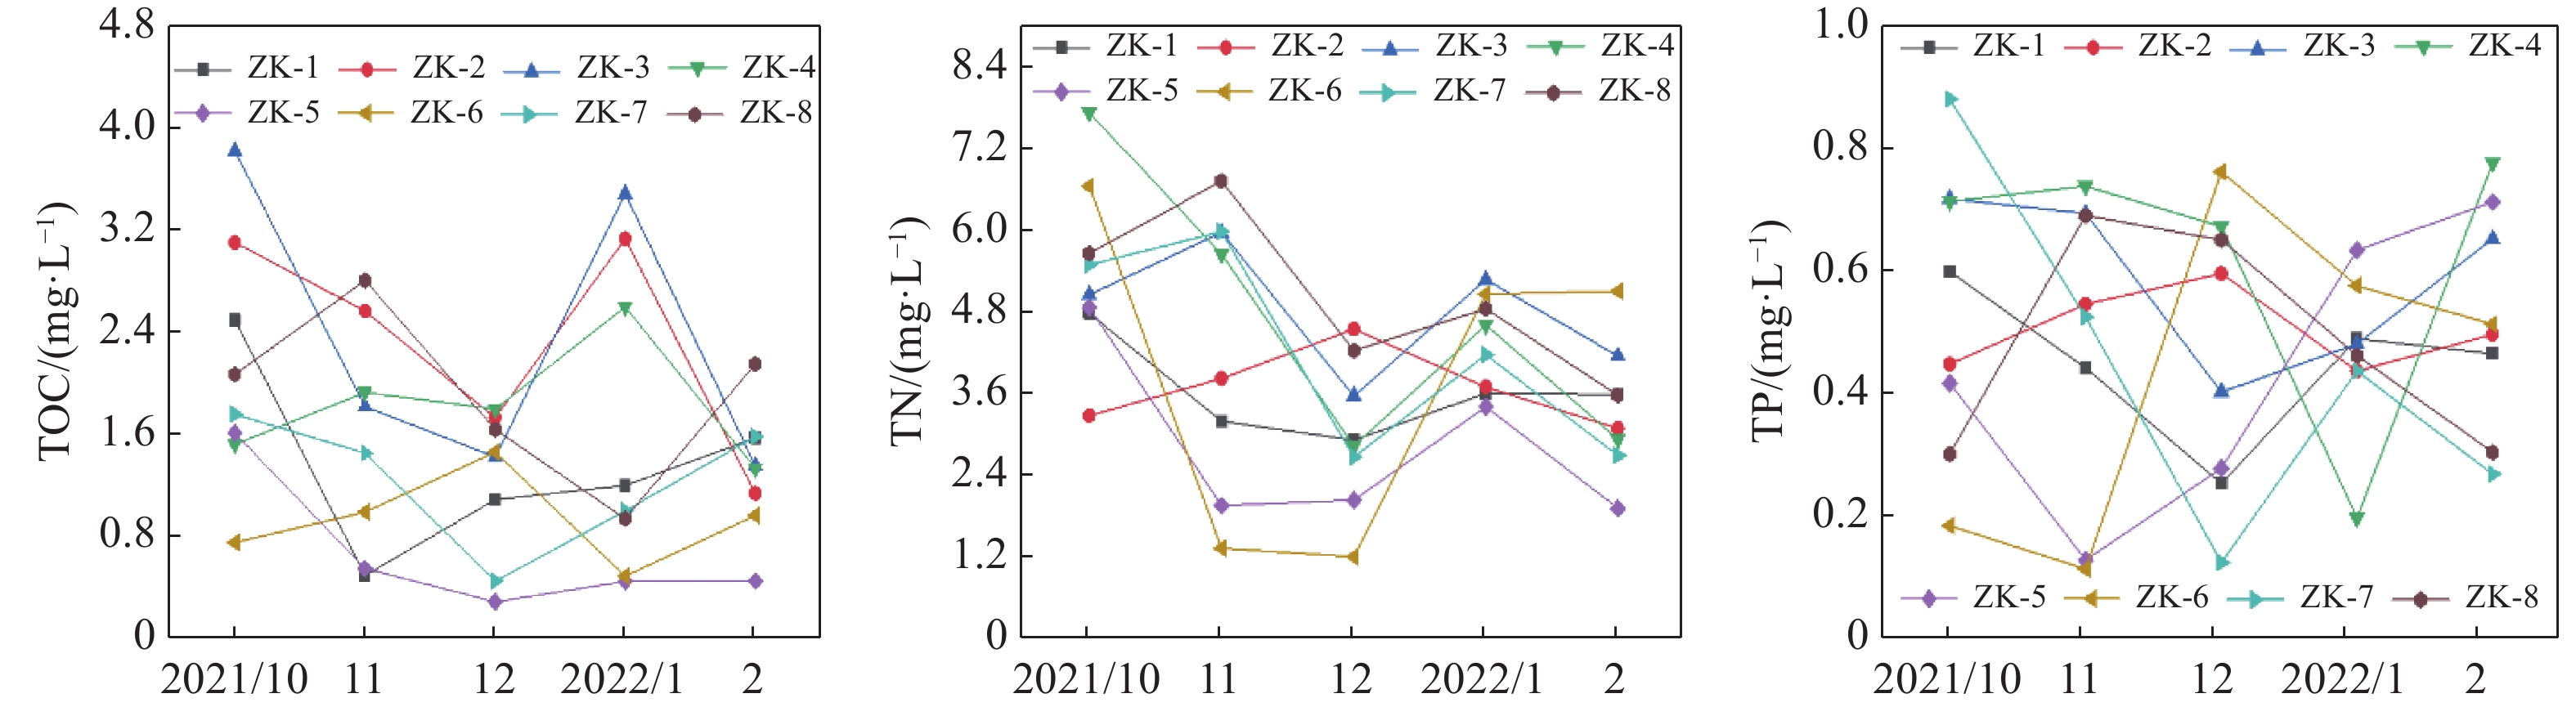
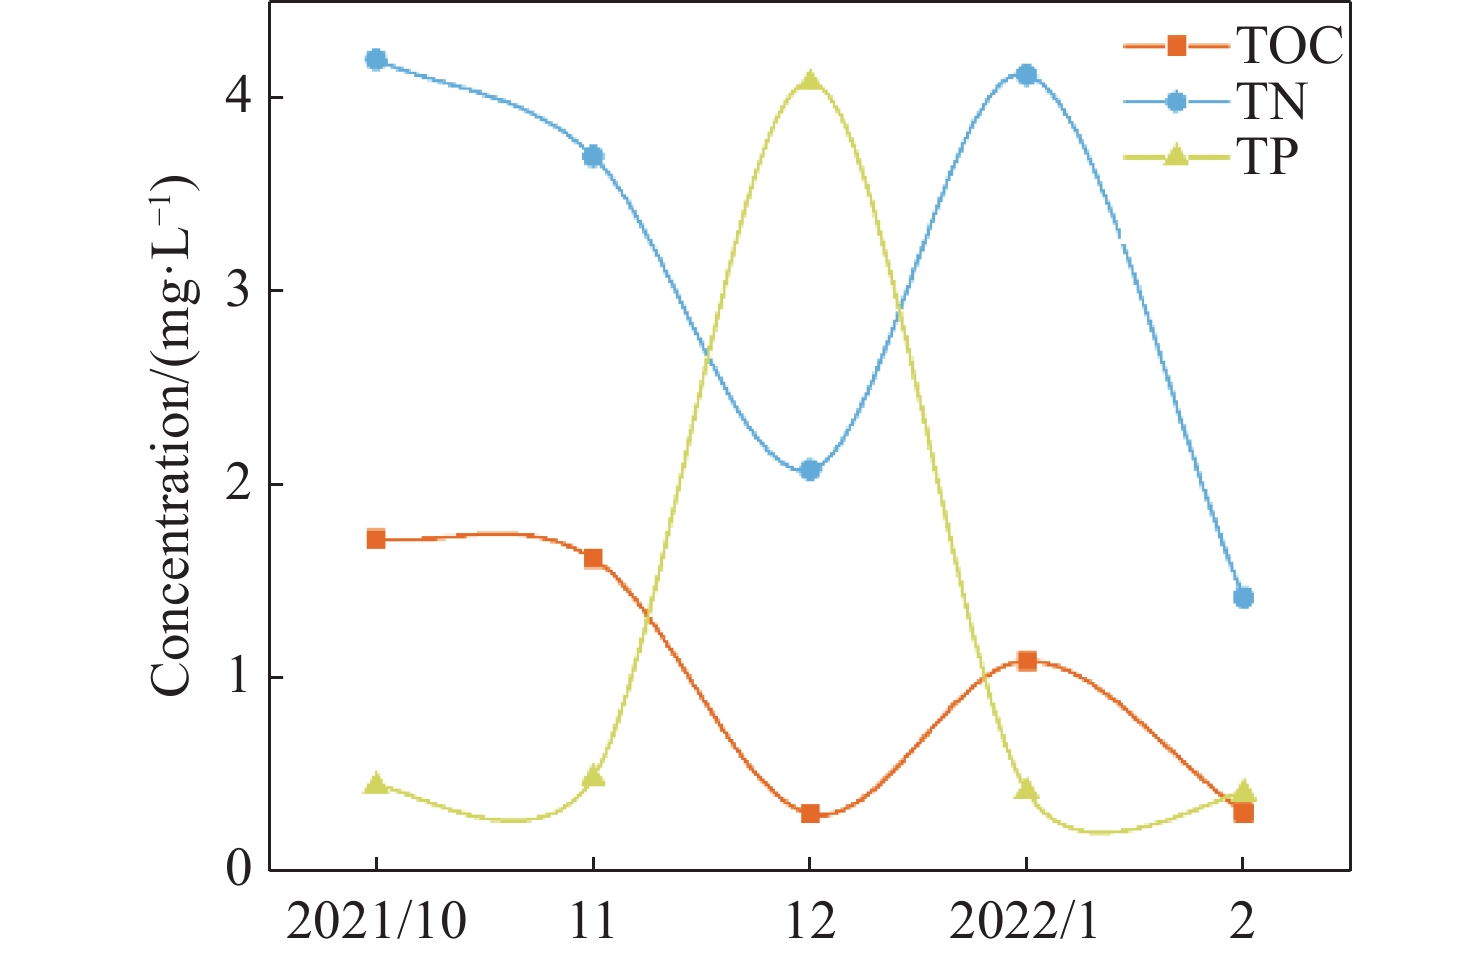
Figure 4. Temporal and spatial changes of TOC, TN and TP in groundwater in wetland critical zone

Figure 6. Correlation coefficient between C, N, P contents and physical and chemical factors in soil and groundwater of wetland critical zone
*P<0.05, **P<0.01, ***P<0.001

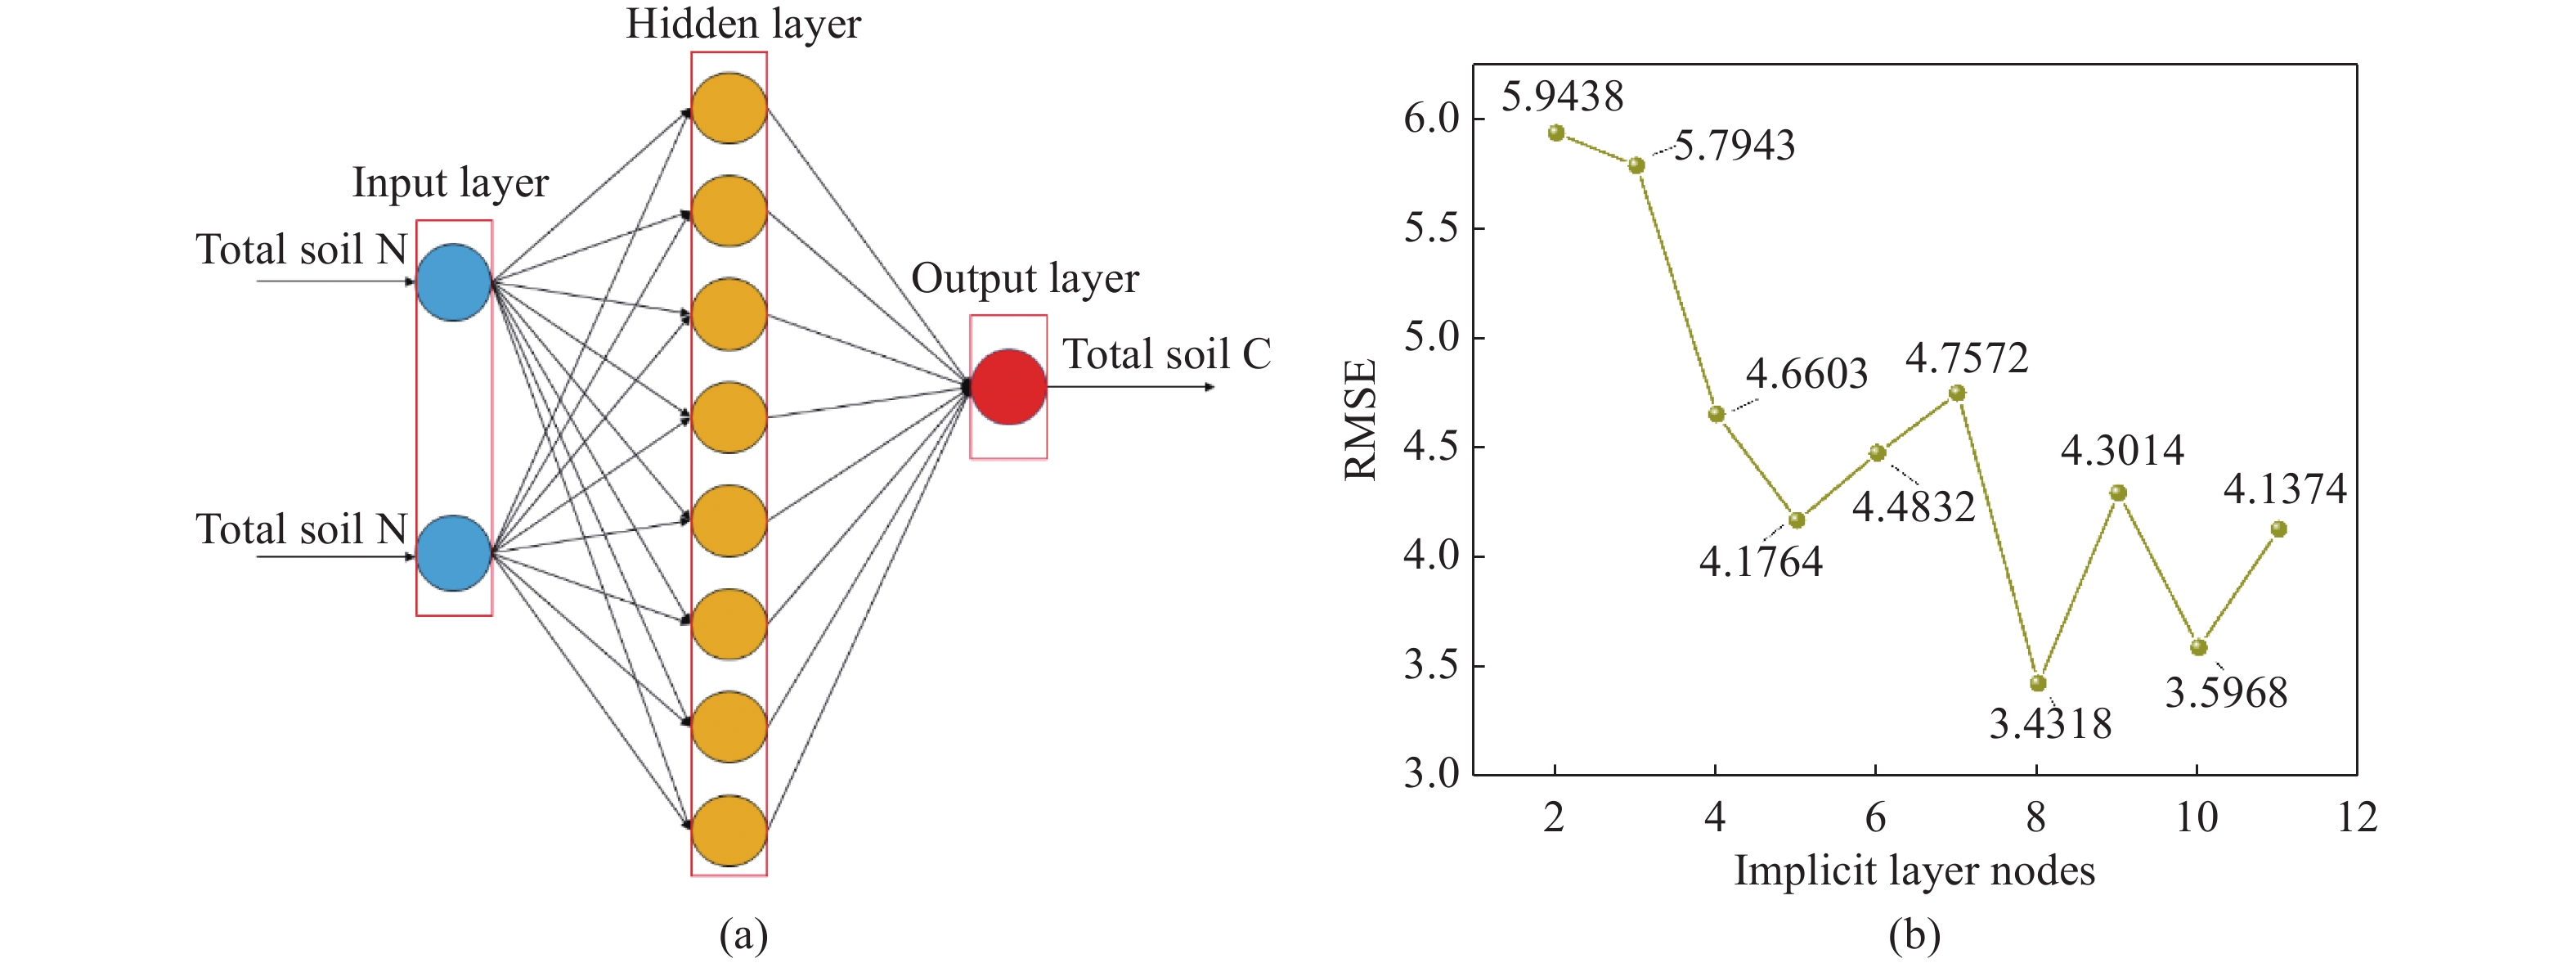
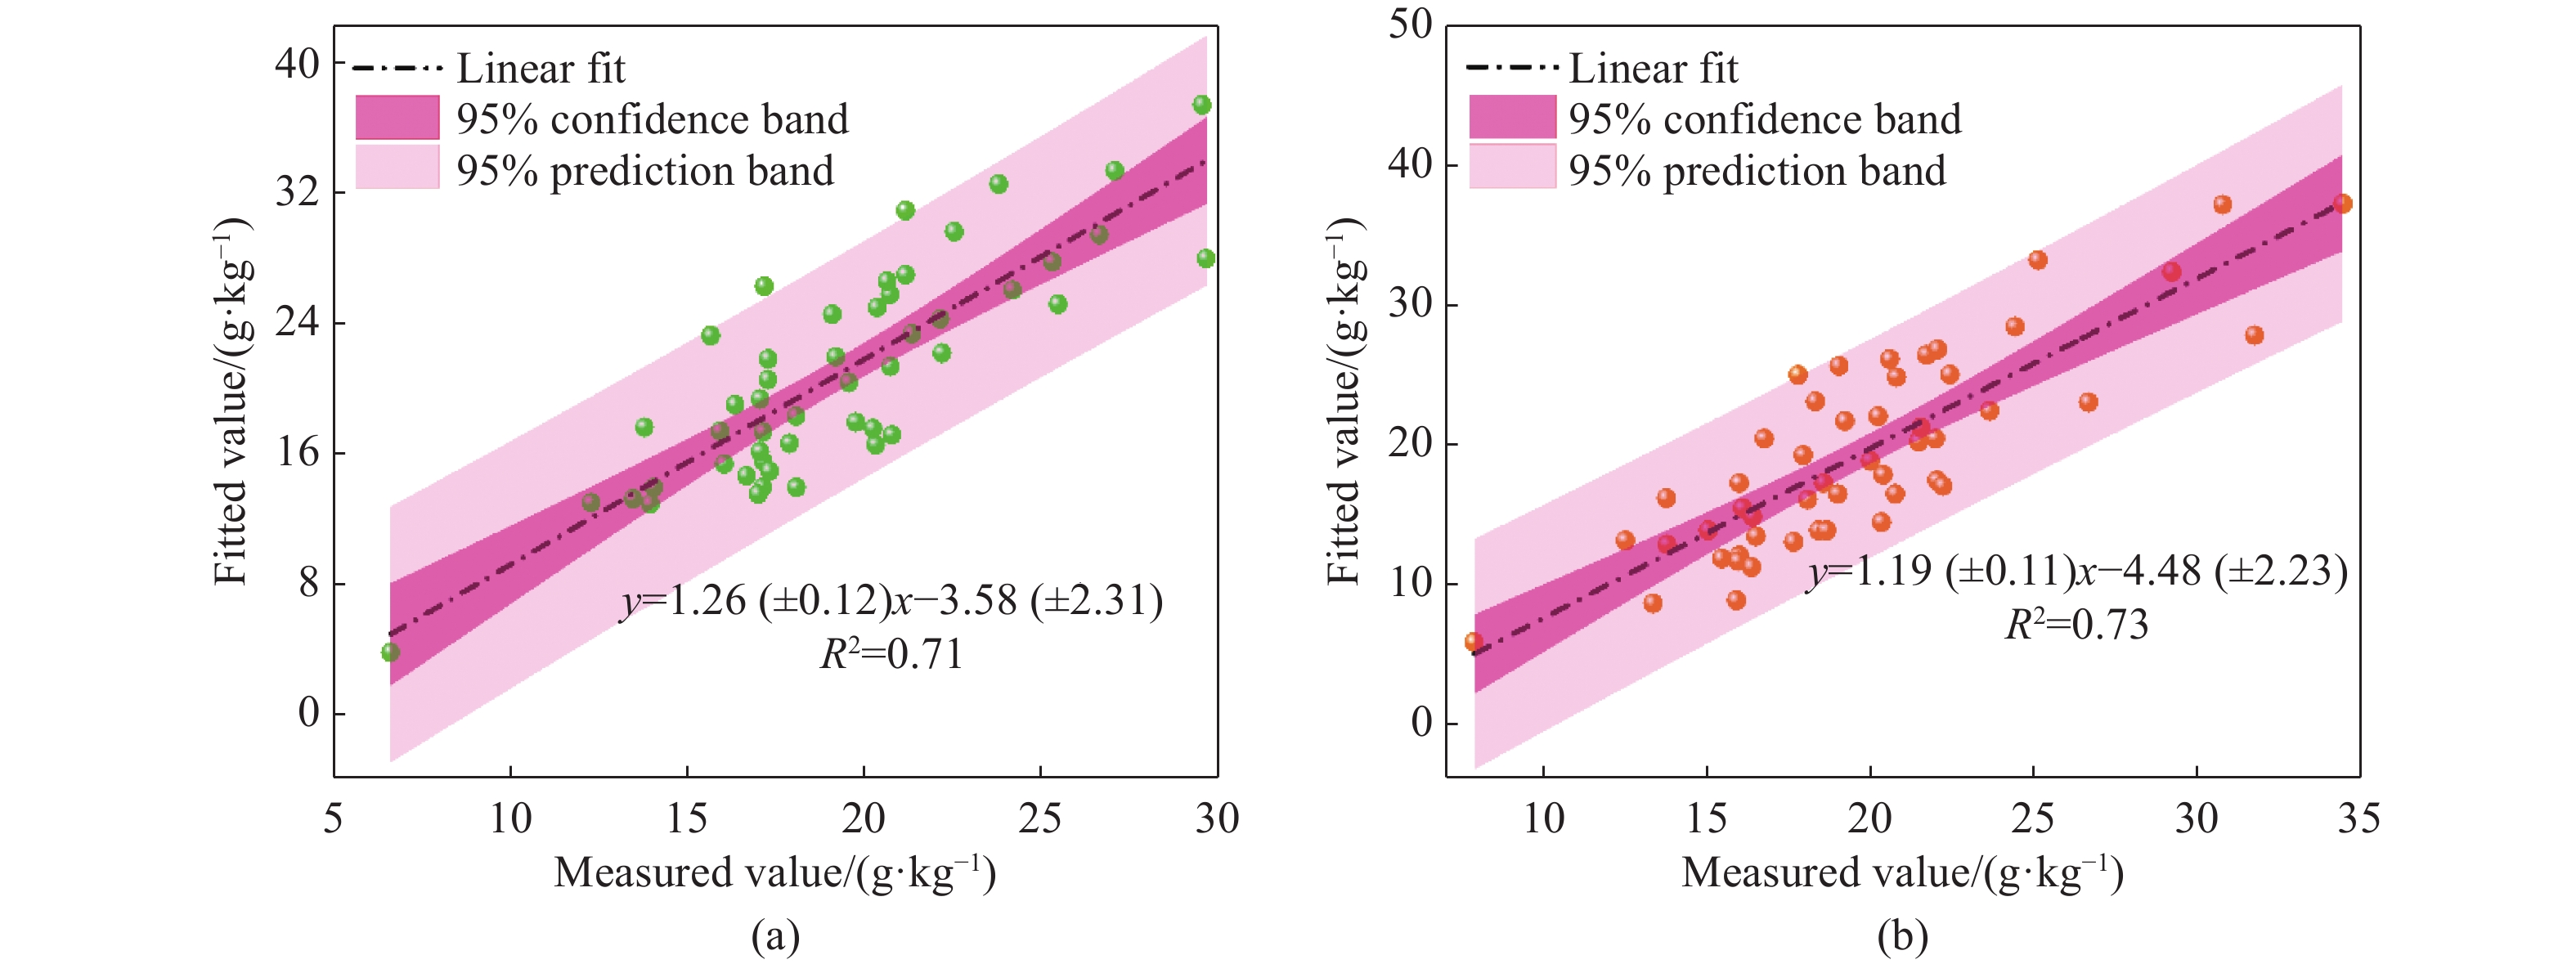
Figure 7. The 1:1 relationship between measured and fitted values of soil C based on machine learning and nonlinear fitting (where A and B are scatterplots based on BP neural network and nonlinear regression fitting respectively)

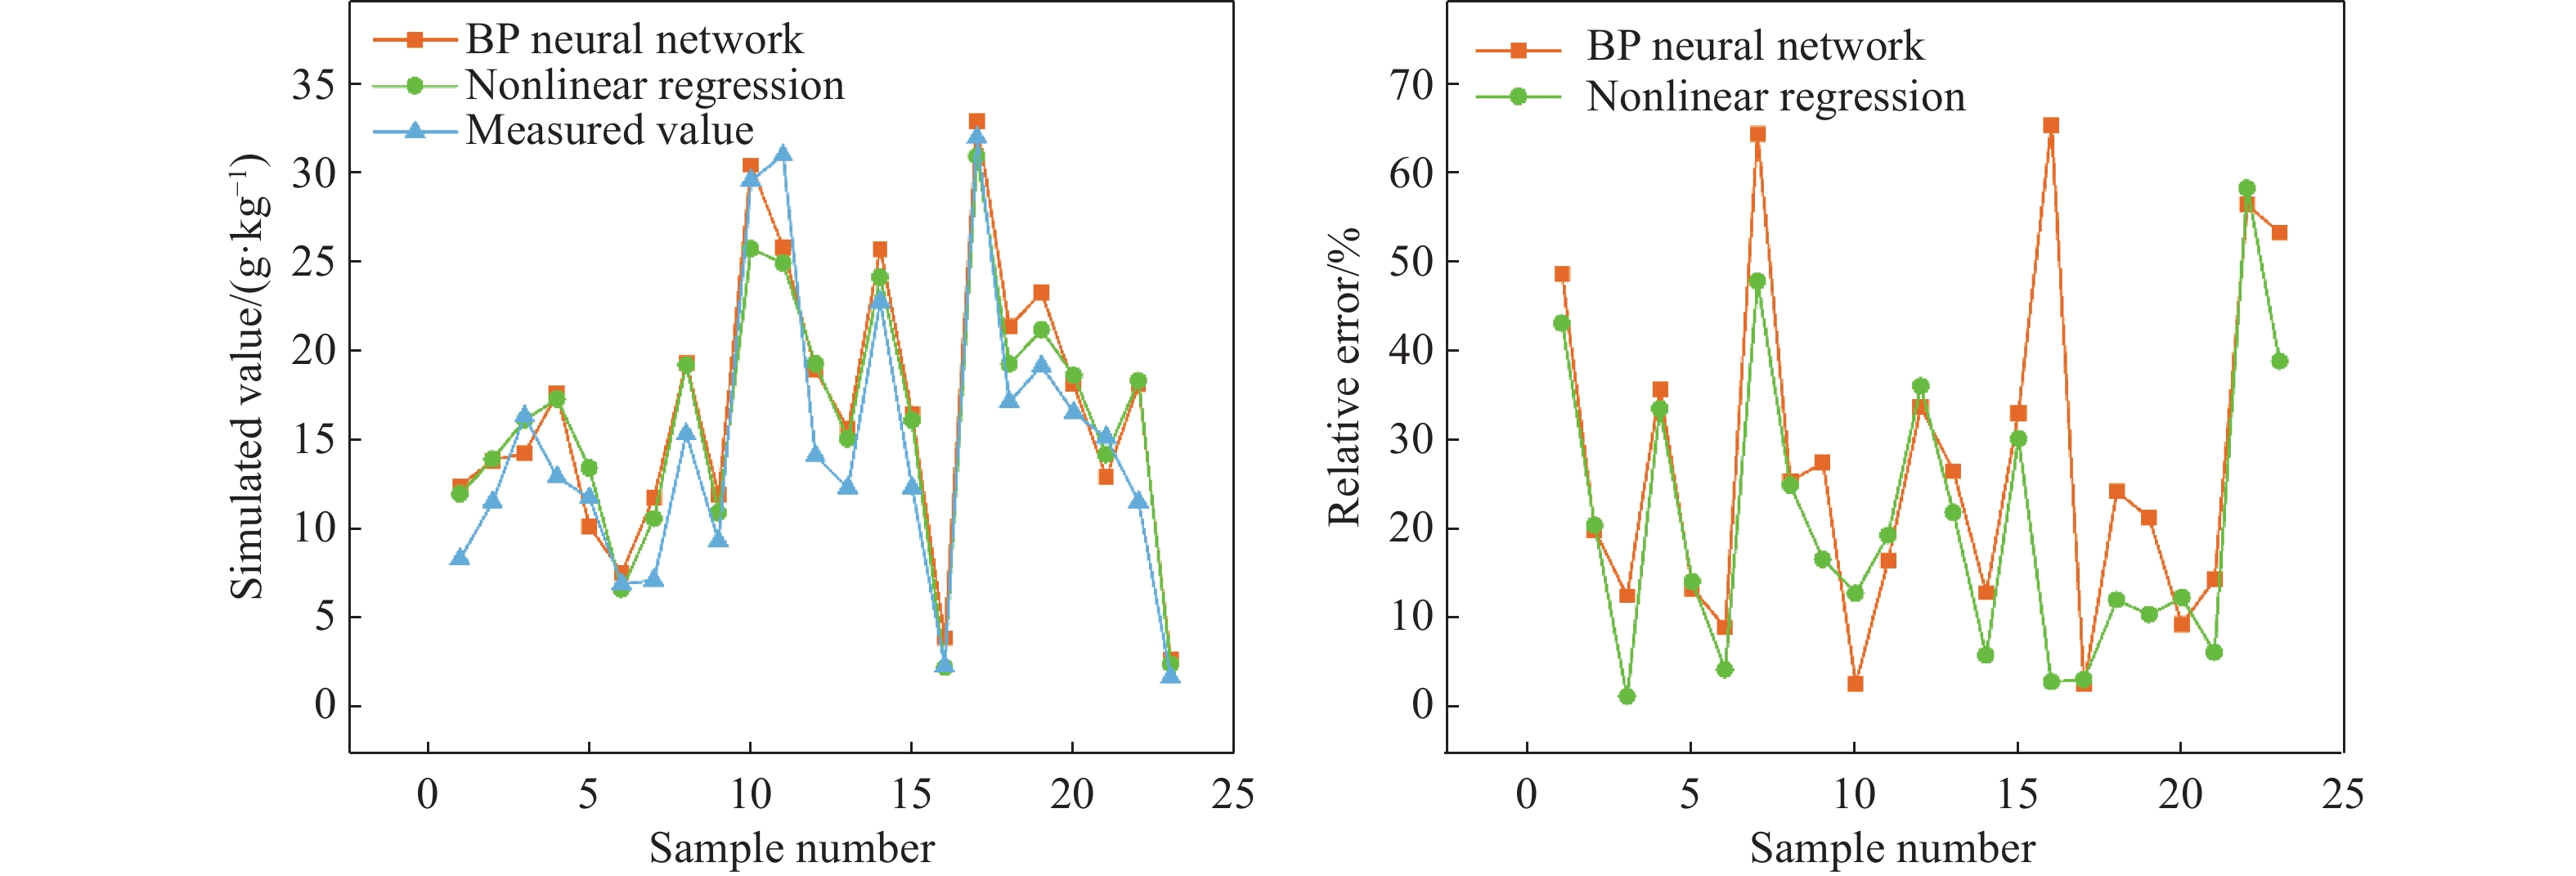
Figure 8. Prediction of soil C content and relative error results in wetland critical zone
Table 1. Physical and chemical properties of wetland critical zones on different monitoring profiles
Profile Soil
pH
W(%)Groundwater
pH
DO(mg/L)
Eh(mV)T(°C) P1 5.8a 33.2a 7.1a 2.5a 2.6a 19.3a P2 6.8b 31.6a 6.5a 3.1b 33.4b 18.8a Note: Letters in the table indicate significant differences in different places in the same column (P < 0.05).  下载: 导出CSV
Table 2. Hydraulic conductivity of soil layers at depth in wetland critical zone (after Wei et al., 1989)
profile P1 profile P2 Depth Type of soil layer Depth Type of soil layer 0–3 m Silt clay,K: 1.2×10⁻⁶–6.0×10⁻⁵ cm/s 0–0.8 m Sandy soil,K: 6.0×10⁻⁵–6.0×10⁻⁴ cm/s 3–4 m Clay,K: < 1.2×10⁻⁶ cm/s 0.8–8 m Silt clay,K: 1.2×10⁻⁶–6.0×10⁻⁵ cm/s 4–10 m Silt clay,K: 1.2×10⁻⁶–6.0×10⁻⁵ cm/s 8–10 m Clay,K: < 1.2×10⁻⁶ cm/s
下载: 导出CSV
Table 3. Statistical characteristics of C, N and P in different soil profiles
Profile Soil C Soil N Soil P Range
(g/kg)Mean
(g/kg)Variation coefficients
(%)Range
(g/kg)Mean
(g/kg)Variation coefficients
(%)Range
(g/kg)Mean
(g/kg)Variation coefficients
(%)P1 5.81–37.24 20.34a 47.54 0.23–1.89 0.90a 37.31 0.19–1.03 0.52a 34.67 P2 1.80–32.19 15.86b 42.10 0.08–1.56 0.82b 35.11 0.15–0.74 0.52a 30.57 Average 18.05 44.82 0.86 36.21 0.52 32.62 Note: Different letters represent significant differences in the mean values of each profile (p<0.05), and the same letters represent non-significant differences.
下载: 导出CSV
Table 4. Statistical characteristics of TOC, TN and TP in groundwater of different profiles
profile Groundwater TOC Groundwater TN Groundwater TP Range
(mg/L)Mean
(mg/L)Variation coefficients
(%)Range
(mg/L)Mean
(mg/L)Variation coefficients
(%)Range
(mg/L)Mean
(mg/L)Variation coefficients
(%)P1 0.49–3.83 1.94a 56.24 2.81–7.74 4.22a 27.45 0.20–0.78 0.44a 22.08 P2 0.29–2.81 1.24b 43.54 1.17–6.73 4.16a 33.33 0.11–0.88 0.55b 50.13 Avrage 1.59 49.89 4.19 30.39 0.49 36.11 Note: Different letters represent significant differences in the mean values of each profile (p < 0.05), and the same letters represent non-significant differences.
下载: 导出CSV
Table 5. C-N and C-P fitting model results
Equation C-N model summary C-P model summary R2 F Significance R2 F Significance Linear 0.481 65.864 0 0.302 30.745 0 Logarithmic 0.412 49.701 0 0.303 30.844 0 Inverse 0.229 21.087 0 0.27 26.291 0 Quadratic 0.481 32.469 0 0.302 15.177 0 Cubic 0.481 21.337 0 0.331 11.382 0 Composite 0.537 82.291 0 0.34 36.501 0 Power 0.752 143.159 0 0.521 61.65 0 S-curve 0.549 86.602 0 0.571 73.243 0 Growth 0.537 82.291 0 0.34 36.501 0 Exponential 0.537 82.291 0 0.34 36.501 0 Logistic 0.537 82.291 0 0.34 36.501 0
下载: 导出CSV
Table 6. Model evaluation indicators
Model Sample size RMSE MRE MAE BP Neural Network 23 3.43 0.27 3.03 Non-linear regression 23 3.18 0.21 2.61
下载: 导出CSV
-
Andersson S, Nilsson SI, Saetre P. 2000. Leaching of dissolved organic carbon (DOC) and dissolved organic nitrogen (DON) in mor humus as affected by temperature and pH. Soil Biology and Biochemistry, 32(1): 1−10. doi: 10.1016/S0038-0717(99)00103-0 Archontoulis SV, Miguez FE. 2015. Nonlinear regression models and applications in agricultural research. Agronomy Journal, 107(2): 786−798. doi: 10.2134/agronj2012.0506 Beisner KR, Solder JE, Tillman FD, et al. 2020. Geochemical characterization of groundwater evolution south of Grand Canyon, Arizona (USA). Hydrogeology Journal, 28(5): 1615−1633. doi: 10.1007/s10040-020-02192-0 Brantley SL, McDowell WH, Dietrich WE, et al. 2017. Designing a network of critical zone observatories to explore the living skin of the terrestrial Earth. Earth Surf Dynam, 5(4): 841−860. doi: 10.5194/esurf-5-841-2017 Bremner JM, Mulvaney CS, 1982. Nitrogen-total. In: Page AL, Miller RH, Keeney DR (Eds. ), ‘Methods of Soil Analysis. Part 2’. Agronomy Monograph 9. ASA and SSSA, Madison, WI. 595–614. Brooks PD, Chorover J, Fan Y, et al. 2015. Hydrological partitioning in the critical zone: Recent advances and opportunities for developing transferable understanding of water cycle dynamics. Water Resources Research, 51(9): 6973−6987. doi: 10.1002/2015WR017039 Cleveland CC, Liptzin D. 2007. C: N: P stoichiometry in soil: Is there a “Redfield ratio” for the microbial biomass? Biogeochemistry, 85(3): 235–252. Craine JM, Jackson RD. 2010. Plant nitrogen and phosphorus limitation in 98 North American grassland soils. Plant and Soil, 334(1): 73−84. doi: 10.1007/s11104-009-0237-1 Cui K, Jing X. 2019. Research on prediction model of geotechnical parameters based on BP neural network. Neural Computing and Applications, 31(12): 8205−8215. doi: 10.1007/s00521-018-3902-6 Cui Y, Xiao R, Xie Y, et al. 2018. Phosphorus fraction and phosphate sorption-release characteristics of the wetland sediments in the Yellow River Delta. Physics and Chemistry of the Earth, Parts A/B/C, 103: 19–27. Fan Y. 2015. Groundwater in the Earth’s critical zone: Relevance to large-scale patterns and processes. Water Resources Research, 51(5): 3052−3069. doi: 10.1002/2015WR017037 Fadiran AO, Diamini SC, Mavuso A. 2008. A comparative study of the phosphate levels in some surface and ground water bodies of Swaziland. Bulletin of the Chemical Society of Ethiopia, 22(2): 197−206. doi: 10.4314/bcse.v22i2.61286 Goldhaber MB, Mills C, Stricker CA, et al. 2011. The role of critical zone processes in the evolution of the Prairie Pothole Region wetlands. Applied Geochemistry, 26: S32−S35. doi: 10.1016/j.apgeochem.2011.03.022 Goldhaber MB, Mills CT, Morrison JM, et al. 2014. Hydrogeochemistry of prairie pothole region wetlands: Role of long-term critical zone processes. Chemical Geology, 387: 170−183. doi: 10.1016/j.chemgeo.2014.08.023 Goll DS, Brovkin V, Parida BR, et al. 2012. Nutrient limitation reduces land carbon uptake in simulations with a model of combined carbon, nitrogen and phosphorus cycling. Biogeosciences, 9(9): 3547−3569. doi: 10.5194/bg-9-3547-2012 Guo C, Li J, Li H, et al. 2019. Influences of stormwater concentration infiltration on soil nitrogen, phosphorus, TOC and their relations with enzyme activity in rain garden. Chemosphere, 233: 207−215. doi: 10.1016/j.chemosphere.2019.05.236 Herbert ER, Schubauer-Berigan JP, Craft CB. 2020. Effects of 10 yr of nitrogen and phosphorus fertilization on carbon and nutrient cycling in a tidal freshwater marsh. Limnology and Oceanography, 65(8): 1669−1687. doi: 10.1002/lno.11411 He Y, Tao W, Wang Z, et al. 2012. Effects of pH and seasonal temperature variation on simultaneous partial nitrification and anammox in free-water surface wetlands. Journal of Environmental Management, 110: 103−109. doi: 10.1016/j.jenvman.2012.06.009 Hu M, Sardans J, Le Y, et al. 2022. Effects of wetland types on dynamics and couplings of labile phosphorus, iron and sulfur in coastal wetlands during growing season. Science of The Total Environment, 830: 154460. doi: 10.1016/j.scitotenv.2022.154460 Junk WJ, An S, Finlayson CM, et al. 2013. Current state of knowledge regarding the world’s wetlands and their future under global climate change: A synthesis. Aquatic Sciences, 75(1): 151−167. doi: 10.1007/s00027-012-0278-z Kim SY, Veraart AJ, Meima-Franke M, et al. 2015. Combined effects of carbon, nitrogen and phosphorus on CH4 production and denitrification in wetland sediments. Geoderma, 259–260: 354–361. Lai X, Jiang J, Huang Q. 2013. Effects of the normal operation of the Three Gorges Reservoir on wetland inundation in Dongting Lake, China: A modelling study. Hydrological Sciences Journal, 58(7): 1467–1477. Lewis DB, Feit SJ. 2015. Connecting carbon and nitrogen storage in rural wetland soil to groundwater abstraction for urban water supply. Global Change Biology, 21(4): 1704−1714. doi: 10.1111/gcb.12782 Liang Q, Chen T, Wang Y, et al. 2022. Seasonal variation in release characteristics and mechanisms of sediment phosphorus to the overlying water in a free water surface wetland, southwest China. Environmental Pollution, 308: 119612. doi: 10.1016/j.envpol.2022.119612 Lin H. 2010. Earth’s critical zone and hydropedology: Concepts, characteristics, and advances. Hydrology Earth System Sciences Discussions, 14(1): 25−45. doi: 10.5194/hess-14-25-2010 Liu H, Yang SY, Zhang QG, et al. 2013. Research on carbon sequestration and exchange with atmosphere of representative reed ecosystem in wetland. Advanced Materials Research, 864–867: 1021–1024. Long X, Lin H, An X, et al. 2022. Evaluation and analysis of ecosystem service value based on land use/cover change in Dongting Lake wetland. Ecological Indicators, 136: 108619. doi: 10.1016/j.ecolind.2022.108619 Lu Q, Bai J, Zhang G, et al. 2018. Spatial and seasonal distribution of carbon, nitrogen, phosphorus, and sulfur and their ecological stoichiometry in wetland soils along a water and salt gradient in the Yellow River Delta, China. Physics and Chemistry of the Earth, Parts A/B/C, 104: 9–17. Lu X, Yan Y, Sun J, et al. 2015. Carbon, nitrogen, and phosphorus storage in alpine grassland ecosystems of Tibet: Effects of grazing exclusion. Ecology and Evolution, 5(19): 4492−4504. doi: 10.1002/ece3.1732 Ma M, Zhu Y, Wei Y, et al. 2021. Soil nutrient and vegetation diversity patterns of Alpine wetlands on the Qinghai-Tibetan Plateau. Sustainability, 13(11). Manzoni S, Trofymow JA, Jackson RB, et al. 2010. Stoichiometric controls on carbon, nitrogen, and phosphorus dynamics in decomposing litter. Ecological Monographs, 80(1): 89−106. doi: 10.1890/09-0179.1 Minor J, Pearl JK, Barnes ML, et al. 2019. Critical zone science in the anthropocene: Opportunities for biogeographic and ecological theory and praxis to drive earth science integration. Progress in Physical Geography: Earth and Environment, 44(1): 50−69. doi: 10.1177/0309133319864268 Nelson DW, Sommer LE, 1982. Total carbon, organic carbon, and organic matter. In: Page AL, Miller RH, Keeney DR (Eds. ), Methods of Soil Analysis. American Society of Agronomy and Soil Science Society of American, Madison: 1–129. Ozanne PG, Kirkton DJ, Shaw TC. 1961. The loss of phosphorus from sandy soils. Australian Journal of Agricultural Research, 12(3): 409−423. doi: 10.1071/AR9610409 Parsekian AD, Singha K, Minsley BJ, et al. 2015. Multiscale geophysical imaging of the critical zone. Reviews of Geophysics, 53(1): 1−26. doi: 10.1002/2014RG000465 Qiu L, Wei X, Gao J, et al. 2015. Dynamics of soil aggregate-associated organic carbon along an afforestation chronosequence. Plant and Soil, 391(1): 237−251. doi: 10.1007/s11104-015-2415-7 Reverey F, Grossart H, Premke K, et al. 2016. Carbon and nutrient cycling in kettle hole sediments depending on hydrological dynamics: A review. Hydrobiologia, 775(1): 1−20. doi: 10.1007/s10750-016-2715-9 Rumpel C, Chabbi A. (2019). Chapter 1 - Plant–Soil Interactions Control CNP Coupling and Decoupling Processes in Agroecosystems With Perennial Vegetation. In G. Lemaire, P. C. D. F. Carvalho, S. Kronberg & S. Recous (Eds. ), Agroecosystem Diversity (3–13): Academic Press. (Reprinted). Salmon VG, Brice DJ, Bridgham S, et al. 2021. Nitrogen and phosphorus cycling in an ombrotrophic peatland: A benchmark for assessing change. Plant and Soil, 466(1): 649−674. doi: 10.1007/s11104-021-05065-x Santos IR, Chen X, Lecher AL, et al. 2021. Submarine groundwater discharge impacts on coastal nutrient biogeochemistry. Nature Reviews Earth & Environment, 2(5): 307−323. doi: 10.1038/s43017-021-00152-0 Seifollahi-Aghmiuni S, Nockrach M, Kalantari Z. 2019. The potential of wetlands in achieving the sustainable development goals of the 2030 Agenda. Water, 11(3). Shiau Y, Chiu C. 2020. Biogeochemical processes of C and N in the soil of mangrove forest ecosystems. Forests, 11(5). Tang J, Wang W, Yang L, et al. 2019. Variation in quantity and chemical composition of soil dissolved organic matter in a peri-urban critical zone observatory watershed in Eastern China. Science of The Total Environment, 688: 622−631. doi: 10.1016/j.scitotenv.2019.06.270 Tanner DK, Brazner JC, Brady VJ. 2000. Factors influencing carbon, nitrogen, and phosphorus content of fish from a Lake Superior coastal wetland. Can J Fish Aquat Sci, 57(6): 1243−1251. doi: 10.1139/f00-062 Wang M, Moore TR. 2014. Carbon, nitrogen, phosphorus, and potassium stoichiometry in an ombrotrophic peatland reflects plant functional type. Ecosystems, 17(4): 673−684. doi: 10.1007/s10021-014-9752-x Wei Y, Wen D, Li Z, et al. 1989. Engineering fluid mechanics. Beijing: China Architecture & Building Press. Wei X, Li X, Jia X, et al. 2013. Accumulation of soil organic carbon in aggregates after afforestation on abandoned farmland. Biology and Fertility of Soils, 49(6): 637−646. doi: 10.1007/s00374-012-0754-6 Wieder WR, Cleveland CC, Smith WK, et al. 2015. Future productivity and carbon storage limited by terrestrial nutrient availability. Nature Geoscience, 8(6): 441−444. doi: 10.1038/NGEO2413 Xu G, Li Y, Shen Y, et al. 2019. Soil organic carbon distribution and components in different plant communities along a water table gradient in the Huixian karst wetland in Guilin. Huanjing Kexue, 40(3): 1491−1503. doi: 10.13227/j.hjkx.201806205 Yu J, Zhan C, Li Y, et al. 2016. Distribution of carbon, nitrogen and phosphorus in coastal wetland soil related land use in the Modern Yellow River Delta. Scientific Reports, 6(1): 37940. doi: 10.1038/srep37940 Yue L, Kong W, Ji M, et al. 2019. Community response of microbial primary producers to salinity is primarily driven by nutrients in lakes. Science of the Total Environment, 696: 1−10. doi: 10.1016/j.scitotenv.2019.134001 Zhang K, Wu X, Wang W, et al. 2022. Anaerobic oxidation of methane (AOM) driven by multiple electron acceptors in constructed wetland and the related mechanisms of carbon, nitrogen, sulfur cycles. Chemical Engineering Journal, 433: 133663. doi: 10.1016/j.cej.2021.133663 Zheng D, Gu W, Zhou Q, et al. 2020. Ammonia oxidation and denitrification in a bio-anode single-chambered microbial electrolysis cell. Bioresource Technology, 310: 123466. doi: 10.1016/j.biortech.2020.123466 -


 点击查看大图

计量
- 文章访问数: 1880
- HTML全文浏览量: 1011
- PDF下载量: 84
- 被引次数: 0


