 E-mail alert
 Rss
Rss

Physico-chemical, bacteriological and health hazard effect analysis of the water in Taladanda Canal, Paradip area, Odisha, India
-
Abstract: The physico-chemical and bacteriological parameters of the water in Taladanda canal and associated water-borne diseases,from which the dwellers have suffered,were studied,by using statistical method. Overuse and the addition of the wastes with sources from urbane industrial sectors,as well as the decrease in water level have caused the canal water quality declined drastically and subsequently led to extensive eutrophication and bacterial contamination. According to the water sample analytical results,the water is lightly acidic with the pH value of 4.5~6.7. The measured indexes,such as total dissolved solid (TDS),electrical conductivity (EC),total suspended solid (TSS),Mn,Zn,Al,Fe,Cu,Cr,and Hg etc,mostly have very high concentrations which are higher than permissible limit,indicating that the canal water is completely unsuitable for human consumption. Furthermore,the biological analysis shows that the total coliform (TC) is in the range of 45.9~30.2 in per 100 mL water in April,30.5~25.3/100 mL in July and 52.9~35.4/100 mL in December,respectively. Similarly,fecal coliform (FC) ranges from 12.8 to 10.1,10.5~7.5 and 13.1~6.4 per 100 mL water in the months of April,July and December respectively. As a result,people who use the water have suffered from different water-borne diseases. On the basis of disease data derived from hospital observations in a period of three years,there had been 4 284 people affected by different water-borne diseases from 2016 to 2018.
-
Key words:
- Water quality /
- Pollution /
- Physico-chemical assessment /
- Bacteriological parameters /
- Health hazard /
- Coliform /
- E. coli
-

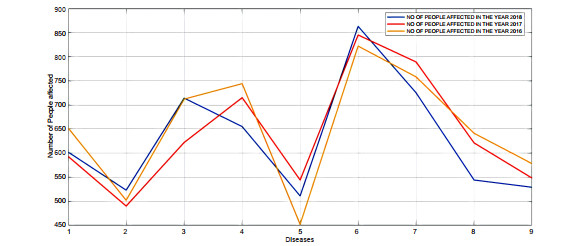
Figure 2. Statistical graph of the number of people infected by various diseases
Data 1: The disease diarrhea; data 2: The giardia and cryptosporidium; data 3: Dysentery; data 4: Salmonella; data 5: Escherichia; data 6: Typhoid fever; data 7: Cholera; data 8: The hepatitis A; data 9: Campylobacter.

Figure 3. Kind of diseases vs number of people affected in 2016, in which the most people affected by typhoid and the least people affected in escherichia coli, comparing with other water-borne diseases

Figure 4. Kind of diseases vs number of people affected in 2017, in which the most people affected by typhoid fever and least people by giardia and cryptosporidium

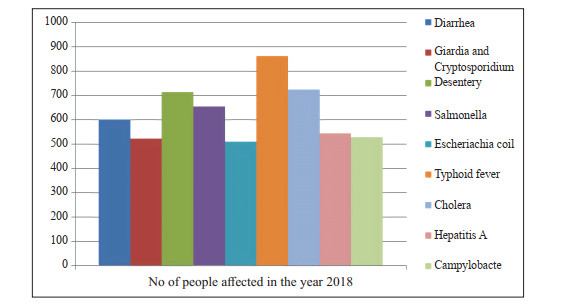
Figure 5. Kind of diseases vs number of people affected in 2018 when the most people affected by typhoid disease and the least by escherichia coli
Table 1. The disease that transmitted through the drinking water
Disease Bacterial agent Cholera Vibrio cholera Vibrios caused by gastroenteritis Vibrio parahaemolyticus Typhoid fever Salmonella typhi Bacillary dysentery or shigellosis Shigelladysenteriae, shigellaflexneri, shigellaboydii, shigellasonnei Gastroenteritis and acute diarrheas Escherichia coli, particularly serotype  下载: 导出CSV
Table 2. Water parameters, source of occurrence and effect
Parameters Occurrence Effect Turbidity Soil runoff Cause of pathogens Colour Dissolved colloidal form of materials Odour Degradation by bacterial community Disagreeable odour Electrical Conductivity Presence of dissolved solid in water in ionic form If the concentration of ionisable ions is high the conductivity will be more and the property of corrosion increases pH Because of different gas and solid mate-rials Cause of bitterness and corrosion of the materials DO Because of oxygen present in the dis-solved state in water Most corrosive gas in the environment and cause of corrosion in water and oil pipe lines, boilers, machinery parts, automobile parts TH Presence of chloride, sulphates and bicar-bonates of Ca and Mg salts. Mostly found in some mineral present in water Cause of decrease in foam producing capacity with soap solution TA (Total Alkalinity) Because of the presence of the different alkaline gases in dissolved state Cause of embrittlement in bottom part of boiler steel TDS Because of the dissolved fine particles of solid materials and salts Cause of Gastro-intestinal diseases, eye irritation and corrosion of some metals Calcium (Ca) Found from soap and anions of some dissolved salts. Influencing in the dying process of textile indus-tries
下载: 导出CSV
Table 3. Bacteriological analysis of drinking water samples in the Paradip City
Water samples collected at different areas of Paradip City MPN test in April-2018 MPN test in July-2018 MPN test in December-2018 TC Bacteria/100 mL FC Bacteria/100 mL TC Bacteria/100 mL FC Bacteria/100 mL TC Bacteria/100 mL FC Bacteria/100 mL S1 38.2 10.1 25.3 9.2 45.2 10.2 S2 44.4 12.4 29.3 8.8 39.1 11.2 S3 42.5 11.3 31.4 8.5 35.4 10.5 S4 42.2 10.5 30.4 8.7 36.2 12.1 S5 45.9 11.2 30.5 9.9 37.5 11.3 S6 45.6 11.5 31.1 9.2 44.1 10.2 S7 30.2 11.2 32.1 9.6 36.1 10.5 S8 48.5 10.6 26.4 9.1 41.2 11.5 S9 32.4 10.7 29.5 8.2 40.2 8.4 S10 32.2 10.5 25.6 8.1 41.6 7.9 S11 32.2 10.4 26.5 8.5 40.5 6.4 S12 40.3 11.2 26.4 7.9 45.6 10.4 S13 35.5 10.4 26.3 7.5 46.2 6.5 S14 34.2 11.4 28.9 9.5 46.2 7.6 S15 52.4 12.8 26.6 10.5 52.9 13.1
下载: 导出CSV
Table 4. Analysis of physico-chemical parameters in April, 2018
Parameters Water samples collected in Paradip City during first series L1 L2 L3 L4 L5 L6 L7 L8 L9 L10 L11 L12 L13 L14 L15 Temperature (℃) 20 19 18 19 19 20 19 19 19 18 18 20 19 21 18 Colour CL CL CL CL CL CL CL CL CL CL CL CL CL CL CL Odour OL OL OL OL OL OL OL OL OL OL OL OL OL OL OL pH 6.7 6.6 6.5 6.2 6.5 6.5 6.4 6.4 6.5 6.3 6.4 6.6 6.5 6.6 6.4 EC (µs/cm) 311 318 312 311 314 311 315 314 316 319 317 318 314 316 317 TDS (ppm) 751.2 754.2 759.4 752.6 758.6 745.2 746.2 749.2 746.5 742.3 750.1 760.4 764.4 741.2 740.5 TSS (mg/L) 375.1 378.4 382.1 384.1 389.1 377.4 378.2 389.1 389.4 398.4 385.4 387.8 398.4 388.4 385.4 TH (ppm) 48 38 47 49 31 37 37 31 52 53 46 43 54 47 59 Ca (mg/L) 32 40 44 48 32 44 40 27 44 40 40 55 44 48 44 Mg (mg/L) 24 27 30 30 28 35 41 26 17 15 17 30 37 40 27 Cl (mg/L) 46 34 40 29 32 31 30 37 35 38 31 40 41 31 37 DO (mg/L) 4.9 4.5 4.7 5.9 5.01 4.2 4.9 4.8 4.7 4.6 4.8 4.7 4.4 5.1 5.1 NO2- (mg/L) 28 29 28 25 36 35 41 28 36 3.9 29 32 38 27 31 NO3- (mg/L) 30 50 30 20 30 30 45 58 35 50 50 40 20 20 48 SO42- (mg/L) 25 24 32 24 35 24 25 29 27 26 24 28 24 26 26 Alkalinity 100 150 200 150 150 100 150 150 120 120 100 100 120 100 100 Mn (mg/L) 0.1 0.3 0.4 0.8 0.5 0.2 0.4 0.7 0.8 0.8 0.5 0.6 0.1 0.4 0.4 Zn (mg/L) 0.3 0.2 0.1 0.2 0.5 0.4 0.2 0.8 0.2 0.3 0.1 0.6 0.4 0.3 0.1 Al (mg/L) 0.2 0.2 0.1 0.1 0.01 0.3 0.1 0.2 0.1 0.3 0.1 0.3 0.2 0.5 0.1 F (mg/L) 1.5 0.2 0.2 0.8 0.5 2.4 1.7 1.5 1.9 0.2 0.2 1.8 0.6 1.5 1.2 Fe (mg/L) 0.9 0.6 0.8 0.5 0.9 0.9 0.6 0.9 0.1 0.1 0.5 1.2 0.9 1.6 1.4 Cu (mg/L) 0.2 0.5 0.1 0.2 0.5 0.9 0.2 0.2 0.4 0.5 0.1 0.1 0.9 0.3 1 Cr (mg/L) 0.1 0.5 0.5 0.1 0.3 0.3 0.2 0.1 0.3 0.1 0.3 0.1 0.2 0.2 0.1 Hg (mg/L) 0.01 0.03 0.02 0.01 0.04 0.03 0.01 0.02 0.03 0.02 0.02 0.01 0.03 0.02 0.01
下载: 导出CSV
Table 5. Analysis of physico-chemical parameters in July, 2018
Parameters Water samples collected in Paradip City during second series L1 L2 L3 L4 L5 L6 L7 L8 L9 L10 L11 L12 L13 L14 L15 Temperature (℃) 21 18 21 20 17 22 18 21 22 19 19 20 19 17 21 Colour CL CL CL CL CL CL CL CL CL CL CL CL CL CL CL Odour OL OL OL OL OL OL OL OL OL OL OL OL OL OL OL pH 6.4 5.3 5.2 5.5 5.2 5.1 4.9 4.6 5.2 4.8 4.5 5.1 4.6 5.1 5.3 EC (µs/cm) 299 306 305 300 301 302 304 307 304 304 302 304 303 299 300 TDS (ppm) 850.1 863.5 846.2 851.3 831.2 825.1 851.2 831.4 862.1 843.2 856.4 854.5 859.4 863.1 839.1 TSS (mg/L) 423.2 452.3 421.6 413.2 411.2 429.5 427.4 425.2 427.1 426.1 411.2 419.4 416.2 418.5 417.2 TH (ppm) 27 26 31 28 26 21 27 29 24 24 25 23 21 24 28 Ca (mg/L) 36 44 32.6 52 38 55 40 32 28 32 35 32 28.5 36 30 Mg (mg/L) 30.1 35 30.1 26 40 25 27 32 33 19 30 27 34 28 25 Cl (mg/L) 19 31 24 21 20 25 26 21 19 23 24 25 26 21 19 DO (mg/L) 5.1 5.2 5 3.7 3.6 3.5 3.4 4.9 4.5 4.7 4.5 4.3 4.2 4.1 4.2 NO2- (mg/L) 35 32 30 26 35 52 42 37 27 25 50 35 42 42 40 NO3- (mg/L) 24 26 25 30 45 48 41 46 48 43 35 38 35 31 34 SO42- (mg/L) 25 19 32 18 35 21 25 18 27 26 24 15 19 21 26 Alkalinity 150 120 120 100 100 120 100 100 100 150 200 150 150 100 130 Mn (mg/L) 0.1 0.2 0.5 0.8 0.7 0.2 0.4 0.7 0.4 0.7 0.5 0.6 0.1 0.3 0.4 Zn (mg/L) 0.3 0.4 0.1 0.2 0.4 0.4 0.2 0.7 0.2 0.6 0.1 0.6 0.4 0.3 0.1 Al (mg/L) 0.6 2.3 1.1 0.6 0.8 1.1 1.6 1.2 1.1 0.2 0.8 0.6 0.7 1 1.2 F (mg/L) 1 0.5 0.3 0.9 0.8 1.2 1.1 0.7 1.2 0.3 0.9 0.8 0.8 0.8 1 Fe (mg/L) 0.1 0.1 0.1 0.2 0.1 0.3 0.4 0.2 0.1 0.1 0.1 0.1 0.1 0.1 0.1 Cu (mg/L) 0.1 0.4 0.1 0.2 0.5 0.9 0.3 0.2 0.6 0.5 0.1 0.1 0.9 0.3 1.0 Cr (mg/L) 0.1 0.5 0.5 0.1 0.3 0.3 0.2 0.1 0.3 0.1 0.3 0.1 0.2 0.2 0.1 Hg (mg/L) 0.02 0.03 0.02 0.02 0.04 0.03 0.01 0.02 0.03 0.01 0.02 0.01 0.03 0.02 0.01
下载: 导出CSV
Table 6. Analysis of physicochemical parameters in December, 2018
Parameters Water samples collected in Paradip City during third series L1 L2 L3 L4 L5 L6 L7 L8 L9 L10 L11 L12 L13 L14 L15 Temperature (℃) 20 19 18 19 19 20 19 19 19 18 18 20 19 21 18 Colour CL CL CL CL CL CL CL CL CL CL CL CL CL CL CL Odour OL OL OL OL OL OL OL OL OL OL OL OL OL OL OL PH 4.5 4.6 4.2 5.2 4.8 4.9 5.3 4.6 4.5 5.1 5.3 4.9 6.2 5.9 5.4 EC (µs/cm) 301 305 303 302 305 306 312 311 310 314 315 311 309 308 314 TDS (ppm) 700.4 709.1 720.6 700.1 710.6 708.4 709.5 707.7 709.2 712.5 720.4 711.6 713.4 711.5 718.6 TSS (mg/L) 351.6 345.6 340.2 346.4 351.5 360.4 342.6 349.2 339.5 347.6 346.7 340.8 353.4 351.4 350.4 TH (ppm) 26 24 31 29 26 21 27 29 24 24 25 23 26 24 28 Ca (mg/L) 32 40 44 48 32 44 40 27 44 40 40 55 44 48 44 Mg (mg/L) 24 27 30 30 28 35 41 26 17 15 17 30 37 40 27 Cl (mg/L) 106 78 99 106 72 78 90 106 90 78 78 90 108 150 110 DO (mg/L) 5.8 5.9 5.8 4.5 5.6 5.5 5.0 5.8 5.6 5.9 5.9 5.2 5.8 5.7 5.3 NO2- (mg/L) 30 50 30 20 30 30 45 58 35 50 50 40 20 20 48 NO3- (mg/L) 120 120 120 100 120 100 120 80 80 100 115 90 90 120 110 SO42- (mg/L) 100 150 200 150 150 100 150 150 120 120 100 100 120 100 100 Alkalinity 100 100 150 200 150 150 100 130 150 120 120 100 100 120 100 Mn (mg/L) 0.3 0.2 0.5 0.7 0.7 0.2 0.4 0.7 0.2 0.7 0.5 0.6 0.1 0.3 0.4 Zn (mg/L) 0.3 0.4 0.1 0.2 0.4 0.4 0.2 0.7 0.2 0.5 0.1 0.6 0.4 0.3 0.1 Al (mg/L) 1.5 0.2 0.2 0.8 0.5 2.4 1.7 1.5 1.9 0.2 0.2 1.8 0.6 2.5 1.9 F (mg/L) 0.9 0.6 0.8 0.5 0.9 0.9 0.6 0.9 0.1 0.1 0.5 1.2 0.9 1.6 1.4 Fe (mg/L) 0.2 0.5 0.1 0.2 0.5 0.4 0.2 0.4 0.5 0.7 0.1 0.6 0.7 0.3 1 Cu (mg/L) 0.1 0.3 0.1 0.2 0.4 0.9 0.3 0.2 0.7 0.5 0.1 0.1 0.8 0.3 1 Cr (mg/L) 0.2 0.5 0.4 0.1 0.3 0.3 0.2 0.1 0.2 0.1 0.3 0.1 0.2 0.2 0.1 Hg (mg/L) 0.02 0.04 0.02 0.02 0.05 0.03 0.01 0.01 0.03 0.01 0.02 0.01 0.05 0.02 0.07
下载: 导出CSV
-
APHA. 2005. Standard methods for the examina-tion of water and wastewater. 21st Edition, American Public Health Association/American Water Works Association/Water Environment Federation, Washington DC. Barik RN, Pradhan B, Patel RK. 2005. Trace elements in groundwater of Paradip area. Journal of Industrial Pollution Control, 21(2): 355-362. http://www.zhangqiaokeyan.com/academic-journal-foreign_other_thesis/0204110350376.html Cabral JPS. 2010. Water microbiology. Bacterial pathogens and water. International Journal of Environmental Research and Public Health, 7(10): 3657-3703. Doi: 10.3390/ijerph7103657. Chatanga P, Ntuli V, Mugomeri E, et al. 2019. Situational analysis of physico-chemical, biochemical and microbiological quality of water along Mohok are river, Lesotho. The Egyptian Journal of Aquatic Research, 45: 45-51. doi: 10.1016/j.ejar.2018.12.002 Das J, Singh BK, Sahoo RK. 2002. Urban ground water pollution: A case study in Cuttack City, India. Ground Water Monitoring and Reme-diation, 22(3): 95-103. Doi: https://doi.org/ 10.1111/j.1745-6592.2002.tb00758.x Das PD, Karim AA, Panda RB. 2013. Assessment of groundwater quality in and around Para-deep phosphate limited at Paradeep area, Odisha, India. International Journal of Recent Scientific Research, 4(10): 1459-1464. http://www.researchgate.net/publication/273124900_assessment_of_groundwater_quality_in_and_around_paradeep_phosphate_limited_at_paradeep_area_odisha_india Das PP, Mohapatra PP, Sahoo HK, et al. 2016. A geospatial analysis of fluoride contamination of groundwater in Paradeep area, Odisha, India. Environmental Geochemistry, 19(1 & 2): 11-14. http://www.researchgate.net/publication/316989430_A_GEOSPATIAL_ANALYSIS_OF_FLUORIDE_CONTAMINATION_OF_GROUNDWATER_IN_PARADEEP_AREA_ODISHA_INDIA Das SK, Gerwal AS, Bamerjee M. 2011. A brief review: Heavy metal and their analysis. International Journal of Pharmaceutical Sciences Review and Research, 11(1): 13-18. Duressa G, Assefa F, Jida M. 2019. Assessment of bacteriological and physicochemical quality of drinking water from source to household tap connection in Nekemte, Oromia, Ethiopia. Journal of Environmental and Public Health, 1-7. Doi: https://doi.org/ 10.1155/2019/2129792 Gupta N, Pandey P, Hussain J. 2017. Effect of physicochemical and biological parameters on the quality of river water of Narmada, Madhya Pradesh, India. Water Science, 31(1): 11-23. Doi: https://doi.org/ 10.1016/j.wsj.2017.03.002. Gwimbi P, George M, Ramphalile M. 2019. Bac-terial contamination of drinking water sources in rural villages of Mohale Basin, Lesotho: exposures through neighborhood sanitation and hygiene practices, Environmental Health and Preventive Medicine, 24: 33-40. Doi: 10.1186/s12199-019-0790-z Hosseini N, Johnston J, Lindenschmidt K. 2017. Impacts of climate change on the water quality of a regulated Prairie River. Water, 9(3): 1-15. Doi: 10.3390/w9030199 Huntington T, Nimmo F, Macfadyen G. 2015. Fish landings at the world's commercial fishing ports. Journal of Ocean and Coastal Economics, 2(1): 1-9. Doi: https://doi.org/ 10.15351/2373-8456.1031 ISI. 1983. Indian standard: Specification for drinking water, New Delhi. India: Indian Standards Institution. Kar T, Debata S. 2019. Breeding ecology of the endangered black-bellied tern (Sterna acuticauda) in eastern India and implications for conservation. Water Birds, 42(3): 314-320. Doi: https://doi.org/ 10.1675/063.042.0307 Kiss J. 2019. Pesticides in agriculture: Are we sustainable yet? Journal of Consumer Protec-tion and Food Safety, 14: 205-207. Doi: https://doi.org/ 10.1007/s00003-019-01246-0 Lultle DR, Siwakoti M, Jha PK. 2019. Climate change and finger millet: Perception, trend and impact on yield in different ecological regions in Central Nepal. Journal of Mountain Science, 16(4):821-835. Doi: https://doi.org/ 10.1007/s11629-018-5165-1 Mansoori N, Bakar I, Shahid N, et al. 2018. Microbial contamination; A survey of microbial contamination of toothbrushes among general population of Karachi. The Professional Medical Journal, 25(11): 1785-1790. Doi: 10.29309/TPMJ/18.4456 Melki S, Asmi AME, Gueddari M. 2019. Inferred industrial and agricultural activities impact on groundwater quality of Skhira Coastal Phreatic Aquifer in southeast of Tunisia (Mediterranean Region), Geofluids: 1-19. Doi: 10.1155/2019/9465498 Mishra B. 2010. Agriculture, industry and mining in Orissa in the Post-Liberalization Era: An inter-district and inter-state panel analysis. Economic & Political Weekly, 15: 49-68. Doi: https://www.jstor.org/stable/27807027 Mishra K, Nayak PL. 2014. A study of water pollution in two major rivers in Odisha-Mahanadi and Brahmani. Middle-East Journal of Scientific Research, 22(12): 1760-1770. Doi: 10.5829/idosi.mejsr.2014.22.12.21634 Murali RM, Shrivastava D, Vethamony P. 2009. Monitoring shoreline environment of Paradip, east coast of India using remote sensing. Current Science, 97(1): 79-84. http://agris.fao.org/agris-search/search.do?recordID=AV20120145001 Pal P, Sarangi DK. 2018. Impact of biomedical waste on Cuttack City. Current World Envi-ronment, 13(2): 259-269. Doi: http://dx.doi.org/ 10.12944/CWE.13.2.11 Palei NC, Rath BP, Pradhan SD, et al. 2014. The water birds of paradeep phosphate limited (PPL) campus of Jagatsinghpur District in Odisha, India. World Journal of Zoology, 9(3): 208-213. Doi: 10.5829/idosi.wjz.2014.9.3.8552. Panda PK, Panda RB, Dash PK. 2018. The river water pollution in India & abroad-A critical review to study the relationship among different physico-chemical parameters. American Journal of Water Resources, 6(1): 25-38. Doi: 10.12691/ajwr-6-1-4 Panigrahi AK, Pattnaik S. 2019. A Review on consequences of pollution of some Indian major rivers and their remedial measures. International Journal of Research & Review, 6(7): 373-383. Doi: http://www.inrein.com/10.4444/ijrr.1002/1233.html Prusty R, Biswal T. 2017. Water quality assessment of Taladanda canal in the command area of Cuttack City. International Journal of Advances in Agricultural Science and Tech-nology, 4(8): 40-48. Rai S, Kaur A, Sethi GK, et al. 2019. Association of fecal micro flora with bronchiolitis. The Indian Journal of Pediatric, 86(8): 757. Doi: https://doi.org/ 10.1007/s12098-019-02929-0 Samantray P, Mishra BK, Panda CR, et al. 2009. Assessment of water quality index in Ma-hanadi and Atharbanki River and Taladanda canal in Paradip area, India. Journal of Human Ecology, 26(3):153-161. Doi: https://doi.org/ 10.1080/09709274.2009.11906177 Samantray P, Pati RC, Panda CR, et al. 2011. The problem of ground water pollution: A case study from Paradip Port City, India. Asian Journal of Research in Chemistry, 4(6): 957-959. http://search.ebscohost.com/login.aspx?direct=true&db=aph&AN=109498660&site=ehost-live Sentas A, Psilovikos A, Psilovikos T, et al. 2016. Statistical analysis and assessment of water quality parameters in Pagoneri, River Nestos. European Water, 55: 115-126. http://www.researchgate.net/publication/320869295_Statistical_Analysis_and_Assessment_of_Water_Quality_Parameters_in_Pagoneri_River_Nestos Shukla DP, Vaghela KB, Jain NK. 2017. Assess-ment of physico-chemical and bacteriological water quality parameters: A review. Interna-tional Journal of Pharmacy and Integrated Life Sciences, 5(2): 1-17. http://www.researchgate.net/publication/314951607_Assessment_of_Physico-chemical_and_Bacteriological_Water_Quality_Parameters_A_Review -


 点击查看大图
计量
- 文章访问数: 1199
- HTML全文浏览量: 477
- PDF下载量: 124
- 被引次数: 0


